

Abstract
The chemical shift of the 129Xe NMR signal has been shown to be extremely sensitive to the local environment around the atom and has been used to follow processes such as ligand binding by bacterial periplasmic binding proteins. Here we show that the 129Xe shift can sense more subtle changes: magnesium binding, BeF3− activation, and peptide binding by the Escherichia coli chemotaxis Y protein. 1H-15N correlation spectroscopy and X-ray crystallography were used to identify two xenon-binding cavities in CheY that are primarily responsible for the shift changes. One site is near the active site, and the other is near the peptide binding site.
Keywords: xenon binding, CheY, protein cavities, protein conformation assay
Several properties of 129Xe have made it an attractive NMR-based biomolecular probe. These include xenon’s affinity for small hydrophobic cavities in proteins, the remarkable chemical shift sensitivity of xenon to nonbonded local environment, and the signal-to-noise enhancement made possible by optical pumping (Goodson 2001). Laser-polarized 129Xe nuclear magnetic resonance (129Xe NMR) spectra are simple, have no background, and can be obtained in a single scan (Goodson 2001). 129Xe NMR has been used to probe hydrophobic cavities in several proteins, including myoglobin, hemoglobin, T4 lysozyme, maltose binding protein, and recently an engineered cavity in the ribose binding protein (Tilton and Kuntz 1982; Bowers et al. 1999; Rubin et al. 2002; Lowery et al. 2004).
The possibility of using 129Xe NMR as a means for detecting biomolecular conformational states was first demonstrated for maltose binding protein, MBP (Rubin et al. 2000). When MBP binds maltose, which changes it from the open to the closed conformation, the observed 129Xe chemical shift moves 0.9 ppm mM−1 upfield (Rubin et al. 2000). The dependence of 129Xe chemical shift on MBP conformation arises from a single xenon binding cavity whose 129Xe chemical shift and binding affinity depend on the protein’s conformation, a conformation-sensitive xenon-binding cavity (Rubin et al. 2002). Because such a cavity serves as a conformational reporter site, the protein does not need modification and is fully recoverable after analysis.
Here we report a further example in which 129Xe NMR responds to several conformational states of the Escherichia coli chemotaxis Y protein (CheY). CheY (12 kDa) is a signal transduction protein required for chemotaxis that is activated by phosphorylation on a conserved aspartate residue (Asp57). Phosphorylation induces a conformational change that increases CheY’s affinity for its downstream target protein, FliM (Falke et al. 1997). Here we demonstrate that CheY contains two xenon-binding cavities that confer 129Xe chemical shift sensitivity to three different protein functional states as well as providing moderate sensitivity to peptide binding. 1H-15N correlation spectroscopy (HSQC) and X-ray crystallography were used in identifying and characterizing the sites of xenon binding.
Results
129Xe chemical shift sensitivity to CheY conformation
The change in 129Xe chemical shift with increasing protein concentration (the concentration-normalized 129Xe chemical shift) is a useful means of characterizing xenon–protein interactions. A significant difference between the concentration-normalized 129Xe chemical shift of the folded and unfolded states of a protein indicates the presence of a xenon-binding cavity (Rubin et al. 2002). Figure 1 ▶ shows a plot of the 129Xe chemical shift as a function of protein concentration for the folded and unfolded conformations of CheY. The concentration-normalized 129Xe chemical shift values for the folded and unfolded CheY conformations are, respectively, 1.6 ± 0.1 ppm mM−1 and 0.4 ± 0.1 ppm mM−1. The strong dependence of xenon chemical shift on the folded state of CheY, twice the magnitude seen for MBP (Rubin et al. 2002), indicates the presence of at least one xenon-binding cavity.
Figure 1.

Change in 129Xe chemical shift (ΔδXe) with protein concentration (C) for apo (○), magnesium-bound (▪), activated (•), FliM peptide-bound (□), and denatured (⋄) CheY. Δ δXe is the difference between the 129Xe chemical shift of each titration point and buffer. 129Xe chemical shift values and error bars (± 0.01 ppm) were obtained from peak fits. The concentration-normalized 129Xe chemical shifts, or slopes of the lines, are 1.6 ± 0.1 ppm mM−1, 1.3 ± 0.1 ppm mM−1, 0.8 ± 0.1 ppm mM−1, 0.7 ± 0.1 ppm mM−1, and 0.4 ± 0.1 ppm mM−1, for apo, magnesium-bound, activated, FliM-bound, and denatured CheY, respectively. 129Xe chemical shift is sensitive to four different CheY functional states.
Figure 1 ▶ also shows that 129Xe is affected differently by different states of CheY; the normalized shifts for the states—inactive, magnesium-bound, activated, and FliM-peptide bound—are 1.6 ± 0.1 ppm mM−1, 1.3 ± 0.1 ppm mM−1, 0.8 ± 0.1 ppm mM−1, and 0.7 ± 0.1 ppm mM−1, respectively. The sensitivity of 129Xe chemical shift to four CheY conformations is the first example of 129Xe responding to more than two different protein conformational states for a single protein and the first example of 129Xe sensitivity to protein–peptide binding.
Identifying the xenon-binding cavities with 1H-15N HSQC spectroscopy
The location of xenon binding cavities in proteins can be determined using amide 1H-15N correlation (HSQC) spectra taken at different xenon concentrations (Rubin et al. 2002; Lowery et al. 2004). Assigned 1H-15N HSQC resonances affected by increasing xenon concentration can be mapped onto the protein structure, identifying the region of the protein that is involved in xenon binding (Rubin et al. 2002; Gröger et al. 2003).
1H-15N HSQC spectra were collected from both inactive and activated CheY conformations in the presence and absence of xenon. The total amide proton chemical shift difference between 0 mM and ~40 mM xenon for each residue of both the inactive and active conformations are plotted as histograms in Figure 2, A and B ▶. Three regions in the sequence are affected by xenon binding, residues near Asp12, residues near Asp57, and residues between Thr87 and Tyr106. Mapping the residues according to the magnitude of their xenon-induced shifts onto the inactive CheY backbone shows that the residues whose environments are perturbed most by increasing xenon concentration cluster about two cavities that were identified with the program VOIDOO (Fig. 3A ▶). One of these cavities (H1-β3) is located directly below residues Asp57 and Asp12, involving residues from H1, β1, β3, and β4. The second cavity (β4-H4) is located near Tyr106, involving residues from β5, H4, and β5 (Cho et al. 2000; Lee et al. 2001a). The residues that significantly shift upon xenon binding for the activated conformation of CheY cluster about similar regions of the protein (Fig. 3B ▶).
Figure 2.

Histogram plots of the total xenon-induced shift for each assigned residue. (A) Shifts induced by 40 mM xenon for apo CheY. (B) Shifts induced by 45 mM xenon for activated CheY. Similar segments of the protein undergo xenon-induced shifts for both CheY conformations.
Figure 3.
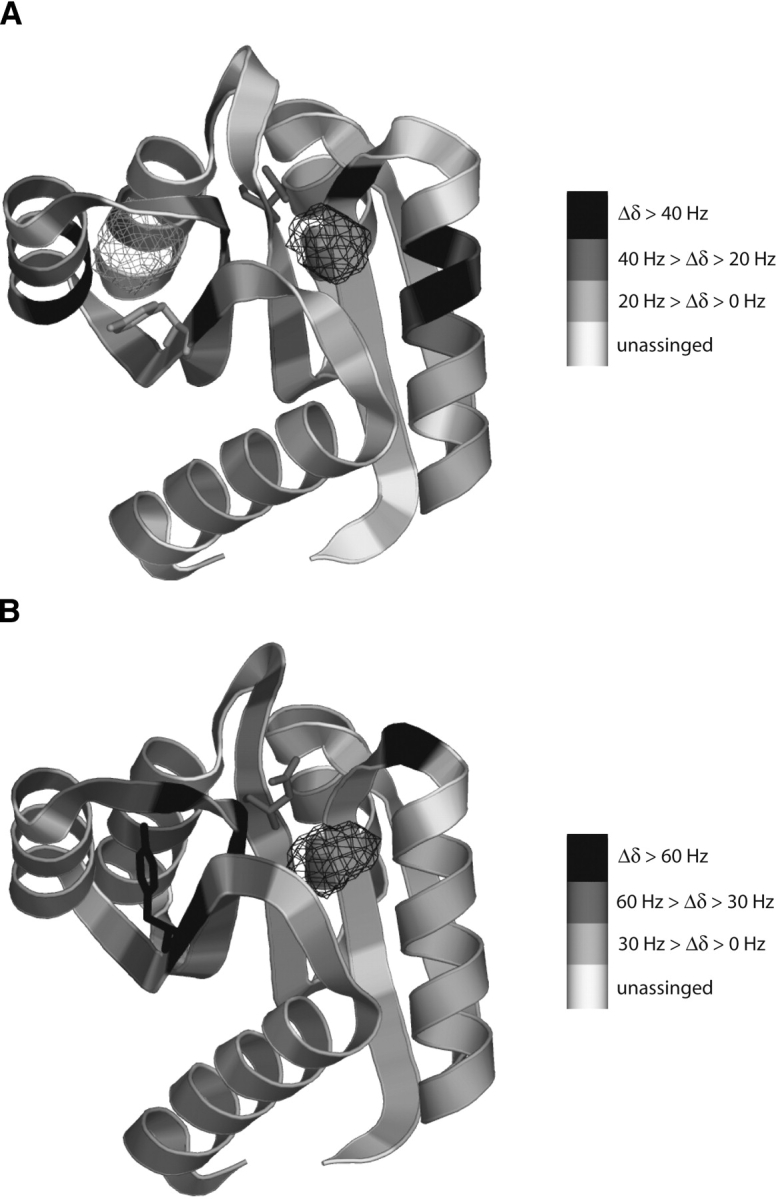
Xenon-induced shifts from Figure 2 ▶ mapped on the backbone of apo CheY (A) (Simonovic and Volz 2001) and activated CheY (B) (this work). Residues are shaded according to the magnitude of their xenon-induced shifts. Unassigned residues are shaded white. For both conformations of CheY shifting residues cluster around two cavities identified by VOIDOO, the H1-β3 cavity (black mesh) and the β4-H4 cavity (gray mesh). Magnesium-binding and BeF3− activation occur in the active site, directly above the H1-β3 cavity. The side chains of Tyr106 and Asp57 are shown in both structures. Activation at Asp57 results in Tyr106 changing its position from “out” to “in,” filling the β4-H4 cavity. Cavities were calculated with VOIDOO (Jones et al. 1991) and images generated with PyMol (DeLano Scientific LLC).
Identifying the xenon-binding cavities with X-ray crystallography
The xenon binding sites in CheY were also analyzed using X-ray crystallography. The structure of CheY activated with the aspartyl phosphate mimic BeF3− was previously determined (Lee et al. 2001a) (crystallized in the space group P212121 with two molecules in the asymmetric unit and diffracted to 2.4 Å). Crystals of BeF3− activated CheY were pressurized with 100 psi xenon for 1 min before freezing. Data collection and refinement statistics from the xenon-pressurized crystals are summarized in Table 1.
Table 1.
Crystallographic data collection and refinement statistics
| Crystal | |
| Space group | P212121 |
| Cell dimensions a, b, c (Å) | 53.7, 53.87, 161.1 |
| Data collection (cryogenic) | |
| Resolution limit (Å) | 21.9–2.4 |
| Measured reflections | 224,801 |
| Unique reflections | 19,018 |
| Rsym (%) (overall/last shell) | 10.3/43.9 |
| Completeness (%) (/last shell) | 99.6/99.8 |
| Wilson B-factor (Å 2) | 57.6 |
| Refinement | |
| No. molecules in AU | 2 |
| No. amino acid residues per molecule | 127 |
| No. solvent molecules | |
| No. Mn++ ions | 2 |
| No. water molecules | 174 |
| No. xenon molecules | 2 |
| Resolution used (Å) | 20–2.4 |
| σcutoff | 0.0 |
| No. of reflections work/test | 17,103/1865 |
| Final R-factor/Rfree (|F| > 0 σ) (%) | 22.7/26.7 |
| Average B-factor (Å 2) | 52.3 |
| RMS deviations from ideal geometry | |
| Bond length (Å) | 0.01 |
| Bond angles (deg.) | 1.5 |
Figure 4 ▶ shows a difference electron density omit map (Fobs–Fcalc) with no xenon in the model. Electron density of the xenon atom (greater than 10σ) is evident directly below the active site, consistent with a single xenon atom in the H1-β3 cavity. The occupancy of xenon at this site is 0.3 in the final model. No excess electron density from xenon is evident in the β4-H4 region. Crystals were pressurized at a pressure of 150 psi in an attempt to observe xenon electron density in the β4-H4 region, but crystals cracked under this higher pressure.
Figure 4.
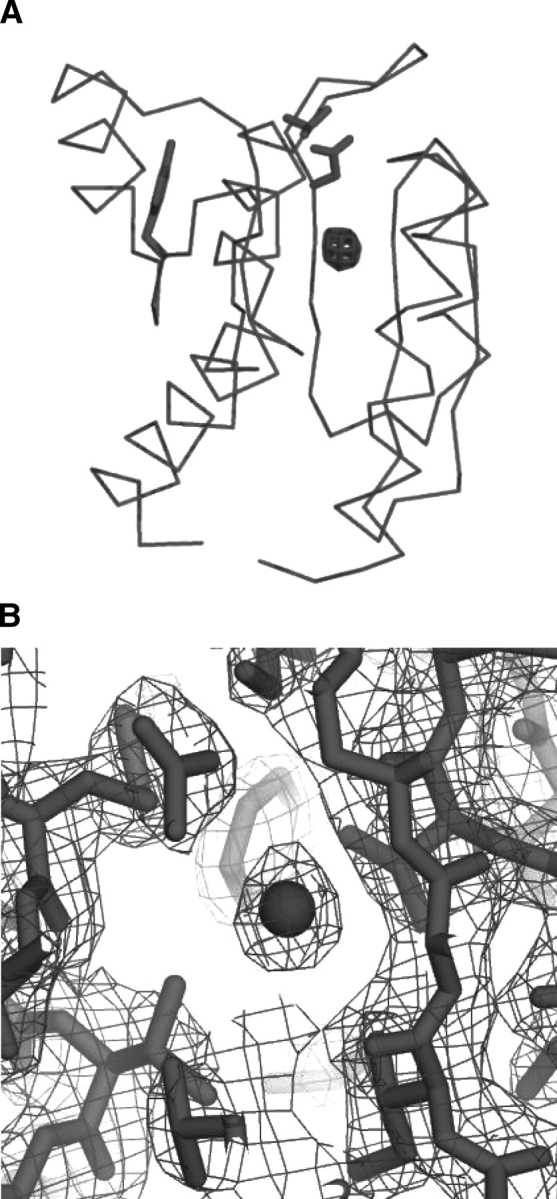
X-ray crystal structure of BeF3−-activated CheY bound to xenon. (A) An Fobs–Fcalc difference electron density omit map (mesh) contoured at 10σ with the xenon atom removed from the model. Electron density from the xenon atom is clearly visible just below the active site inside the H1-β3 cavity. (B) A 2Fobs–Fcalc electron density map (mesh) of the H1-β3 cavity contoured at 1.5σ showing the xenon atom (sphere) and the surrounding residues (sticks).
Xenon affinity of the β4-H4 cavity is conformation dependent
Xenon binding affinities were measured by monitoring the changes in chemical shift of peaks in the 1H-15N HSQC spectra of both inactive and activated CheY with increasing xenon concentration controlled by overpressure (Rubin et al. 2002). Those residues whose resonances underwent the most significant change in chemical shift for both conformers were Asp12, Arg18, Ile20, Asp57, Ala88, Tyr106, and Val107. The binding curves of these residues were fitted to a single-site binding model, as previously described (Rubin et al. 2002). Normalized data were obtained using the limiting shifts obtained from the initial fits. The normalized data for residues unique to the H1-β3 region, Asp12, Arg18, Ile20, and Asp57, were averaged to obtain an average, normalized binding curve for the H1-β3 cavity (Fig. 5A ▶). Similarly, the normalized data for residues Tyr106 and Val107 were averaged to obtain an average, normalized binding curve for the β4-H4 cavity. Fitting these curves yielded xenon association constants for both cavities in the inactive and active conformations of CheY (Table 2). The binding affinity of the H1-β3 cavity in the activated state, ~27 M−1 (Table 2), is comparable to that calculated from the occupancy of xenon in the activated CheY crystal structure, ~10 M−1, assuming 4.4 mM xenon per atm (Rubin et al. 2002). The observed xenon binding affinities are similar to those previously reported for engineered RBP, MBP, and T4 Lysozyme mutants (Rubin et al. 2002; Lowery et al. 2004).
Figure 5.
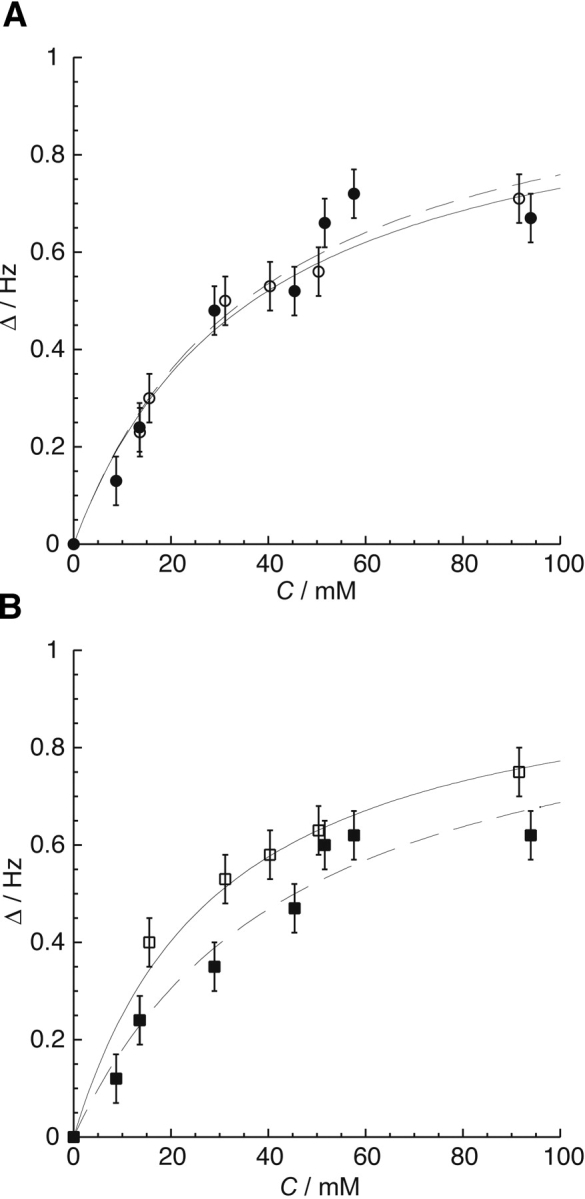
(A) The average of the normalized change in chemical shift (Δ δ) vs. xenon concentration, C, for the amide proton resonances of residues Asp12, Arg18, Ile20, and Asp57, which line the H1-β3 cavity, for the apo (○, solid line) and the activated (•, dashed line) forms of CheY. (B) The average of the normalized change in chemical shift (Δ δ) vs. xenon concentration, C, for the amide proton resonances of residues Tyr106 and Val107, which line the β4-H4 cavity, for the apo (□, solid line) and activated (▪, dashed line) conformations of CheY. Chemical shift changes were normalized according to the limiting shift obtained by an initial fit for each residue. These normalized values were averaged for residues unique to the two cavities to obtain the data and error bars shown in this figure. The respective binding constants obtained from these fits are shown in Table 2. Unlike the H1-β3 cavity, the xenon binding affinity of the β4-H4 cavity changes with activation.
Table 2.
Cavity volumes and xenon binding affinities for the inactive and active conformers of CheY
| Ka(Xe)a/M−1 | Cavity volumeb/Å 3 | |||
| H1-β3 cavity | β4-H4 cavity | H1-β3 cavity | β4-H4 cavity | |
| Inactive | 27 ± 8 | 35 ± 8 | 74c | 92c |
| Active | 27 ± 8 | 22 ± 8 | 58d | 116e |
a Xenon binding affinities were determined as described in the Materials and Methods section.
b Cavity volumes were calculated from:
d this work,
e this work with Tyr106 rotated to the out position.
Discussion
For maltose binding protein (MBP) 129Xe NMR was used to discriminate open and closed conformations (ligand free and ligand bound forms), by the different 129Xe shifts induced by the conformation-sensitive xenon-binding site (Rubin et al. 2000). An analogous conformation-sensitive xenon-binding site was engineered into ribose-binding protein (RBP) (Lowery et al. 2004). For both MBP and engineered RBP, a single xenon-binding site was reporting on the two conformational states. CheY is the first example in which 129Xe NMR is sensitive to multiple protein conformation states as well as to peptide binding.
Conformation-dependent xenon binding cavities in CheY
There is a direct correlation between the locations of the xenon-binding cavities predicted by searching the crystal structure of apo CheY with VOIDOO and the clustering of xenon-sensitive residues in apo CheY measured with 1H-15N correlation spectroscopy (Fig. 3 ▶). These cavities are near residues of CheY that are centrally involved in activation: Asp12, Asp57, Thr87, and Tyr106 (Cho et al. 2000). It is reasonable that changes in their positions should give rise to changes in 129Xe chemical shift.
When CheY undergoes activation, Asp57 and Thr87 participate in binding phosphate (or equivalently BeF3−). Consequently, the side chain of Thr87 moves toward the active site, increasing the size of the β4-H4 cavity. This allows the side chain of Tyr106 to rotate from a surface exposed position to a buried one (Fig. 3 ▶) (Cho et al. 2000). In the activated CheY structure the β4-H4 cavity has disappeared, and one would expect that xenon could no longer occupy this site. However, xenon-sensitive residues in this region are observed with 1H-15N correlation spectroscopy, indicating that xenon does still bind in both the H1-β3 and the β4-H4 regions. Previous observations indicate that the functional states of CheY are a dynamic equilibrium of discrete conformational subpopulations (Cho et al. 2000). A change between two functional states arises from an increased stabilization of one set of conformational subpopulations and resulting population shift (Simonovic and Volz 2001). This suggests that in solution xenon binds to the β 4-H4 cavity of the activated state by displacing the Tyr106 side chain to accommodate the xenon atom. The lack of binding seen in the crystals may be because the β4-H4 region is at an interface between the noncrystallographic symmetric dimer of activated CheY, sterically preventing Tyr106 from rotating out.
The chemical shift response of 129Xe to conformational changes in proteins arises from changes in the size and shape of cavities affecting both the bound xenon chemical shift and binding constant (Rubin et al. 2002; Lowery et al. 2004). Table 2 summarizes the cavity volumes calculated from the inactive and activated CheY crystal structures (Simonovic and Volz 2001 and this work, respectively) and measured xenon binding affinities. The xenon binding affinity of the H1-β3 cavity remains unchanged at 27 M−1 when CheY is activated and the cavity volume decreases by 16 Å3, indicating that change in 129Xe chemical shift for this cavity arises only from a change in the bound chemical shift. In contrast, for the β4-H4 cavity CheY activation leads to an increase in cavity volume of 24 Å3 and a decrease in the xenon binding from 35 ± 8 M−1 to 22 ± 8 M−1 (Table 2), which is consistent with an energetic loss for the Tyr106 side chain rotating out to allow xenon to occupy the cavity in the activated state.
The changes in cavity volumes and affinities shown in Table 2, together with the characteristics of the xenon binding cavities observed for MBP and engineered RBP (Rubin et al. 2002; Lowery et al. 2004), explain the dependence of the CheY-induced 129Xe shift on CheY conformation. In the limit that a small fraction of xenon is bound at any site, the concentration normalized 129Xe chemical shift, αobs, is the sum of limiting chemical shift, δi, of 129Xe at each site, weighted by its respective binding constants, Ki (Equation 1) (Rubin et al. 2002).
 |
(1) |
Contributions to the observed 129Xe shift can be separated into nonspecific, nsp, and specific interactions, sp (Equation 2) (Rubin et al. 2001, 2002).
 |
(2) |
For the change in αobs between two states, nonspecific binding sites can be considered to contribute equally to both conformations because of their low binding affinities. Using these assumptions and the binding affinity values in Table 2, Equation 2 can be rewritten using the change in the concentration-normalized 129Xe chemical shift, Δαi,a = 0.8 ppm mM−1, between the inactive and activated conformations of CheY, i and a, respectively (Equation 3).
 |
(3) |
Previous work showed that the limiting xenon chemical shift is inversely proportional to cavity size (Rubin et al. 2002; Lowery et al. 2003). Considering changes in cavity volume only, the limiting shift of the H1-β3 cavity should increase upon activation, whereas that of the β4-H4 cavity should decrease upon activation. Therefore, the activation-induced effects of the H1-β3 cavity and the β4-H4 cavity on 129Xe chemical shift partially offset each other. Because Δαi,a is positive, the effects of the β4-H4 cavity on the observed 129Xe shift must more than compensate for those from the H1-β3 cavity. This correlates with the relative magnitudes of the binding affinities (Equation 3), and volume changes (Table 2).
As mentioned above, both xenon-binding cavities are located in regions of CheY that are involved in a dynamic equilibrium between different conformational subpopulations. The sensitivity of 129Xe chemical shift to the precise state of CheY reflects the sensitivity of these two cavities to shifts in conformational subpopulations that involve the the cavity-containing regions of CheY (Stock et al. 1993; Bellsolell et al. 1994; Djordjevic and Stock 1998).
As shown in Figure 1 ▶, there is also a moderate shift of 129Xe upon peptide binding to CheY. Analogous to magnesium binding and activation, peptide binding shifts the conformational subpopulations of CheY in a manner that perturbs a xenon-binding cavity. CheY activation changes the H4-β5-H5 surface by rotating the Tyr106 side chain from “out” to “in,” enhancing the affinity of CheY 20 fold for an N-terminal segment of its natural downstream target, the FliM protein (Bren and Eisenbach 1998; Lee et al. 2001b). With the FliM peptide bound, rearrangements that enable xenon binding to the β4-H4 cavity must be suppressed. The resulting decreased xenon occupancy of the β4-H4 cavity correlates with the further decrease in 129Xe shift for the peptide complex relative to activated CheY alone.
Conclusions
The shift of 129Xe in contact with CheY changes in response to transitions among four distinct CheY states: apo, magnesium-bound, activated, and FliM peptide-bound. The sensitivity of 129Xe to these small conformational differences arises primarily from the subtle changes in the H1-β3 and β4-H4 cavities in the different CheY functional states. The response of 129Xe to FliM peptide binding indicates that 129Xe NMR can be used for sensing protein–protein interactions through a xenon-binding cavity near or coupled to the site of binding. The observations presented here, combined with the demonstration that reporter sites can be engineered into proteins (Lowery et al. 2004), indicate that 129Xe NMR can be used to report almost any kind of protein conformational change or binding event.
Materials and methods
Both natural abundance and 15N-labeled E. coli CheY proteins were expressed and purified as described (Cho et al. 2000). Laser-polarized 129Xe NMR spectroscopy for inactive, magnesium-bound, and activated CheY used 25 mM sodium phosphate buffer (pH 6.7), with the approach of sequential dilutions, as described (Lowery et al. 2004). Magnesium-bound CheY samples contained 5 mM MgCl2. The magnesium dissociation constant was measured to be ~0.3 mM, which is close to previous estimates of ~0.5 mM (Lukat et al. 1990), by following the change in 1H-15N chemical shift for Asp57 versus total magnesium concentration and fitting the data to a single-site binding model. Therefore, ~90% of the protein was in the magnesium-bound state in the presence of 5 mM MgCl2 (Moy et al. 1994). Activated CheY samples were prepared by adding MgCl2, NaF, and BeCl2 to final concentrations of 20 mM, 100 mM, and 16 mM, as previously described (Cho et al. 2000). Laser-polarized 129Xe NMR spectroscopy for FliM-peptide-bound CheY was conducted as previously described for other proteins (Rubin et al. 2002) in 25 mM buffer (pH 6.7), 1.7 mM 16N FliM peptide (Lee et al. 2001b). VOIDOO calculations to identify cavities used a primary grid spacing of 0.5 Å and a probe radius of 1.4 Å (Jones et al. 1991; Rubin et al. 2002). VOIDOO calculations for apo CheY in Table 2 were done using coordinates from a previously reported crystal structure (Simonovic and Volz 2001). This structure of apo CheY does not contain bound xenon, but the similarity of the measured volumes for both cavities in activated CheY without xenon (Lee et al. 2001a) (62 Å3 for H1-β3 and 113 Å3 for H4-β4 with Tyr106 rotated out) and with xenon (this work) (Table 2) indicate that xenon binding does not significantly alter these cavity volumes.
1H-15N HSQC spectroscopy was conducted with 1.0 mM to 1.5 mM samples of 15N-labeled CheY in 25 mM sodium phosphate (pH 6.7). The 1H-15N HSQC assignments for BeF3− activated CheY conformations have already been reported (Cho et al. 2000). The peak assignments for the inactive, or apo, conformer of CheY were obtained by measuring the 1H-15N HSQC for 1.0 mM apo CheY, then following peaks as magnesium chloride was titrated from 0 mM to 10.0 mM. All resonances were in fast exchange between the magnesium-bound and magnesium-free forms for intermediate concentrations of magnesium. Resonances were tracked from the previously assigned magnesium-bound CheY spectrum (Moy et al. 1994). For both CheY conformers, xenon-induced shifts were assigned and reported for only those resonances that were clearly resolved (Figs. 2 ▶, 3 ▶). 1H-15N HSQC xenon titrations were conducted as described (Rubin et al. 2002).
Crystals of the BeF3−-activated CheY were prepared as previously described (Lee et al. 2001a). Crystals were pressurized with xenon at 100 psi for 1 min using a standard xenon chamber (Hampton Research) prior to freezing in liquid nitrogen (Rubin et al. 2002). Higher xenon pressures (≥150 psi) or longer exposure times (≥2 min) cracked the crystals. Diffraction data were collected at the Advanced Light Source on beamline 8.3.1 using an ADSC detector and a wavelength of 1.0 Å. The crystals were isomorphous with previously obtained crystals of activated CheY diffracting in spacegroup P212121 with cell dimensions a = 53.73 Å, b = 53.82 Å, and c = 161.17 Å (Lee et al. 2001a). Crystallographic data were processed and scaled with MOSFLM (Leslie 1992; Bolotovsky et al. 1998) and the CCP4 suite (Vagin and Teplyakov 2000) using the ELVES interface (Holton and Alber 2004). Initial phases were obtained by molecular replacement with the CCP4 program MOLREP (Vagin and Teplyakov 2000) and the activated CheY structure (Lee et al. 2001a) as the starting model. A xenon atom in both molecules of the asymmetric unit was clearly visible (signal greater than 10σ) in an Fo–Fc omit electron density map. The structure was refined with CNS (Brunger et al. 1998) and the O software package (Jones et al. 1991). Occupancy of the xenon atoms was refined with five different initial B-factors between 40–60 Å2. The best fit occupancy always fell between 0.22–0.34.
Acknowledgments
We thank the staff at the Advanced Light Source (Berkeley, CA), Beamline 8.3.1 for help with crystallographic studies. S.M.R. acknowledges the National Science Foundation and E.J.R. acknowledges Lucent Technologies/Bell Laboratories for predoctoral fellowships. This work was supported by the Director of the U.S. Department of Energy under contract no. DE-AC03-76F00098, through the Office of Naval Research (MDI-II), and through the Laboratory Directed Research and Development program of Lawrence Berkeley National Laboratory.
Article published online ahead of print. Article and publication date are at http://www.proteinscience.org/cgi/doi/10.1110/ps.041231005.
References
- Bellsolell, L., Prieto, J., Serrano, L., and Coll, M. 1994. Mg2+ binding to the bacterial chemotaxis protein CheY results in large conformational changes involving its functional surface. J. Mol. Biol. 238 489–495. [DOI] [PubMed] [Google Scholar]
- Bolotovsky, R., Steller, I., and Rossman, M.G. 1998. The use of partial reflections for scaling and averaging X-ray area-detector data. J. Appl. Crystallogr. 31 708–717. [Google Scholar]
- Bowers, C.R., Storhaug, V., Webster, C.E., Bharatam, J., Cottone III, A., Gianna, R., Betsey, K., and Gaffney, B.J. 1999. Exploring surfaces and cavities in lipoxygenase and other proteins by hyperpolarized xenon-129 NMR. J. Am. Chem. Soc. 121 9370–9377. [DOI] [PMC free article] [PubMed] [Google Scholar]
- Bren, A. and Eisenbach, M. 1998. The N terminus of the flagellar switch protein, FliM, is the binding domain for the chemotactic response regulator, CheY. J. Mol. Biol. 278 507–514. [DOI] [PubMed] [Google Scholar]
- Brünger, A.T., Adams, P.D., Clore, G.M., DeLano, W.L., Gros, P., Grosse-Kunstleve, R.W., Jiang, J.S., Kuszewski, J., Nilges, M., Pannu, N.S., et al. 1998. Crystallography & NMR system: A new software suite for macro-molecular structure determination. Acta Crystallogr. D Biol. Crystallogr. 54 905–921. [DOI] [PubMed] [Google Scholar]
- Cho, H.S., Lee, S.Y., Yan, D., Pan, X., Parkinson, J.S., Kustu, S., Wemmer, D.E., and Pelton, J.G. 2000. NMR structure of activated CheY. J. Mol. Biol. 297 543–551. [DOI] [PubMed] [Google Scholar]
- Djordjevic, S. and Stock, A.M. 1998. Structural analysis of bacterial chemotaxis proteins: Components of a dynamic signaling system. J. Struct. Biol. 124 189–200. [DOI] [PubMed] [Google Scholar]
- Falke, J.F., Bass, R.B., Butler, S.L., Chervitz, S.A., and Danielson, M.A. 1997. The two-component signaling pathway of bacterial chemotaxis: A molecular view of signal transduction by receptors, kinases, and adaptation enzymes. Annu. Rev. Cell Dev. Biol. 13 457–512. [DOI] [PMC free article] [PubMed] [Google Scholar]
- Goodson, B.M. 2001. Nuclear magnetic resonance of laser polarized noble gases in molecules, materials, and organisms. J. Magn. Reson. 155 157–216. [DOI] [PubMed] [Google Scholar]
- Gröger, C., Möglich, A., Pons, M., Koch, B., Hengstenberg, W., Kalbitzer, H.R., and Brunner, E. 2003. NMR-spectroscopic mapping of an engineered cavity in the I14A mutant of HPr from Staphylococcus carnosus using xenon. J. Am. Chem. Soc. 125 8726–8727. [DOI] [PubMed] [Google Scholar]
- Holton, J. and Alber, T. 2004. Automated protein crystal structure determination using ELVES. Proc. Natl. Acad. Sci. 101 1537–1542. [DOI] [PMC free article] [PubMed] [Google Scholar]
- Jones, T.A., Zou, J.-Y., Cowan, S.W., and Kjeldgaard, M. 1991. Improved methods for building protein models in electron density maps and the location of errors in these models. Acta Crystallogr. D Found. Crystallogr. 47 110–119. [DOI] [PubMed] [Google Scholar]
- Lee, S.Y., Cho, H.S., Pelton, J.G., Yan, D., Berry, E.A., and Wemmer, D.E. 2001a. Crystal structure of activated CheY. J. Biol. Chem. 276 16425–16431. [DOI] [PubMed] [Google Scholar]
- Lee, S.Y., Cho, H.S., Pelton, J.G., Yan, D., Henderson, R.K., King, D.S., Huang, L., Kustu, S., Berry, E.A., and Wemmer, D.E. 2001b. Crystal structure of an activated response regulator bound to its target. Nat. Struct. Biol. 8 52–56. [DOI] [PubMed] [Google Scholar]
- Leslie, A.G.W. 1992. Recent changes to the MOSFLM package for processing film and image plate data. In Joint CCP4 and ESF-EACMB newsletter on protein crystallography, No. 26. Daresbury Laboratory, Warrington, UK.
- Lowery, T.J., Rubin, S.M., Ruiz, E.J., Spence, M.M., Winssinger, N., Schultz, P.G., Pines, A., and Wemmer, D.E. 2003. Applications of laser-polarized 129Xe to biomolecular assays. Magn. Reson. Imaging 21 1235–1239. [DOI] [PubMed] [Google Scholar]
- Lowery, T.J., Rubin, S.M., Ruiz, E.J., Pines, A., and Wemmer, D.E. 2004. Design of a conformation-sensitive xenon-binding cavity in the ribose binding protein. Angew. Chem. Int. Ed. 43 6320–6322. [DOI] [PubMed] [Google Scholar]
- Lukat, G.S., Stock, A.M., and Stock, J.B. 1990. Divalent metal ion binding to the CheY protein and its significance to phosphotransfer in bacterial chemotaxis. Biochemistry 29 5436–5442. [DOI] [PubMed] [Google Scholar]
- Moy, F.J., Lowry, D.F., Matsumura, P., Dahlquist, F.W., Krywko, J.E., and Domaille, P.J. 1994. Assignments, secondary structure, global fold, and dynamics of chemotaxis Y protein using three- and four-dimensional heteronuclear (13C, 15N) NMR spectroscopy. Biochemistry 33 10731–10742. [DOI] [PubMed] [Google Scholar]
- Rubin, S.M., Spence, M.M., Dimitrov, I.E., Ruiz, E.J., Pines, A., and Wemmer, D.E. 2000. Detection of a conformational change in maltose binding protein by 129Xe NMR spectroscopy. J. Am. Chem. Soc. 123 8616–8617. [DOI] [PubMed] [Google Scholar]
- Rubin, S.M., Spence, M.M., Pines, A., and Wemmer, D.E. 2001. Characterization of the Effects of nonspecific xenon-protein on 129Xe chemical shifts in aqueous solution: Further development of xenon as a biomolecular probe. J. Magn. Reson. 152 79–86. [DOI] [PubMed] [Google Scholar]
- Rubin, S.M., Lee, S.Y., Ruiz, E.J., Pines, A., and Wemmer, D.E. 2002. Detection and characterization of xenon-binding sites in proteins by 129Xe NMR spectroscopy. J. Mol. Biol. 322 425–440. [DOI] [PubMed] [Google Scholar]
- Simonovic, M. and Volz, K. 2001. A distinct meta-active conformation in the 1.1-Å resolution structure of wild-type apoCheY. J. Biol. Chem. 276 28637–28640. [DOI] [PubMed] [Google Scholar]
- Spence, M.M., Rubin, S.M., Dimitrov, I.E., Ruiz, E.J., Wemmer, D.E., Pines, A.P., Yao, S.Q., Tian, F., and Schultz, P.G. 2001. Functionalized xenon as a biosensor. Proc. Natl. Acad. Sci. 98 10654–10657. [DOI] [PMC free article] [PubMed] [Google Scholar]
- Stock, A.M., Martinez-Hackert, E., Rasmussen, B.F., West, A.H., Stock, J.B., Ringe, D., and Petsko, G.A. 1993. Structure of the Mg2+ bound form of CheY and mechanism of phosphoryl transfer in bacterial chemotaxis. Biochemistry 32 13375–13380. [DOI] [PubMed] [Google Scholar]
- Tilton, R.F. and Kuntz, I.D. 1982. Nuclear magnetic resonance studies of xenon 129 with myoglobin and hemoglobin. Biochemistry 21 6850–6857. [DOI] [PubMed] [Google Scholar]
- Vagin, A. and Teplyakov, A. 2000. An approach to multi-copy search in molecular replacement. Acta Crystallogr. D Biol. Crystallogr. 56 1622–1624. [DOI] [PubMed] [Google Scholar]