Abstract
Changes in protein stability can be achieved by making substitutions that increase or decrease the available conformations of the unfolded protein without altering the conformational freedom of the folded protein. Matthews and coworkers (1987) proposed that proline to alanine (P → A) substitution would achieve this type of entropic destabilization. By comparing the Ramachandran area associated with alanine and proline residues, Matthews et al. estimated the unfolding entropy change resulting from P → A substitution to be 4.8 cal mol−1 K−1. Although such an entropy difference would produce a substantial free energy change, accurately resolving such free energy changes into entropic and enthalpic components has been difficult. Here, we attempt to quantify the unfolding entropy change produced by P → A substitution by amplifying the effect through multiple substitutions, and by decreasing the uncertainty in determining the unfolding entropy. Variants of a repeat protein, the Drosophila Notch ankyrin domain, were constructed with a varying number of P → A substitutions at structurally conserved positions. Unfolding entropy values of the variants were determined from free energy measurements taken over a common temperature range using chemical denaturation. Our findings confirm the prediction that increasing the number of proline residues present in similar local environments increases the unfolding entropy. The average value of this increase in unfolding entropy is 7.7 ± 4.2 cal mol−1 K−1, which is within error of the value estimated by Matthews et al. (1987).
Keywords: unfolding entropy, proline substitution, Notch ankyrin domain, chemical denaturation
The free energy difference between the native and denatured ensembles of a protein can be deconvoluted into enthalpic and entropic contributions. To understand the energetic basis for protein folding, the physical basis for these enthalpic and entropic contributions needs to be characterized. The entropy difference between the native and denatured states results from a wide variety of phenomena, including side-chain and backbone restriction, and solvation of hydrophobic side chains and polyproline II conformations in the unfolded state (Matthews et al. 1987; Pickett and Sternberg 1993; Ferreon and Hilser 2003). One approach to separate and compare the contributions of these phenomena to the unfolding entropy is to make precise chemical substitutions designed to target only one of the mechanisms above. For example, P → A substitution is expected to increase the unfolding entropy by increasing the number of backbone conformations available in the denatured state without significantly changing the conformational freedom of the native state.
Matthews et al. (1987) estimated that the number of backbone states available to a residue in the unfolded state is proportional to the area occupied by that residue on a Ramachandran plot. By assuming that substitution does not affect the conformational freedom of the native state, the change in unfolding entropy from a P → A substitution, ΔΔSP → A, is estimated as
 |
where Aala and Apro represent the Ramachandran area for alanine and proline in an unstructured dipeptide, and R is the gas constant. P → A substitution is expected to increase the unfolding entropy because Aala is larger than Apro. By estimating Aala and Apro, Matthews et al. (1987) calculated the entropic destabilization from a P → A substitution to be 4.8 cal mol−1 K−1. Determining an entropy change of this magnitude is difficult because the entropy change is smaller than the typical experimental uncertainty on measured unfolding entropy values.
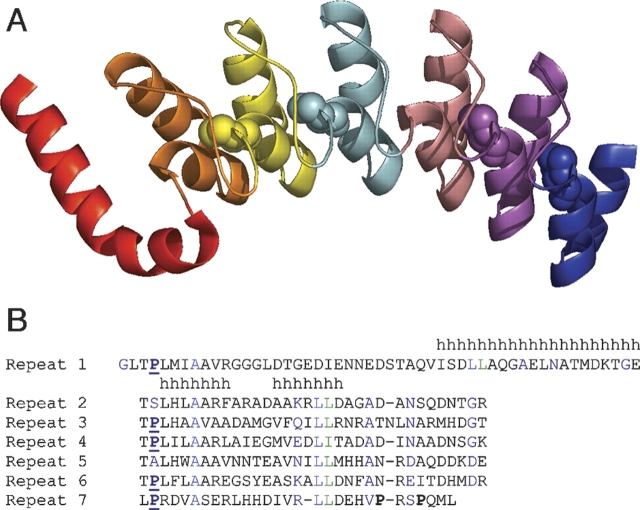
Here we describe an improved system for measuring small entropy changes resulting from P → A substitution. We utilize the unique structural properties of a repeat protein, the ankyrin domain of the Drosophila Notch receptor (Nank1–7*) (Fig. 1A ▶), to obtain a better estimate of the entropic destabilization resulting from P → A substitution. Unlike globular proteins, repeat proteins such as Nank1–7* are comprised of tandemly repeated structural units. Nank1–7* has seven such units, with six of these units (repeats 2 through 7) adopting the typical ankyrin repeat fold (Zweifel et al. 2003). As a result of the repetitive structure of repeats 2 through 7, local environments surrounding consensus positions are structurally similar. Nank1–7* contains seven prolines, five of which are part of the ankyrin consensus sequence (Bork 1993). Four of the five consensus prolines are positioned at the N termini of the first helix in repeats 3, 4, 6, and 7. The other consensus proline residue is in the first repeat, and is disordered in the crystal structure (Zweifel et al. 2003). The two nonconsensus proline residues are in the C-terminal region of the seventh repeat (Fig. 1B ▶).
Figure 1.
(A) Ribbon diagram of the Drosophila Notch ankyrin domain (Zweifel et al. 2003) with proline residues at the consensus positions of repeats 3, 4, 6, and 7 in CPK representation. Repeats 1–7 are colored individually from red (1) to blue (7). This figure was made using the program PyMOL (www.pymol.org). (B) ClustalW (Thompson et al. 1994) alignment of Notch ankyrin repeat sequences. Proline residues are highlighted in bold type; prolines at consensus positions are underlined. Dashes represent gaps in the alignment. Helical regions are denoted by h’s.
Unfolding entropy changes are often calculated from thermal denaturation experiments. Although enthalpy and entropy values are well determined at temperatures in the transition region of the unfolding curve, comparing these quantities at a reference temperature outside the transition region involves extrapolation. This nonlinear extrapolation depends on ΔCp, a parameter that can be difficult to determine with high precision. To avoid this extrapolation, we measure the free energy of unfolding by urea denaturation over a common temperature range (287.15 to 295.15 K), and report the unfolding entropy change in the middle of this range (291.15 K). Although this approach involves extrapolation of free energies as a function of urea, it avoids the nonlinear extrapolations required for thermal denaturation.
Here we use this solvent denaturant approach to measure the unfolding energy and entropy of a collection of single and multiple P → A variants of the Notch ankyrin domain. By combining multiple structurally similar P → A substitutions, modest entropy changes are expected to accumulate in proportion to the number of substitutions, providing an aggregate entropy change that exceeds experimental uncertainty.
Results
Determining a sensitive temperature range to measure unfolding entropies
To determine a temperature range for free energy measurements that would minimize the uncertainty in fitted unfolding entropy (σΔS), we simulated σΔS from the temperature dependence of synthetic free energy values with 0.2 kcal mol−1 Gaussian-distributed error, for different temperature intervals (described in Materials and Methods). We find that increasing the temperature interval (ΔT) decreases the uncertainty in determining the unfolding entropy (Supplemental Fig. 1 ▶). At small temperature intervals, σΔS increases sharply because the variation in free energy that defines the unfolding entropy becomes smaller than the errors in the individual free energy measurements. Although there is no high temperature interval at which σΔS begins to increase (i.e., there is no minimum in the σΔS versus ΔT profile), the requirement that all variants unfold with complete baseline-resolved transitions imposes a practical upper limit on the temperature range. For the P → A variants studied here, we chose 295.15 K as an upper limit for measuring free energies of unfolding. At this temperature, the least stable variant (PA13467) has an unfolding free energy of 2.7 ± 0.1 kcal mol−1, which yields an adequately resolved native baseline. Above this temperature, the native baseline of this variant would not be adequately resolved, and would result in large uncertainties in unfolding free energy. We chose to measure free energies at five temperatures, each separated by a 2 K interval, which defines the range 287.15 to 295.15 K. This range is sufficiently large to give low uncertainties in unfolding entropy (Supplemental Fig. S1).
Unfolding free energies of Nank1–7* variants
To determine the relationship between the number of proline residues in the Notch ankyrin domain and the unfolding entropy (ΔS291.15), we made constructs with between zero and seven consensus proline residues. Each substitution site is at the same position within the ankyrin consensus sequence. Proline is the most favored residue at this position in ankyrin repeats, followed by alanine. The PA13467 variant contains no consensus proline residues, whereas PA1346 and PA134 have one and two consensus proline residues, respectively. Five variants contain four consensus proline residues (PA1, PA3, PA4, PA6, and PA7), Nank1–7* has five consensus proline residues, SP2 has six consensus proline residues, and SP2AP5 has seven consensus proline residues, one in each ankyrin repeat sequence.
The parent construct, Nank1–7*, exhibits a two-state equilibrium unfolding transition (Zweifel and Barrick 2001), and all the variants exhibit similar cooperative unfolding transitions. Urea-induced unfolding transitions were measured at temperatures between 287.15 and 295.15 K (Table 1). The urea midpoints from the unfolding transitions decrease with increasing temperature (Fig. 2 ▶), indicating that unfolding free energies decrease with increasing temperature, as expected for positive unfolding entropy values (−dΔG°u/dT). All variants show baseline-resolved unfolding transitions. With the exception of PA1, all single P → A substitutions were destabilizing, with free energy changes from 0.5 to 1.76 kcal mol−1 (see Table 1). As the first ankyrin repeat is largely unstructured, the modest free energy change resulting from substitution in the first repeat is not unexpected (Table 1, PA1).
Table 1.
Free energy measurements at different temperatures for proline variants of the Notch ankyrin domain
| ΔG°u (kcal mol−1) | |||||
| Variant | 287.15 K | 289.15 K | 291.15 K | 293.15 K | 295.15 K |
| PA1 | 8.17 ± 0.09 | 8.11 ± 0.09 | 7.82 ± 0.06 | 7.82 ± 0.06 | 7.34 ± 0.03 |
| PA3 | 7.76 ± 0.06 | 7.62 ± 0.03 | 7.32 ± 0.10 | 6.92 ± 0.03 | 6.60 ± 0.02 |
| PA4 | 7.75 ± 0.06 | 7.49 ± 0.09 | 7.25 ± 0.06 | 6.90 ± 0.04 | 6.60 ± 0.09 |
| PA6 | 7.04 ± 0.03 | 6.80 ± 0.05 | 6.56 ± 0.01 | 6.34 ± 0.03 | 5.96 ± 0.03 |
| PA7 | 6.52 ± 0.05 | 6.30 ± 0.04 | 6.06 ± 0.05 | 5.83 ± 0.04 | 5.43 ± 0.02 |
| SP2 | 4.78 ± 0.04 | 4.66 ± 0.01 | 4.42 ± 0.03 | 4.08 ± 0.03 | 3.82 ± 0.02 |
| SP2AP5 | 8.38 ± 0.03 | 8.18 ± 0.04 | 7.91 ± 0.02 | 7.62 ± 0.03 | 7.25 ± 0.02 |
| PA134 | 6.95 ± 0.06 | 6.76 ± 0.03 | 6.46 ± 0.07 | 6.12 ± 0.03 | 5.73 ± 0.06 |
| PA1346 | 6.22 ± 0.01 | 5.94 ± 0.02 | 5.60 ± 0.03 | 5.18 ± 0.03 | 4.72 ± 0.03 |
| PA13467 | 4.15 ± 0.09 | 3.93 ± 0.09 | 3.61 ± 0.05 | 3.15 ± 0.10 | 2.74 ± 0.10 |
| Nankl-7* | 8.24 ± 0.05 | 8.09 ± 0.07 | 7.82 ± 0.05 | 7.52 ± 0.04 | 7.16 ± 0.02 |
The uncertainties represent standard error on the mean. Conditions: 150 mM NaCl, 25 mM Tris-HCl at pH 8.0.
Figure 2.
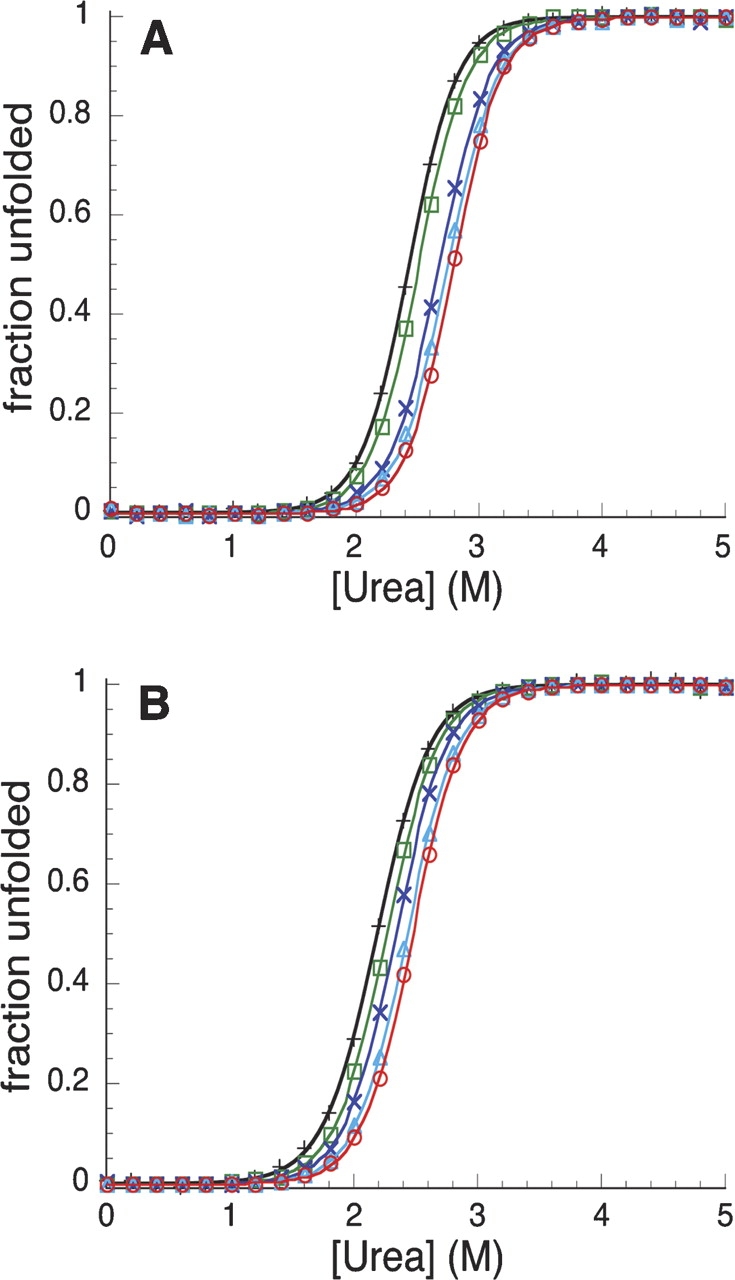
Urea-induced unfolding transitions of variants of the Notch ankyrin domain at different temperatures. Unfolding transitions of Nank1–7* (A) and PA6 (B) were monitored at 287.15 K (red, ○), 289.15 K (light blue, ▵), 291.15 K (dark blue, ×), 293.15 K (green, □), and 295.15 K (black, +). The solid lines represent the best fit of Equation 1 to the data. Conditions: 2.0–5.0 μM protein, 150 mM NaCl, 25 mM Tris-HCl at pH 8.0.
Unfolding entropies of Nank1–7* variants
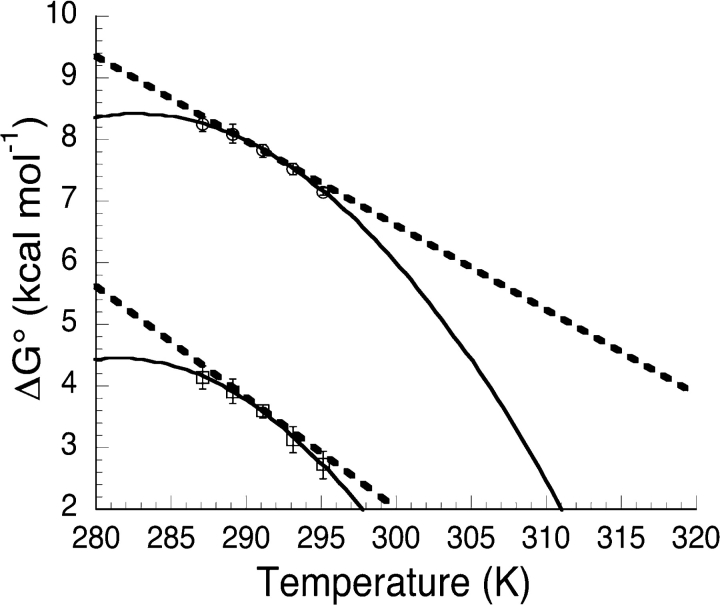
Unfolding entropies of wild-type Nank1–7* and the P → A variants were determined from the unfolding free energy temperature dependence (Fig. 3 ▶), as ΔS is equal to the slope of the ΔG-temperature profile. At least four independent urea-induced unfolding transitions were measured for each variant at each temperature, through the range determined above (287.15 to 295.15 K). Thermodynamic parameters (ΔS291.15, ΔH291.15, and ΔCp) were fitted from the free energy-temperature profiles as described in Materials and Methods (Fig. 3 ▶, solid curves). ΔH and ΔS were evaluated at 291.15 K as it is the center of the selected temperature range, which should optimize the determination of the slope (and thus ΔS). We note that over this narrow temperature range, fitted ΔCp values are not well determined. Although high uncertainty in ΔCp would adversely affect free energy and entropy estimates at other temperatures, it should have no affect on the slope within the experimental range.
Figure 3.
Free energy-temperature profiles for Nank1–7* (□) and PA13467 (○). The solid lines represent the best fit of Equation 2 to the data. Error bars represent the standard error on the mean. The dashed lines show the tangent to the free energy-temperature profile at 291.15 K.
The connection between the measured free energies and the fitted entropies of unfolding is illustrated in Figure 3 ▶, where the larger fitted ΔS291.15 value for PA13467 compared to Nank1–7*, is clearly reflected in a greater slope, in the free energy–temperature profile (dashed lines).
The uncertainty in ΔS291.15 for each variant (σΔS) was calculated by randomly selecting single experimental ΔG°u values from the at least four independent measurements at each temperature (see Materials and Methods). Figure 4A ▶ shows the distribution of unfolding entropy values arising from exhaustively sampling permutations of ΔG°u values for Nank1–7*, taking one value at each temperature. This procedure produced an estimate of the uncertainty in ΔS291.15 of 6.2 cal mol−1 K−1 for Nank1–7*, (using the root-mean-square deviation of this distribution as the estimate). Uncertainty estimates for other variants ranged from approximately this value up to 13 cal mol−1 K−1, with a mean value of 8.3 cal mol−1 K−1.
Figure 4.
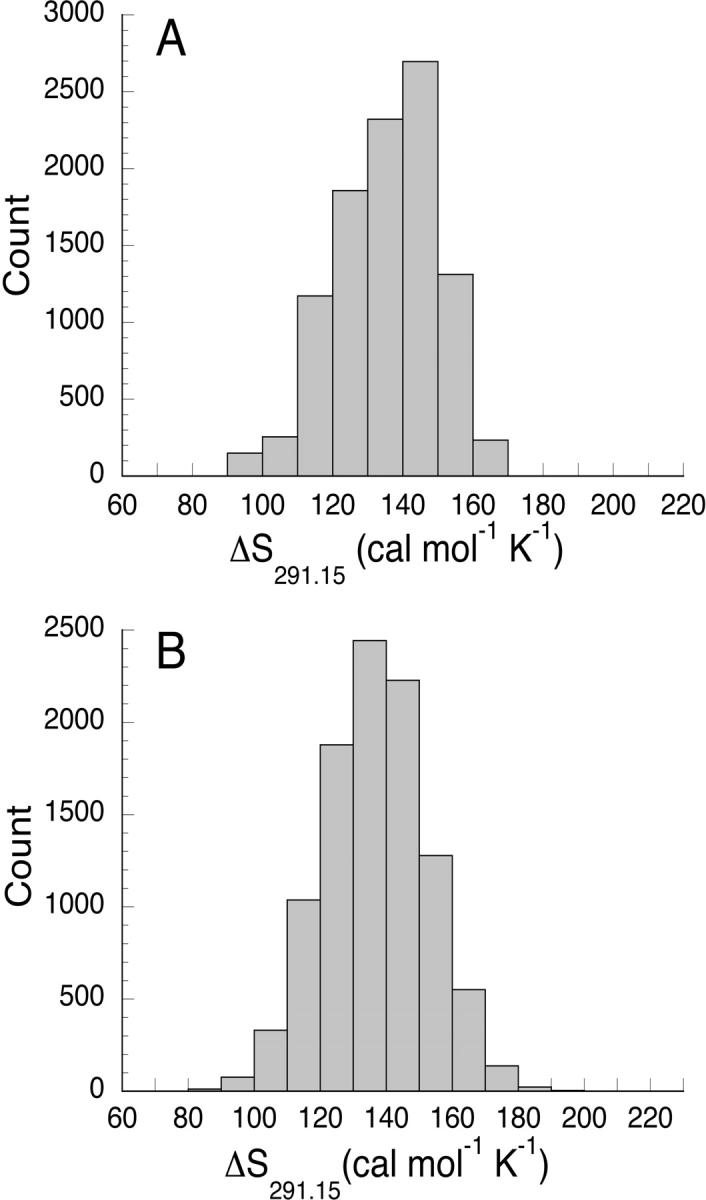
Distribution of single-measurement unfolding entropy values evaluated at 291.15 K. The unfolding entropy distributions were calculated either from (A) random sampling of measured free energy values of Nank1–7*, and from (B) synthetic free energy values matching those determined for Nank1–7* subject to random error from a Gaussian distribution with a standard deviation of 0.1 kcal mol−1.
One limitation of the method described above for determining the uncertainty in ΔS291.15 values is that it uses a limited number (4–5) of measured ΔG°u values at each temperature. To investigate the convergence of σΔS in the limit of a large number of ΔG°u values, distributions of entropy estimates were calculated by adding Gaussian-distributed error to synthetic free energy values. The Gaussian-distributed error had a root-mean-square deviation of 0.1 kcal mol−1, which is an estimate for the standard error on single ΔG°u measurements for Nank1–7*. The resulting distribution (Fig. 4B ▶) has a similar mean and width as the distribution derived from the experimentally measured ΔG°u values, which supports the use of limited ΔG°u values to estimate the uncertainty in ΔS291.15.
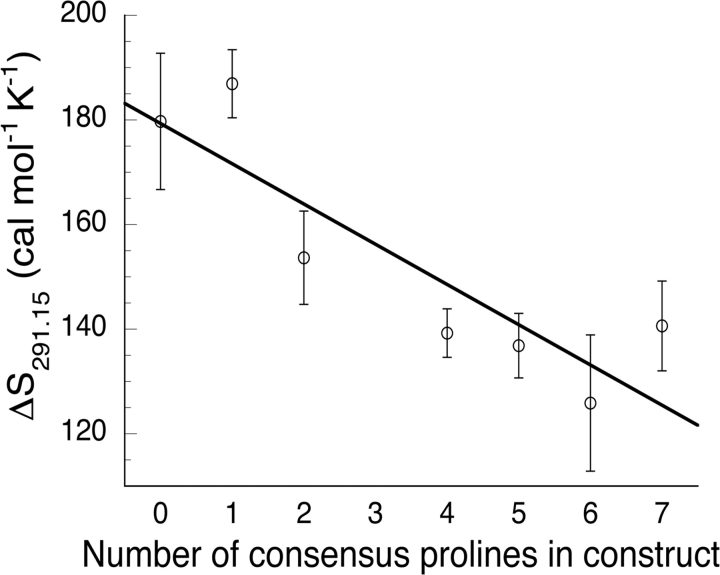
Although the uncertainties in unfolding entropy determination are comparable to the magnitude of the unfolding entropy differences between constructs, there is a trend in the unfolding entropy value when plotted as a function of the number of prolines in the construct (Fig. 5 ▶), with constructs that have fewer consensus prolines showing higher unfolding entropy. Using error-weighted linear regression, we calculated the slope of the line relating number of consensus prolines to the unfolding entropy in Figure 5 ▶ to be 7.7 ± 4.2 cal mol−1 K−1 proline−1. This value can be interpreted as the average entropy increase resulting from a single P → A substitution.
Figure 5.
Unfolding entropy (ΔS291.15) versus the number of proline residues in consensus positions of the Notch ankyrin domain. The entropy values for four consensus prolines is the average from multiple variants (see Table 2). Uncertainties are calculated as described in Materials and Methods. The solid line results from a weighted least-squares fit to the data, which has a slope of 7.7 cal mol−1 K−1 per proline.
Discussion
We combined the structural redundancy of the Notch ankyrin domain with a direct method for estimating unfolding entropy over a common temperature to measure the change in unfolding entropy that results from P → A substitution. We consider the approach of measuring ΔG°u values over a common temperature range to lead to precise comparisons of ΔS for different variants, compared to direct thermal denaturation. Nonetheless, with a mean uncertainty of 8.3 cal mol−1 K−1, our approach would still be unable to detect the small entropy changes predicted by Matthews et al. (1987) (4.8 calmol−1K−1) to result from a single P → A substitution.
By making multiple, structurally similar P → A substitutions at analogous sites in a repeat protein, we are able to overcome this limitation, since these small entropy changes are expected to accumulate linearly with the number of substitutions, as long as the substitution sites are thermodynamically independent. The data in Figure 5 ▶ are consistent with this interpretation. Although individual unfolding entropy values in Figure 5 ▶ show significant deviation from the linear fit, a clear relation emerges between the number of prolines and the unfolding entropy. We estimate that P → A substitution results in an entropic destabilization of 7.7 ± 4.2 cal mol−1 K−1, which is larger than, but within error of, the 4.8 cal mol−1 K−1 value predicted by Matthews et al. (1987). The sign and magnitude of this entropy change is consistent with the expected decrease in backbone restriction, although effects from local structural changes in the denatured state (such as solvation) cannot be ruled out. Although the entropy changes we measured are small, it is the sum of small enthalpy and entropy contributions such as these that account for all of protein stability.
Materials and methods
Mutagenesis, protein expression, and purification
Thermodynamic measurements were made on variants of a seven ankyrin repeat polypeptide derived from the Drosophila Notch receptor. In the parent construct, Nank1–7*, the single cysteine residue at position 2100 (Wharton et al. 1985) was replaced with serine to enhance long-term stability and promote reversible unimolecular folding. In addition, the polypeptide contains an N-terminal His6 tag to facilitate purification.
Site-directed mutagenesis was performed using the Stratagene QuikChange Mutagenesis Kit. We identify individual variants by giving the type of substitution (PA and AP for P → A and A → P, respectively) and the repeat number of the substitution. Thus, PA4 designates a construct that contains a P → A substitution at the consensus position of repeat 4, and PA67 designates a construct that contains a P → A substitution at the consensus position in repeats 6 and 7.
All proteins were expressed in the Escherichia coli BL21(DE3) cell line and purified as described previously (Zweifel and Barrick 2001).
CD-monitored urea denaturation
Ultrapure urea was obtained from ICN, and was dissolved in water and deionized using mixed bed resin from Bio-Rad immediately prior to use. Urea concentrations were measured refractometrically (Pace 1986).
Urea-induced unfolding transitions were measured on an Aviv 62A DS spectropolarimeter (Aviv Associates) equipped with a thermoelectric cell holder. Circular dichroism (CD) was monitored at 222 nm. Measurements were made in 150 mM NaCl, 25 mM Tris-HCl at pH 8.0, with protein concentrations of 2.0–5.0 μM. Automated urea titrations were performed using a computer-controlled Hamilton Microlab 500 titrator as described previously (Bradley and Barrick 2002).
Free energies of unfolding were determined from ureainduced unfolding transitions using the linear extrapolation method (Greene and Pace 1974; Pace 1986; Santoro and Bolen 1988). Unfolding transitions were fitted using the nonlinear least-squares algorithm of the Kaleidagraph program (Synergy Software) with the following equation:
 |
(1) |
where Yobs is the observed signal, and ΔG°u is the free energy of unfolding in the absence of urea. Free energies of unfolding were measured every two degrees from 287.15 K to 295.15 K. At each temperature, a minimum of four independent urea-induced unfolding transitions were measured.
Free energy-temperature profiles were constructed for each variant and were fitted by the following relationship:
 |
(2) |
using nonlinear least squares, where the fitted parameters are ΔS291.15, ΔH291.15, and ΔCp. The change in heat capacity upon unfolding, ΔCp, was assumed to be independent of temperature, which is likely to be a reasonable approximation over the narrow temperature range used in this study. Note that the unfolding entropy can also be estimated from the slope of the free energy-temperature profile at 291.15 K since dΔG°u/dT=−ΔSu.
Calculating the uncertainty in unfolding entropy determination
The unfolding entropy evaluated at 291.15 K (ΔS291.15) was determined by fitting measured ΔG°u values over a range of temperatures using Equation 2. Although we can easily obtain estimates for the uncertainty in ΔG°u (σΔG°) by repeating measurements, propagating these uncertainties into fitted estimates of ΔS291.15 is more difficult, as independent determinations of ΔS291.15 require a minimum of five separate free energy measurements. Below, we outline a strategy to estimate the uncertainty in unfolding entropy determination (σΔS) using experimentally measured ΔG°u values. We also present a simple simulation to show the relationship between σΔS and σΔG° using our fitting method, assuming free energy values to be subject to Gaussian-distributed error. This simulation provides us with an independent estimate of σΔS, in the limit of a large (and experimentally impractical) sampling of ΔG°u values.
Since ΔS291.15 is calculated from ΔG°u values measured over a range of temperatures, σΔS is related to the error in the measured ΔG°u values at each temperature. To estimate σΔS from our experimental data, we examined the degree to which fitted ΔS291.15 estimates depend on the arbitrary selection of experimentally determined ΔG°u values at each temperature. Specifically, we randomly picked one of the four (or more) measured ΔG°u values at each of the five temperatures in our range, and fitted ΔS291.15 from these ΔG°u values using Equation 2. This process was repeated using other randomly selected sets of five ΔG°u values (with one ΔG°u measurement at each of the five temperatures) until all combinations had been exhaustively sampled. The root-mean-square deviation of the resulting distribution of ΔS291.15 values was taken as the uncertainty in a ΔS291.15 estimate that would result from one ΔG°u measurement per temperature. As each variant has at least four independent ΔG°u measurements at each temperature, the standard deviation on a ΔS291.15 estimate determined using all of the free energy measurements should be lower by the square root of the number of measurements made at each temperature. This statistical analysis was done with the R statistical software package (www.r-project.org/).
To further elucidate the relationship between σΔS and σΔG°, we examined the effect of Gaussian-distributed error on synthetic free energy values. The fitted thermodynamic parameters (ΔH291.15, ΔS291.15, and ΔCp) for Nank1–7* were used to create synthetic free energy values at 287.15, 289.15, 291.15, 293.15, and 295.15Kusing Equation 2. Random errors from a Gaussian distribution with a standard deviation of 0.1 kcal mol−1 were added to the synthetic ΔG°u values to simulate our experimental error. ΔS291.15 values were calculated from sets of five errormodulated synthetic unfolding ΔG°u values using Equation 2. This process was iterated exhaustively, resulting in a distribution of ΔS291.15 values, from which σΔS was determined.
We also investigated the relationship between the size of the temperature range over which the five ΔG°u values were measured and the resulting uncertainty in ΔS291.15 determination. Five synthetic ΔG°u values for Nank1–7* were determined over a temperature range centered at 291.15 K using Equation 2, where the temperature interval (ΔT) between each of the five ΔG°u values was varied from 0.1 K to 4 K. The synthetic ΔG°u values were subjected to error from a Gaussian distribution of 0.2 kcal mol−1 standard deviation, and ΔS291.15 was determined by fitting Equation 2 to the synthetic ΔG°u values. A distribution of ΔS291.15 values was calculated at each temperature interval by exhaustive iteration by applying new random errors from the 0.2 kcal mol−1 Gaussian distribution to unfolding ΔG°u values (Supplemental Fig. S1).
Table 2.
Unfolding entropy values for proline variants of the Notch ankyrin domain
| Construct | ΔS291.15a | ΔΔS291.15b | nproc |
| PA13467 | 179.7 ± 13.0 | 42.8 ± 14.4 | 0 |
| PA1346 | 186.9 ± 6.5 | 50.0 ± 9.0 | 1 |
| PA134 | 153.7 ± 8.9 | 16.8 ± 10.8 | 2 |
| PA1 | 107.7 ± 6.2 | −29.9 ± 8.8 | 4 |
| PA3 | 150.1 ± 5.8 | 13.2 ± 8.6 | 4 |
| PA4 | 142.7 ± 12.0 | 5.8 ± 13.5 | 4 |
| PA6 | 130.7 ± 5.1 | −6.2 ± 8.0 | 4 |
| PA7 | 132.7 ± 6.2 | −4.0 ± 8.8 | 4 |
| Nankl-7* | 136.9 ± 6.2 | 0 | 5 |
| SP2 | 125.9 ± 13.0 | −11.0 ± 14.4 | 6 |
| AP5SP2 | 140.6 ± 8.6 | 3.7 ± 10.6 | 7 |
a The unfolding entropy change, reported in cal mol−1K−1. Uncertainties were calculated as described in Materials and Methods.
b The difference in unfolding entropy between a given variant and Nank1-7*. Uncertainties were determined by standard error propagation. Entropies are given in cal mol−1K−1.
c The number of prolines in consensus positions for each variant. Conditions: 150 mM NaCl, 25 mM Tris-HCl at pH 8.0.
Acknowledgments
We thank George Rose for many insightful conversations. This work was supported NIH Grants GM60001 and GM068462 (to D.B.) and a Burroughs Welcome predoctoral fellowship (to T.O.S.).
Abbreviations
Nank1–7*, the ankyrin domain of the Drosophila melanogaster Notch receptor, with the single cysteine replaced with serine
CD, circular dichroism
Article and publication are at http://www.proteinscience.org/cgi/doi/10.1110/ps.051505705.
Supplemental material: see www.proteinscience.org
References
- Bork, P. 1993. Hundreds of ankyrin-like repeats in functionally diverse proteins: Mobile modules that cross phyla horizontally? Proteins 17 363–374. [DOI] [PubMed] [Google Scholar]
- Bradley, C.M. and Barrick, D. 2002. Limits of cooperativity in a structurally modular protein: Response of the Notch ankyrin domain to analogous alanine substitutions in each repeat. J. Mol. Biol. 324 373–386. [DOI] [PubMed] [Google Scholar]
- Ferreon, J.C. and Hilser, V.J. 2003. The effect of the polyproline II (PPII) conformation on the denatured state entropy. Protein Sci. 12 447–457. [DOI] [PMC free article] [PubMed] [Google Scholar]
- Greene, R.F.J. and Pace, C.N. 1974. Urea and guanidine hydrochloride denaturation of ribonuclease, lysozyme, α-chymotrypsin, and β-lactoglobulin. J. Biol. Chem. 249 5388–5393. [PubMed] [Google Scholar]
- Matthews, B.W., Nicholson, H., and Becktel, W.J. 1987. Enhanced protein thermostability from site-directed mutations that decrease the entropy of unfolding. Proc. Natl. Acad. Sci. 19 6663–6667. [DOI] [PMC free article] [PubMed] [Google Scholar]
- Pace, C.N. 1986. Determination and analysis of urea and guanidine hydrochloride denaturation curves. Methods Enzymol. 131 266–280. [DOI] [PubMed] [Google Scholar]
- Pickett, S.D. and Sternberg, M.J. 1993. Empirical scale of side-chain conformational entropy in protein folding. J. Mol. Biol. 231 825– 839. [DOI] [PubMed] [Google Scholar]
- Santoro, M.M. and Bolen, D.W. 1988. Unfolding free energy changes determined by the linear extrapolation method. 1. Unfolding of phenylmethanesulfonyl α-chymotrypsin using different denaturants. Biochemistry 27 8063–8068. [DOI] [PubMed] [Google Scholar]
- Thompson, J.D., Higgins, D.G., and Gibson, T.J. 1994. CLUSTAL W: Improving the sensitivity of progressive multiple sequence alignment through sequence weighting, positions-specific gap penalties and weight matrix choice. Nucleic Acids Res. 22 4673–4680. [DOI] [PMC free article] [PubMed] [Google Scholar]
- Wharton, K.A., Johansen, K.M., Xu, T., and Artavanis-Tsakonas, S. 1985. Nucleotide sequence from the neurogenic locus notch implies a gene product that shares homology with proteins containing EGF-like repeats. Cell 43 567–581. [DOI] [PubMed] [Google Scholar]
- Zweifel, M.E. and Barrick, D. 2001. Studies of the ankyrin repeats of the Drosophila melanogaster Notch receptor. 2. Solution stability and cooperativity of unfolding. Biochemistry 40 14357–14367. [DOI] [PubMed] [Google Scholar]
- Zweifel, M.E., Leahy, D.J., Hughson, F.M., and Barrick, D. 2003. Structure and stability of the ankyrin domain of the Drosophila Notch receptor. Protein Sci. 11 2622–2632. [DOI] [PMC free article] [PubMed] [Google Scholar]


