

Abstract
Objectives. We examined the relations of self-report of general unfair treatment and self-report of race/ethnicity-specific discrimination with current smoking among Asian Americans. We investigated whether ethnic identification moderated either association.
Methods. Weighted logistic regressions were performed among 1977 Asian Americans recruited to the National Latino and Asian American Study (2002–2003).
Results. In weighted multivariate logistic regression models including both general unfair treatment and racial/ethnic discrimination, odds of current smoking were higher among Asian Americans who reported high levels of unfair treatment (odds ratio [OR]=2.80; 95% confidence interval [CI]=1.13, 6.95) and high levels of racial/ethnic discrimination (OR=2.40; 95% CI=0.94, 6.12) compared with those who reported no unfair treatment and discrimination, respectively. High levels of ethnic identification moderated racial/ethnic discrimination (F3 =3.25; P =.03). High levels of ethnic identification were associated with lower probability of current smoking among participants reporting high levels of racial/ethnic discrimination.
Conclusions. Our findings suggest that experiences of unfair treatment and racial/ethnic discrimination are risk factors for smoking among Asian Americans. Efforts to promote ethnic identification may be effective in mitigating the influence of racial/ethnic discrimination on smoking in this population.
Smoking is a serious health concern among Asian Americans, with lung cancer being the leading cause of cancer-related mortality in this population.1–3 A number of regional and national studies have found that the prevalence of smoking among some Asian American groups may exceed that of the general population.1,4–8 For example, a recent national study found that Vietnamese men had a current smoking prevalence of 29.5% compared with a prevalence of 25.2% for the general US population of men8 and also reported significant overall differences by gender, ethnicity, region, and socioeconomic characteristics.8,9 The targeted marketing of tobacco products to Asian Americans and immigrant groups also highlights the need to understand social determinants of smoking behaviors in this population.10,11
Previous studies have suggested that differences in exposure to unfair treatment and racial/ethnic discrimination, as forms of psychosocial stress, may help explain racial/ethnic disparities in health.12–20 Along these lines, patterns of smoking among Asian Americans may be explained by differences in exposure to unfair treatment and racial/ethnic discrimination, which may increase the risk of engaging in maladaptive behaviors as a means of managing and coping with stress.21–25 For example, recent studies have found that greater reporting of unfair treatment and racial/ethnic discrimination were associated with greater risk of smoking among Black adults and adolescents.24,25
Some studies in racial/ethnic minority groups have also shown that greater identification with one’s race/ethnicity or culture of origin may have a protective effect on health and may buffer the negative influence of unfair treatment and racial/ethnic discrimination. Ethnic identification, which involves a sense of cultural commitment and attachment to racial/ethnic practices and activities, may be associated with protective cultural factors, such as a greater enforcement of prohibitions against substance use and a stronger monitoring of health behaviors by members of one’s racial/ethnic group.26–31 Ethnic identification can also be associated with the provision of social support or reflect a means of coping with adverse life experiences which may buffer the effects of unfair treatment and racial/ethnic discrimination.32–40 However, other studies suggest that greater ethnic identification may be associated with negative health outcomes, particularly for maladaptive health behaviors that may be normative in a particular racial/ethnic group.41,42
Although many Asian Americans face racial/ethnic and anti-immigrant discrimination and prejudice, the health effects of such experiences in this population are poorly understood. Findings on unfair treatment and discrimination among African Americans may not be generalizable to immigrant groups, for whom norms in countries of origin may also influence health behaviors. In addition, few studies have examined whether ethnic identification may have direct effects on current smoking among Asian Americans, and whether racial/ethnic identification may moderate the effects of unfair treatment and discrimination.
We examined everyday experiences of unfair treatment and its association with current smoking status among Asian Americans. We also examined exposure to racial/ethnic discrimination measured with a separate instrument. Rather than conflating these 2 measures, we made a distinction between “everyday unfair treatment” and “racial/ethnic discrimination,” defining the former as the routine experience of adverse life events that are perceived as unfair and the latter as unfair treatment specifically attributed to race/ethnicity.13,43 By examining these constructs separately and simultaneously, we also investigated whether the association between racial/ethnic discrimination and smoking is accounted for by the experience of general unfair treatment. We also investigated whether ethnic identification may influence smoking among Asian Americans, and whether ethnic identification moderates the effect of unfair treatment and discrimination. We examined these relationships among Asian Americans using data from the National Latino and Asian American Study (NLAAS).
METHODS
Sample
A detailed description of the NLAAS sampling and study procedures has been previously documented.44–46 Briefly, the NLAAS sampling procedure consisted of 3 distinct components: (1) core sampling, in which participants were recruited with a multistage stratified area probability design; (2) high-density sampling, in which US Census block groups were oversampled where any individual target national-origin group (Chinese, Filipino, Vietnamese, Cuban, Mexican, and Puerto Rican) represented at least 5% of households; and (3) second-respondent sampling to recruit participants from households in which 1 eligible person had already participated. Our study was restricted to the Asian American component of the NLAAS. Previous studies that used the Asian American component of the NLAAS have shown that the weighted demographic characteristics of the sample were concordant with the 2000 US Census.8
A household sample of Asian American adults 18 years and older was recruited between May 2002 and November 2003 from a total of 25 states. A response rate of 83.5% was achieved for Asian American participants (83.9% for first and 82.2% for second respondents; the total weighted response rate was 65.6%; 69.3% and 73.7% for first and second respondents, respectively). Of the 2095 participants in the Asian American component of the NLAAS, descriptive analyses revealed that 22 participants could not be classified as being of Asian descent according to the US Census definition of Asian ancestry (e.g., which does not include Middle Easterners or Pacific Islanders). These participants were excluded from all analyses, yielding a final sample size of 2073.
Interviewers with linguistic and cultural backgrounds similar to those of the target population administered the NLAAS questionnaire. The NLAAS questionnaire was available to respondents in English, Cantonese, Mandarin, Tagalog, Vietnamese, and Spanish. Measures that were not previously available in these languages were translated from English using standard translation and back-translation techniques.47 Sixty-four percent of questionnaires were administered in a non-English language. Surveys were administered face-to-face to participants in the core and high-density samples, unless a telephone interview was specifically requested by the participant or if a face-to-face interview was not possible. Interviews were conducted via telephone to second respondents (mean duration = 2.6 h).
Measures
Smoking.
Smoking status was assessed according to Centers for Disease Control and Prevention–recommended criteria.48 Participants who had smoked 100 or more cigarettes in their lifetimes (calculated in the NLAAS by multiplying the number of smoking years, the number of smoking days per year, and the average number of cigarettes smoked on smoking days) and reported being a current smoker were classified as current smokers.8 Remaining participants were classified as noncurrent smokers (including never and former smokers).
Unfair treatment and racial/ethnic discrimination.
General unfair treatment, defined as the routine experience of life events perceived to be unfair but not necessarily attributed to a specific cause, was measured with the “experiences of everyday unfair treatment” scale developed by Williams et al.49 Unfair treatment was scored as the sum of 9 items designed to measure the frequency of routine experiences of unfair treatment (e.g., being treated with less respect, being called names or insulted), with each item having possible responses ranging from never (0) to almost every day (5) in the participant’s “day-to-day life.” Possible total scores ranged from 0 to 45. A priori cutpoints for defining categories of exposure were set at none (0), low (1–9), moderate (10–18), and high (≥ 19).
Exposure to racial/ethnic discrimination was measured with a separate instrument consisting of 3 items developed by Vega et al.50 Two items measured how often respondents felt they were disliked or treated unfairly because of their race/ethnicity. The third item measured how often the participant had seen friends of the same race/ethnicity treated unfairly because of their race/ethnicity. Items were measured on a 4-point scale ranging from 0 (never) to 3 (often), with total scores ranging from 0 to 9. Categories of experiences of racial/ethnic discrimination were also constructed according to relevant a priori cutpoints: none (0), low (1–3), moderate (4–6), and high (≥ 7).
A single attribution item at the end of the Williams measure of unfair treatment assessed the perceived main reason for the experience of any unfair treatment; the question was asked only of participants who reported unfair treatment. In measuring racial/ethnic discrimination, we did not use the racial/ethnic attribution item because we sought to use 2 distinct measures, one of unfair treatment and the other of racial/ethnic discrimination, rather than treat the latter as a subset of the former. A recent study that used the Williams unfair treatment measure also did not incorporate the racial/ethnic attribution item in assessing the effects of unfair treatment on African American women’s health.51 Three findings based on bivariate analysis suggest that the Williams and Vega measures capture different experiences: (1) the correlation between them, when they were treated as continuous variables, was relatively low (r=0.43); (2) among participants reporting no unfair treatment on the Williams measure, nearly one third (29.6%) reported some racial/ethnic discrimination on the Vega measure; and (3) among participants reporting no racial/ethnic discrimination on the Vega measure, slightly more than half (51.0%) reported some unfair treatment on the Williams measure. Together, these results suggest that a separate instrument asking directly about racial discrimination may measure dimensions of racial/ethnic discrimination that an attribution item asked after a measurement of unfair treatment does not.
Ethnic identification.
Four items measuring ethnic identification were adapted from the National Comorbidity Survey-Replication.52 Items measured how closely the respondent identified with others of the same racial/ethnic background, how much time they would choose to spend with others of the same racial/ethnic group, and cultural commitment to one’s racial/ethnic group, with values ranging from 0 (not at all, none, or not important at all ) to 3 (very closely, a lot, or very important). Total scores ranged from 0 to 12. Participants with total scores greater than neutral (> 6) were classified as having high levels of ethnic identification.
Sociodemographic Covariates
Ethnicity.
Two questions assessing country of ethnic origin and self-identified ethnicity were used to classify ethnicity. Participants who reported a single Asian ethnic origin or ethnicity were classified as belonging to that ethnic group. Participants who reported multiple or discordant (or multiple and discordant) countries of ethnic origin or self-identified ethnicity/race were classified as being of multiple race/ethnicity. Five Asian ethnicity categories were created: Chinese, Filipino, Vietnamese, other single Asian ethnicity, and multiethnic/racial.
Socioeconomic position.
Four measures of socioeconomic position were included as covariates: the ratio of household income to poverty threshold (based on the 2000 US Census; poor was <1.00; near-poor was 1.00–1.99; nonpoor was ≥ 2.00)53,54; employment status (employed, unemployed, out of labor force); educational attainment, categorized in relation to credentials as less than 12 years (i.e., less than high school), 12 years (high school graduate only), 13 to 15 years (at least high school but less than 4 years of college), 16 years or more (4 or more years of college); and health insurance coverage (private, public, uninsured).
English proficiency.
English language proficiency was assessed using 3 items adapted from the Cultural Identity Scales for Latino Adolescents intended to measure self-evaluated proficiency in speaking, reading, and writing English, with values for each item ranging from 1 (poor) to 4 (excellent).55 Summed scores were divided by 3, so that English language proficiency scores ranged from 1 to 4.
Social desirability.
Social desirability was measured with 10 items designed to measure personality bias in response to sensitive questions. Items were endorsed as being true (1) or false (0), with greater summed scores representing higher levels of social desirability bias.56
Demographic characteristics.
Other sociodemographic covariates in our analyses included self-reported age, gender, nativity, marital status (married, never married, and widowed/separated/divorced), and region of residence (West, Northeast, Midwest, and South). In multivariate analyses, the interaction between gender and nativity was included because previous studies indicated that US-born women are more likely to smoke than are foreign-born women, whereas foreign-born men are more likely to smoke than are US-born men.8
Analyses
Seventy-five participants were missing data on 1 or more items measuring unfair treatment. In 34 cases in which only 1 item of the measure was missing data (8 items complete), the within-participant mean value of completed items was used to substitute for the missing values. Forty-seven participants who were missing data on items assessing racial/ethnic discrimination and 19 participants who had missing data on ethnic identification were excluded from analyses. In addition, we excluded participants missing values on variables with near-complete data (nativity = 2 participants; marital status = 2 participants; education=1 participant; English proficiency= 8 participants; social desirability = 4 participants; region of residence = 2 participants). Dummy variables for missing data were constructed for variables with the most cases of missing data: poverty status (233), employment status (127), and insurance status (88). Using these techniques, we excluded a total of 96 participants (4.6%) by listwise deletion, a technique considered acceptable when data are missing for fewer than 5% of all participants.57 Participants excluded from analyses were not significantly different from the entire sample on sociodemographic characteristics and our main predictors.
We used weighted survey methods taking into account the complex sampling design for all bivariate and multivariate analyses using SAS-callable SUDAAN version 9.0.0 (Research Triangle Institute, Research Triangle Park, NC).58 Multivariate analyses incorporating control for sociodemographic covariates were conducted to examine the separate effects of unfair treatment and racial/ethnic discrimination on current smoking. Models were then fit that included both unfair treatment and racial/ethnic discrimination. Ethnic identification was added to examine the main effect of ethnic identification. Interaction terms were added to investigate whether ethnic identification had differential effects by ethnicity and nativity. To examine whether ethnic identification buffered the effect of unfair treatment and racial/ethnic discrimination, we also added the corresponding interaction terms.
RESULTS
Unweighted sample characteristics are presented in Table 1 ▶. Thirteen percent of participants were current smokers. A majority of the sample reported some unfair treatment (74.2%) and some racial/ethnic discrimination (62.4%). A substantial percentage of participants reported moderate or high levels of unfair treatment and racial/ethnic discrimination (32.9% and 23.9%, respectively). In addition, a majority of participants reported high levels of ethnic identification (77.3%). Weighted sample characteristics have previously been published.8
TABLE 1—
Unweighted Sample Characteristics Among Asian Americans, by Current Smoking Status: National Latino and Asian American Study, 2002–2003
| Total | Current | Noncurrent | |
| Total, No. | 1977 | 256 | 1721 |
| Unfair treatment, % | |||
| None | 25.8 | 19.9 | 26.6 |
| Low | 41.3 | 41.0 | 41.4 |
| Moderate | 28.5 | 30.1 | 28.3 |
| High | 4.4 | 9.0 | 3.7 |
| Racial/ethnic discrimination, % | |||
| None | 37.6 | 35.9 | 37.8 |
| Low | 38.6 | 39.5 | 38.5 |
| Moderate | 21.9 | 20.7 | 22.1 |
| High | 2.0 | 3.9 | 1.7 |
| Ethnic Identification, % | |||
| Low identification | 22.7 | 29.7 | 21.7 |
| High identification | 77.3 | 70.3 | 78.3 |
| Ethnicity, % | |||
| Chinese | 23.8 | 18.0 | 24.6 |
| Filipino | 19.2 | 21.5 | 18.8 |
| Vietnamese | 21.2 | 22.7 | 21.0 |
| Other single Asian ethnicity | 20.2 | 18.0 | 20.6 |
| Multiethnic/racial | 15.6 | 19.9 | 14.9 |
| Marital status, % | |||
| Married | 65.5 | 60.6 | 66.2 |
| Single | 25.1 | 29.7 | 24.4 |
| Widowed/separated/divorced | 9.5 | 9.8 | 9.4 |
| Nativity, % | |||
| US born | 21.9 | 27.0 | 21.1 |
| Foreign born | 78.2 | 73.1 | 78.9 |
| Gender, % | |||
| Men | 48.1 | 77.0 | 43.8 |
| Women | 51.9 | 23.1 | 56.2 |
| Region of residence, % | |||
| West | 81.4 | 78.1 | 81.9 |
| Midwest | 4.2 | 5.5 | 4.0 |
| Northeast | 7.4 | 9.4 | 7.1 |
| South | 7.0 | 7.0 | 7.0 |
| Poverty status,a % | |||
| Nonpoor (≥ 2.00) | 65.9 | 65.2 | 66.0 |
| Near poor (1.00–1.99) | 8.2 | 12.9 | 7.6 |
| Poor (< 1.00) | 14.1 | 12.9 | 14.2 |
| Missing | 11.8 | 9.0 | 12.2 |
| Employment, % | |||
| Employed | 67.5 | 72.7 | 66.7 |
| Unemployed | 15.5 | 15.2 | 15.6 |
| Out of labor force | 10.5 | 3.9 | 11.5 |
| Missing | 6.5 | 8.2 | 6.2 |
| Education, y, % | |||
| ≥ 16 | 42.8 | 29.7 | 44.8 |
| 13–15 | 25.2 | 27.0 | 25.0 |
| 12 | 17.3 | 25.0 | 16.1 |
| < 12 | 14.7 | 18.4 | 14.1 |
| Insurance, % | |||
| Private | 66.5 | 60.2 | 67.4 |
| Public | 15.2 | 10.9 | 15.9 |
| Uninsured | 13.8 | 23.8 | 12.3 |
| Other/missing | 4.5 | 5.1 | 4.4 |
| Age, mean (SD) | 40.8 (14.6) | 38.3 (13.0) | 41.2 (14.8) |
| English proficiency,b mean (SD) | 2.8 (1.0) | 2.8 (1.0) | 2.8 (1.0) |
| Social desirability,c mean (SD) | 2.2 (2.0) | 2.2 (2.1) | 2.2 (2.0) |
Note. Other single Asian ethnicity includes Bangladeshi, Burmese, Cambodian, Hmong, Indian, Indonesian, Japanese, Korean, Laotian, Malaysian, Mongolian, Myanmai, Pakistani, Singaporean, Sri Lankan, Taiwanese, and Thai.
aThis is the ratio of household income to poverty threshold based on the 2000 US Census.
bThis was assessed using 3 items adapted from the Cultural Identity Scales for Latino Adolescents intended to measure self-evaluated proficiency in speaking, reading, and writing English, with values for each item ranging from 1 (poor) to 4 (excellent). Summed scores were divided by 3, so that English language proficiency scores ranged from 1 to 4.
cThis was measured with 10 items designed to measure personality bias in response to sensitive questions. Items were endorsed as being true (1) or false (0), with greater summed scores representing higher levels of social desirability bias.
Smoking and Unfair Treatment, Discrimination, and Ethnic Identification
Weighted bivariate analyses indicated that participants who reported high levels of unfair treatment had greater odds of being a current smoker compared with those who reported no unfair treatment (odds ratio [OR]=4.02; 95% confidence interval [CI] = 1.86, 8.68). Participants who reported high racial/ethnic discrimination also had greater odds of being a current smoker compared with those who reported no racial/ethnic discrimination (OR=2.14; 95% CI=0.88, 5.16), but this association was only significant at the P=.1 level.
Results from weighted multivariate analyses incorporating control for sociodemographic covariates are presented in Table 2 ▶. Reporting high levels of unfair treatment was associated with greater odds of current smoking; participants who reported high levels of unfair treatment had 2.62 times the odds of being a current smoker of those who reported no unfair treatment (95% CI = 1.12, 6.17; model 1). High levels of racial/ethnic discrimination were also significantly associated with current smoking status: participants reporting the highest level of racial/ethnic discrimination had more than 3 times the odds of being a current smoker of those who reported no racial/ethnic discrimination (OR = 3.06; 95% CI = 1.07, 8.72; model 2).
TABLE 2—
Results of Weighted Logistic Regression Analysis of Unfair Treatment, Racial/Ethnic Discrimination, Ethnic Identification, and Current Smoking Among Asian Americans: National Latino and Asian American Study, 2002–2003
| Model 1, OR (95% CI) | Model 2, OR (95% CI) | Model 3, OR (95% CI) | Model 4, OR (95% CI) | |
| Unfair treatment | ||||
| None (Ref) | 1.00 | 1.00 | 1.00 | |
| Low | 1.15 (0.50, 2.62) | 1.12 (0.50, 2.52) | 1.10 (0.48, 2.52) | |
| Moderate | 1.23 (0.44, 3.45) | 1.21 (0.46, 3.19) | 1.19 (0.44, 3.20) | |
| High | 2.62 (1.12, 6.17) | 2.80 (1.13, 6.95) | 2.80 (1.13, 6.92) | |
| Discrimination | ||||
| None (Ref) | 1.00 | 1.00 | 1.00 | |
| Low | 1.22 (0.67, 2.25) | 1.14 (0.66, 1.99) | 1.12 (0.66, 1.93) | |
| Moderate | 1.01 (0.53, 1.95) | 0.80 (0.46, 1.40) | 0.79 (0.45, 1.37) | |
| High | 3.06 (1.07, 8.72) | 2.40 (0.94, 6.12) | 2.38 (0.92, 6.14) | |
| Ethnic identification | ||||
| Low (Ref) | ||||
| High | 0.79 (0.52, 1.19) | |||
| Ethnicity | ||||
| Chinese (Ref) | 1.00 | 1.00 | 1.00 | 1.00 |
| Filipino | 1.51 (0.78, 2.93) | 1.63 (0.82, 3.20) | 1.52 (0.75, 3.08) | 1.54 (0.74, 3.19) |
| Vietnamese | 1.16 (0.69, 1.93) | 1.11 (0.71, 1.74) | 1.12 (0.67, 1.87) | 1.16 (0.68, 1.97) |
| Other single Asian ethnicity | 1.22 (0.74, 2.01) | 1.26 (0.77, 2.06) | 1.24 (0.73, 2.10) | 1.25 (0.73, 2.13) |
| Multiethnic/racial | 1.24 (0.66, 2.31) | 1.35 (0.73, 2.51) | 1.27 (0.66, 2.45) | 1.26 (0.65, 2.44) |
| Age, y | 0.98 (0.96, 1.00) | 0.98 (0.96, 1.00) | 0.98 (0.96, 1.00) | 0.98 (0.93, 1.00) |
| Marital status | ||||
| Married (Ref) | 1.00 | 1.00 | 1.00 | 1.00 |
| Single | 1.03 (0.62, 1.74) | 1.15 (0.72, 1.84) | 1.03 (0.62, 1.72) | 1.02 (0.62, 1.68) |
| Widowed/separated/divorced | 1.58 (0.90, 2.78) | 1.59 (0.91, 2.78) | 1.62 (0.93, 2.80) | 1.62 (0.93, 2.83) |
| Nativity | ||||
| US born (Ref) | 1.00 | 1.00 | 1.00 | 1.00 |
| Foreign born | 1.59 (1.01, 2.53) | 1.61 (0.99, 2.63) | 1.72 (1.10, 2.69) | 1.78 (1.11, 2.86) |
| Gender | ||||
| Women (Ref) | 1.00 | 1.00 | 1.00 | 1.00 |
| Men | 0.80 (0.45, 1.45) | 0.80 (0.45, 1.43) | 0.82 (0.45, 1.51) | 0.81 (0.45, 1.46) |
| Gender × nativity | 0.26 (0.10, 0.68) | 0.25 (0.09, 0.66) | 0.25 (0.09, 0.66) | 0.25 (0.09, 0.67) |
| Region of residence | ||||
| West (Ref) | 1.00 | 1.00 | 1.00 | 1.00 |
| Midwest | 1.39 (0.88, 2.20) | 1.45 (0.84, 2.48) | 1.38 (0.87, 2.18) | 1.38 (0.88, 2.18) |
| Northeast | 1.36 (0.72, 2.55) | 1.37 (0.74, 2.53) | 1.32 (0.65, 2.68) | 1.31 (0.63, 2.70) |
| South | 0.97 (0.44, 2.15) | 0.96 (0.42, 2.19) | 0.96 (0.43, 2.18) | 0.94 (0.42, 2.11) |
| Poverty statusa | ||||
| Nonpoor (Ref) | 1.00 | 1.00 | 1.00 | 1.00 |
| Near poor | 1.53 (0.82, 2.83) | 1.47 (0.84, 2.59) | 1.54 (0.82, 2.89) | 1.53 (0.83, 2.85) |
| Poor | 0.86 (0.53, 1.41) | 0.86 (0.54, 1.38) | 0.86 (0.53, 1.40) | 0.85 (0.52, 1.39) |
| Missing | 0.69 (0.39, 1.19) | 0.65 (0.36, 1.18) | 0.70 (0.40, 1.22) | 0.68 (0.38, 1.21) |
| Employment status | ||||
| Employed (Ref) | 1.00 | 1.00 | 1.00 | 1.00 |
| Unemployed | 1.14 (0.58, 2.23) | 1.12 (0.58, 2.19) | 1.16 (0.60, 2.27) | 1.14 (0.57, 2.26) |
| Out of labor force | 0.32 (0.13, 0.78) | 0.30 (0.13, 0.71) | 0.32 (0.13, 0.75) | 0.31 (0.13, 0.75) |
| Missing | 1.38 (0.67, 2.83) | 1.41 (0.72, 2.75) | 1.38 (0.68, 2.82) | 1.37 (0.67, 2.82) |
| Education, y | ||||
| ≥ 16 (Ref) | 1.00 | 1.00 | 1.00 | 1.00 |
| 13–15 | 1.29 (0.79, 2.09) | 1.27 (0.82, 1.96) | 1.27 (0.79, 2.05) | 1.24 (0.77, 2.01) |
| 12 | 2.39 (1.48, 3.85) | 2.46 (1.53, 3.96) | 2.42 (1.49, 3.92) | 2.32 (1.42, 3.78) |
| < 12 | 2.56 (1.26, 5.21) | 2.59 (1.22, 5.49) | 2.57 (1.24, 5.33) | 2.50 (1.18, 5.30) |
| Insurance | ||||
| Private (Ref) | 1.00 | 1.00 | 1.00 | 1.00 |
| Public | 0.87 (0.50, 1.52) | 0.89 (0.52, 1.51) | 0.87 (0.50, 1.51) | 0.87 (0.51, 1.49) |
| Uninsured | 2.14 (1.37, 3.33) | 2.18 (1.40, 3.39) | 2.16 (1.37, 3.41) | 2.20 (1.40, 3.48) |
| Missing | 1.45 (0.62, 3.41) | 1.44 (0.66, 3.13) | 1.51 (0.66, 3.48) | 1.51 (0.66, 3.46) |
| English proficiency | 0.98 (0.71, 1.35) | 0.96 (0.70, 1.32) | 0.97 (0.70, 1.35) | 0.96 (0.69, 1.33) |
| Social desirability | 1.02 (0.92, 1.12) | 1.02 (0.92, 1.13) | 1.02 (0.92, 1.13) | 1.02 (0.92, 1.13) |
Note. OR = odds ratio; CI = confidence interval. See “Methods” section for information about how variables were measured. Model 1 examined the effect of unfair treatment on current smoking and controlled for sociodemographic characteristics. Model 2 examine the effect of raciallethnic discrimination on current smoking and controlled for sociodemographic characteristics. Model 3 examined the effect of unfair treatment and raciallethnic discrimination on current smoking and controlled for sociodemographic characteristics. Model 4 examined the effect of unfair treatment, raciallethnic discrimination, and ethnic identification simultaneously in relation to current smoking and controlled for sociodemographic characteristics.
aThis is the ratio of household income to poverty threshold based on the 2000 US Census.
We included both unfair treatment and racial/ethnic discrimination in the model to test whether the effect of racial/ethnic discrimination could be accounted for by the experience of more-general unfair treatment. High levels of unfair treatment continued to be associated with current smoking (OR = 2.80; 95% CI = 1.13, 6.95). The odds ratio for high racial/ethnic discrimination was attenuated to 2.40 (95% CI = 0.94, 6.12) and approached significance at the P = .1 level.
Ethnic Identification, Unfair Treatment, and Discrimination
High levels of ethnic identification were associated with lower odds of being a current smoker compared with low levels (OR = 0.79; 95% CI=0.52, 1.19; model 4), but the relation was not statistically significant. We tested whether the influence of ethnic identification differed by ethnicity or nativity by adding the corresponding interaction terms. Interactions with ethnicity (F4 = 1.10; P = .37) and nativity (F1 = 0.14; P = .71) were not statistically significant and were not included in further models.
We included both general unfair treatment and racial/ethnic identification in the model to test whether the effect of racial/ethnic discrimination could be accounted for by the experience of unfair treatment more broadly. However, the interaction between racial/ethnic discrimination and ethnic identification was significant (F3 = 3.25; P = .03). The interaction between ethnic identification and racial/ethnic discrimination is illustrated in Figure 1 ▶. High levels of racial/ethnic discrimination were associated with a greater predicted probability of current smoking among those with low levels of ethnic identification but had little association with current smoking among those with high levels of ethnic identification.
FIGURE 1—
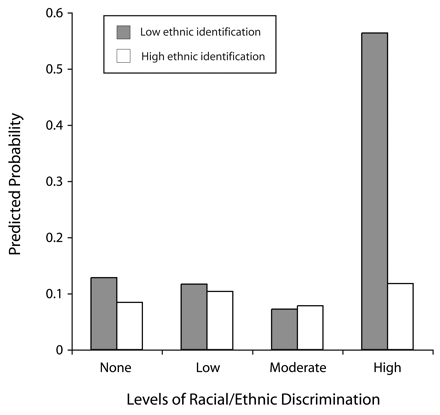
Predicted probability of current smoking among Asian Americans, by interaction between levels of perceived racial/ethnic discrimination and ethnic identification: National Latino and Asian American Study, 2002–2003.
Note. We used 4 items to measure ethnic identification. Items measured how closely the respondent identified with others of the same racial/ethnic background, how much time they would choose to spend with others of the same racial/ethnic group, and cultural commitment to one’s racial/ethnic group. See “Methods” section for further details.
DISCUSSION
Our study has several strengths and extends previous findings by (1) investigating relationships between unfair treatment and racial/ethnic discrimination with current smoking in a more nationally representative sample of Asian Americans, (2) showing that both unfair treatment and racial/ethnic discrimination have effects on current smoking status even after control for one another, and (3) examining ethnic group identification and its moderating effect on racial/ethnic discrimination. Our findings suggest that racial/ethnic discrimination is distinct from the experience of unfair treatment and that exposure to racial/ethnic discrimination exerts an adverse effect on smoking behavior that cannot be completely explained by general unfair treatment. Along these lines, the disproportionate experience of social hazards specifically caused by race/ethnicity may help to explain Asian American smoking patterns. In addition, ethnic identification may buffer the increased risk of smoking associated with experiencing racial/ethnic discrimination among Asian Americans.
A caveat to our findings is the self-reported nature of our main predictors. Self-reported measures of unfair treatment and racial/ethnic discrimination depend not only on the actual experience of an event, but also on an individual’s interpretation of the event as being unfair or an instance of racial/discrimination, as well as the participant’s willingness to disclose and ability to recall those events.14,59,60 Furthermore, as we found, measures of racial/ethnic discrimination may not necessarily be a subset of measures of unfair treatment. We found that a substantial percentage of participants who reported no unfair treatment reported at least some racial/ethnic discrimination (29.6%), suggesting that items measuring racial/ethnic discrimination that contain an explicit racial/ethnic dimension may encourage reports or recollections of such experiences. Our finding that ethnic identification moderated racial/ethnic discrimination but not unfair treatment also suggests that these measures may capture qualitatively different types of experiences and further supports our distinction between more-general forms of unfair treatment versus discrimination specifically attributed to race/ethnicity.
An additional limitation of our study is related to the generalizability of our findings. Although our sample’s characteristics have been shown to be concordant with those of the US Census, because our instrument was not available in languages other than English, Cantonese, Mandarin, Tagalog, Vietnamese, and Spanish, Asian Americans who do not speak these languages may have been underrepresented.8 Furthermore, the aggregation of diverse and heterogeneous Asian ancestry groups may have masked differential effects by ethnicity. However, we believe that studies on Asian Americans as a population merit attention because “Asian” is a recognized racial/ethnic minority category in the United States, and subsequently, its members to some degree face common institutional barriers, are subject to broad policy initiatives targeting Asian Americans, and are susceptible to negative interpersonal interactions because of race/ethnicity.
The cross-sectional nature of our study also limits inferences regarding causality. However, our findings are consistent with the literature on the adverse effects of unfair treatment and racial/ethnic discrimination on substance use and are concordant with our theoretical framework that unfair treatment and racial/ethnic discrimination, as forms of psychosocial stress, are causally related to maladaptive coping behaviors.21–25 Future research could use longitudinal data to further investigate these relationships. Additionally, studies may examine the mechanisms through which ethnic group identification may buffer the influence of unfair treatment and racial/ethnic discrimination on other health outcomes or examine associations with smoking cessation, research on which has been particularly lacking in Asian American communities.61,62
Our findings may aid in identifying and understanding pathways associated with smoking in the Asian American population. They suggest that tobacco control agendas that incorporate the specific social and contextual factors we found to be associated with smoking in this population may be effective. Our results are consistent with efforts to integrate social justice issues with public health interventions and the need to develop culturally competent programs specifically for Asian Americans.63,64 Group-level workshops and individual counseling could be designed to raise consciousness of unfair treatment and racial/ethnic discrimination, develop effective coping responses, and foster relationships with other Asian Americans, which may mitigate the negative effects of racial/ethnic discrimination. Tobacco control advocates should consider addressing broader social issues by enforcing antidiscrimination policies at the institutional level (e.g., in employment and housing) and by mitigating the negative effects of interpersonal unfair treatment and discrimination through ethnic-specific programs and community centers. Such steps could be part of a comprehensive tobacco control agenda for Asian Americans.
Acknowledgments
The National Latino and Asian American Study is supported by the National Institute of Mental Health, Bethesda, Md (grants U01-MH062209 and U01-MH062207) with supplemental support from the Office of Behavioral and Social Sciences Research, Substance Abuse and Mental Health Services Agency, Rockville, Md, and the Latino Research Program Project (grant P01-MH059876). David H. Chae was also supported by the W. K. Kellogg Doctoral Fellowship in Health Policy.
Peer Reviewed
Contributors D. H. Chae originated the study and had primary responsibility for the analysis of data and the writing. D. T. Takeuchi acquired the data and supervised the study. E. M. Barbeau, G. G. Bennett, J. Lindsey, and N. Krieger were involved in the design and supervision of the study and the data analysis plan.
Human Participant Protection All study procedures and protocols were approved by the University of Washington, University of Michigan, Cambridge Health Alliance, and the Harvard School of Public Health.
References
- 1.US Department of Health and Human Services. Tobacco Use Among US Racial/Ethnic Minority Groups—African Americans, American Indians and Alaska Natives, Asian Americans and Pacific Islanders, and Hispanics: A Report of the Surgeon General. Atlanta, Ga: Centers for Disease Control and Prevention; 1998.
- 2.Baluja KF, Park J, Myers D. Inclusion of immigrant status in smoking prevalence statistics. Am J Public Health. 2003;93:642–646. [DOI] [PMC free article] [PubMed] [Google Scholar]
- 3.Lew R, Tanjasiri SP. Slowing the epidemic of tobacco use among Asian Americans and Pacific Islanders. Am J Public Health,. 2003;93:764–768. [DOI] [PMC free article] [PubMed] [Google Scholar]
- 4.Yu ESH, Chen EH, Kim KK, Abdulrahim S. Smoking among Chinese Americans: behavior, knowledge, and beliefs. Am J Public Health. 2002;92:1007–1012. [DOI] [PMC free article] [PubMed] [Google Scholar]
- 5.Chen MS. The status of tobacco cessation research for Asian Americans and Pacific Islanders. Asian Am Pac Isl J Health. 2001;9:63–65. [PubMed] [Google Scholar]
- 6.Ma GX, Shive S, Tan Y, Toubbeh J. Prevalence and predictors of tobacco use among Asian Americans in the Delaware Valley region. Am J Public Health. 2002; 92:1013–1020. [DOI] [PMC free article] [PubMed] [Google Scholar]
- 7.Jenkins CN, McPhee SJ, Ha NT, Nam TV, Chen A. Cigarette smoking among Vietnamese immigrants in California. Am J Health Promot. 1995;9:254–256. [DOI] [PubMed] [Google Scholar]
- 8.Chae DH, Gavin AR, Takeuchi DT. Smoking prevalence among Asian Americans: findings from the National Latino and Asian American Study (NLAAS). Public Health Rep. 2006;121:755–763. [DOI] [PMC free article] [PubMed] [Google Scholar]
- 9.Centers for Disease Control and Prevention. Cigarette smoking among adults—United States, 2002. MMWR. 2004;53:427–431. [PubMed] [Google Scholar]
- 10.Muggli ME, Pollay RW, Lew R, Joseph AM. Targeting of Asian Americans and Pacific Islanders by the tobacco industry: results from the Minnesota Tobacco Document Depository. Tob Control. 2002;11:201–209. [DOI] [PMC free article] [PubMed] [Google Scholar]
- 11.Acevedo-Garcia D, Barbeau EM, Bishop JA, Pan J, Emmons KM. Undoing an epidemiological paradox: the tobacco industry’s targeting of US immigrants. Am J Public Health. 2004;94:2188–2193. [DOI] [PMC free article] [PubMed] [Google Scholar]
- 12.Krieger N. Racial and gender discrimination: risk factors for high blood pressure? Soc Sci Med. 1990;30: 1273–1281. [DOI] [PubMed] [Google Scholar]
- 13.Krieger N. Discrimination and health. In: Berkman L, Kawachi I, eds. Social Epidemiology. New York, NY: Oxford University Press; 2000:36–75.
- 14.Krieger N. Embodying inequality: a review of concepts, measures, and methods for studying health consequences of discrimination. Int J Health Serv. 1999;29: 295–352. [DOI] [PubMed] [Google Scholar]
- 15.Krieger N, Sidney S. Racial discrimination and blood pressure: the CARDIA study of young Black and White adults. Am J Public Health. 1996;86A:1370–8. [DOI] [PMC free article] [PubMed] [Google Scholar]
- 16.Williams DR, Neighbors HW, Jackson JS. Racial/ethnic discrimination and health: findings from community studies. Am J Public Health. 2003;93:200–208. [DOI] [PMC free article] [PubMed] [Google Scholar]
- 17.Clark R, Anderson A, Clark VR, Williams DR. Racism as a stressor for African Americans: a biopsychosocial model. Am Psychologist. 1999;54:805–816. [DOI] [PubMed] [Google Scholar]
- 18.Gee GC. A multilevel analysis of the relationship between institutional racial discrimination and individual racial discrimination and health status. Am J Public Health. 2002;92:615–623. [DOI] [PMC free article] [PubMed] [Google Scholar]
- 19.Broman CL. The health consequences of racial discrimination: a study of African Americans. Ethn Dis. 1996;6:148–153. [PubMed] [Google Scholar]
- 20.Boardman JE, Finch BK, Ellison CG, Williams D, Jackson J. Neighborhood disadvantage, stress, and drug use among adults. J Health Soc Behav. 2001;42: 151–165. [PubMed] [Google Scholar]
- 21.Yen IH, Ragland DR, Greiner BA, Fisher JM. Racial discrimination and alcohol-related behavior in urban transit operators: findings from the San Francisco MUNI health and Safety Study. Public Health Rep. 1999;114:448–458. [DOI] [PMC free article] [PubMed] [Google Scholar]
- 22.Martin JK, Tuch SA, Roman PM. Problem drinking patterns among African Americans: the impacts of reports of discrimination, perceptions of prejudice, and “risky” coping strategies. J Health Soc Behav. 2003;44: 408–425. [PubMed] [Google Scholar]
- 23.Gibbons FX, Gerrard M, Cleveland MJ, Wills TA, Brody GH. Perceived discrimination and substance use in African American parents and their children: a panel study. J Pers Soc Psychol. 2004;86:1048–1061. [DOI] [PubMed] [Google Scholar]
- 24.Bennett GG, Wolin KY, Robinson EL, Fowler S, Edwards CL. Perceived racial/ethnic harassment and tobacco use among African American young adults. Am J Public Health. 2005;95:238–240. [DOI] [PMC free article] [PubMed] [Google Scholar]
- 25.Guthrie BJ, Young AM, Williams DR, Boyd CJ, Kintner EK. African American girls’ smoking habits and day-to-day experiences with racial discrimination. Nurs Res. 2002;51:183–190. [DOI] [PubMed] [Google Scholar]
- 26.Phinney JS. Ethnic identity and self-esteem: a review and integration. Hisp J Behav Sci. 1991;13:193–208. [Google Scholar]
- 27.Phinney JS, Horenczyk G, Liebkind K, Vedder P. Ethnic identity, immigration, and well-being: an interactional perspective. J Soc Issues. 2001;57:493–510. [Google Scholar]
- 28.Frisbie WP, Cho Y, Hummer RA. Immigration and the health of Asian and Pacific Islander adults in the United States. Am J Epidemiol. 2001;153: 372–380. [DOI] [PubMed] [Google Scholar]
- 29.Scribner R. Paradox as paradigm—the health outcomes of Mexican Americans. Am J Public Health. 1996;86:303–305. [DOI] [PMC free article] [PubMed] [Google Scholar]
- 30.Napolitano M, Goldberg BW. Migrant health. In: Loue S, ed. Handbook of Immigrant Health. New York, NY: Plenum Press; 1998:261–276.
- 31.Rebhun LA. Substance use among immigrants to the United States. In: Loue S, ed. Handbook of Immigrant Health. New York, NY: Plenum Press; 1998: 493–519.
- 32.Noh S, Beiser M, Kaspar V, Hou F, Rummens J. Perceived racial discrimination, depression, and coping: a study of Southeast Asian refugees in Canada. J Health Soc Behav. 1999;40:193–207. [PubMed] [Google Scholar]
- 33.Noh S, Kaspar V. Perceived discrimination and depression: moderating effects of coping, acculturation and ethnic support. Am J Public Health. 2003;93: 232–238. [DOI] [PMC free article] [PubMed] [Google Scholar]
- 34.Mossakowski KN. Coping with perceived discrimination: does ethnic identity protect mental health? J Health Soc Behav. 2003;44:318–331. [PubMed] [Google Scholar]
- 35.Branscombe NR, Schmitt M, Harvey RD. Perceiving pervasive discrimination among African Americans: implications for group identification and well-being. J Pers Soc Psychol. 199;77:135–149. [Google Scholar]
- 36.Operario D, Fiske ST. Ethnic identity moderates perceptions of prejudice: judgments of personal versus group discrimination and subtle versus blatant bias. Pers Soc Psychol Bull. 2001;27:550–561. [Google Scholar]
- 37.Romero AJ, Roberts RE. The impact of multiple dimensions of ethnic identity on discrimination and adolescents’ self-esteem. J Appl Soc Psychol. 2003;33: 2288–2305. [Google Scholar]
- 38.Sellers RM, Caldwell CH, Schmeelk-Cone KH, Zimmerman MA. Racial identity, racial discrimination, perceived stress, and psychological distress among African American young adults. J Health Soc Behav. 2003; 43:302–317. [PubMed] [Google Scholar]
- 39.Sellers RM, Shelton JN. The role of racial identity in perceived discrimination. J Pers Soc Psychol. 2003; 84:1079–1092. [DOI] [PubMed] [Google Scholar]
- 40.Yoshikawa H, Wilson PA, Chae DH, Cheng J. Do family and friendship networks protect against the influence of discrimination on mental health and HIV risk among Asian and Pacific Islander gay men? AIDS Educ Prev. 2004;16:84–100. [DOI] [PubMed] [Google Scholar]
- 41.Ma GX, Chu KC, Tsou W. Smoking prevention and intervention in Asian American communities: a case study. In: Ma GX, Henderson G, eds. Ethnicity and Substance Abuse: Prevention and Intervention. Springfield, Ill: Charles C Thomas; 2002:169–188.
- 42.Zane NW, Kim JH. Substance use and abuse. In: Zane NW, Takeuchi DT, Yank KN, eds. Confronting Critical Health Issues of Asian and Pacific Islander Americans. Thousand Oaks, Calif: Sage; 1994:316–345.
- 43.Jackson JS, Brown KT, Kirby DC. International perspectives on prejudice and racism. In: Eberhardt JL, Fiske, ST, eds. Confronting Racism: The Problem and the Response. Thousand Oaks, Calif: Sage Publications; 1998:101–13.
- 44.Alegría M, Takeuchi D, Canino G, et al. Considering context, place and culture: the National Latino and Asian American Study. Int J Methods Psychiatr Res. 2004;13:208–220. [DOI] [PMC free article] [PubMed] [Google Scholar]
- 45.Heeringa SF, Wager J, Torres M, Duan N, Adams T, Berglund P. Sample designs and sampling methods for the Collaborative Psychiatric Epidemiology Studies (CPES). Int J Methods Psychiatr Res. 2004;13: 221–240. [DOI] [PMC free article] [PubMed] [Google Scholar]
- 46.Pennell B, Bowers A, Carr D, et al. The development and implementation of the National Comorbidity Survey Replication, the National Survey of American Life, and the National Latino and Asian American Survey. Int J Methods Psychiatr Res. 2004;13:241–269. [DOI] [PMC free article] [PubMed] [Google Scholar]
- 47.Alegría M, Vila D, Woo M, et al. Cultural relevance and equivalence in the NLAAS instrument: integrating etic and emic in the development of cross-cultural measures for a psychiatric epidemiology and services study of Latinos. Int J Methods Psychiatr Res. 2004;13:270–288. [DOI] [PMC free article] [PubMed] [Google Scholar]
- 48.Centers for Disease Control and Prevention. Indicators for chronic disease surveillance. MMWR. 2004; 53(RR-11):19–32. [Google Scholar]
- 49.Williams DR, Yu Y, Jackson JS. Racial differences in physical and mental health. J Health Psychol. 1997;2: 335–351. [DOI] [PubMed] [Google Scholar]
- 50.Vega WA, Zimmerman R, Gil AG, Warheit G, Apospori E. Acculturative strain theory: its application in explaining drug use behavior among Cuban and non-Cuba Hispanic youth. In: De La Rosa M, ed. Drug Abuse Among Minority Youth: Advances in Research and Methodology. Rockville, Md: National Institute of Drug Abuse; 1993:144–166. [PubMed]
- 51.Schulz A, Gravlee CC, Williams DR, Israel BA, Mentz G, Rowe Z. Discrimination, symptoms of depression, and self-related health among African American women in Detroit: results from a longitudinal analysis. Am J Public Health. 2006;96:1265–1270. [DOI] [PMC free article] [PubMed] [Google Scholar]
- 52.Kessler RC, Barker PR, Colpe LJ, et al. Screening for serious mental illness in the general population. Arch Gen Psychiatry. 2003;60:184–189. [DOI] [PubMed] [Google Scholar]
- 53.US Census Bureau. Poverty 2000. Available at: http://www.census.gov/hhes/poverty/threshld/thresh00.html. Accessed May 18, 2005.
- 54.National Center for Health Statistics. Health, United States, 1998 With Socioeconomic and Health Chartbook. Hyattsville, Md; National Center for Health Statistics; 1998.
- 55.Felix-Ortiz M, Newcomb MD, Myers H. A multidimensional measure of cultural identity for Latino and Latina adolescents. Hisp J Behav Sci. 1994;16:99–115. [Google Scholar]
- 56.Marlowe D, Crowne DP. Social desirability and response to perceived situational demands. J Consul Psychol. 1961;25:109–115. [DOI] [PubMed] [Google Scholar]
- 57.Roth PL. Missing data: a conceptual review for applied psychology. Pers Psychol. 1994;47: 537–560. [Google Scholar]
- 58.RTI International. SUDAAN Language Manual, Release 9.0.0. Research Triangle Park, NC: 2004.
- 59.Meyer IH. Prejudice, social stress, and mental health in lesbian, gay, and bisexual populations: Conceptual issues and research evidence. Psychol Bull. 2003;129:674–697. [DOI] [PMC free article] [PubMed] [Google Scholar]
- 60.Contrada RJ, Ashmore RD, Gary ML, et al. Measures of ethnicity-related stress: psychometric properties, ethnic group differences, and associations with well-being. J App Soc Psychol. 2001;31:1775–1820. [Google Scholar]
- 61.Lawrence D, Graber JE, Mills SL, Meissner HI, Warnecke R. Smoking cessation interventions in US racial/ethnic minority populations: an assessment of the literature. Prev Med. 2003;36:204–216. [DOI] [PubMed] [Google Scholar]
- 62.Chen MS. The status of tobacco cessation research for Asian Americans and Pacific Islanders. Asian Am Pac Isl J Health. 2001;9:61–65. [PubMed] [Google Scholar]
- 63.Asian Pacific Partners for Empowerment and Leadership. A policy framework for preventing and reducing tobacco use in the Asian American and Pacific Islander community: executive summary. 2002. Available at: http://www.aapcho.com/links/PolicyGuideExecutiveSummary.pdf. Accessed November 30, 2006.
- 64.Asian Pacific Partners for Empowerment and Leadership. Enhancing cultural and community competence for tobacco control for Asian Americans and Pacific Islanders. 2003. Available at: http://www.aapcho.com/links/CulturalCompetenceKit.pdf. Accessed November 30, 2006.