

Abstract
Objectives. We examined whether stress related to negative body image perception and the desire to lose weight explained some of the body mass index–health gradient.
Methods. We used 2003 Behavioral Risk Factor Surveillance System data to examine the impact of desired body weight, independent of actual body mass index, on the amount of physically and mentally unhealthy days by race, ethnicity, and gender.
Results. The difference between actual and desired body weight was a stronger predictor than was body mass index (BMI) of mental and physical health. When we controlled for BMI and age, men who wished to lose 1%, 10%, and 20% of their body weight respectively suffered a net increase of 0.1, 0.9, and 2.7 unhealthy days per month relative to those who were happy with their weight. For women, the corresponding numbers were 0.1, 1.6, and 4.3 unhealthy days per month. The desire to lose weight was more predictive of unhealthy days among women than among men and among Whites than among Blacks or Hispanics.
Conclusions. Our results raise the possibility that some of the health effects of the obesity epidemic are related to the way we see our bodies.
Obesity is one of the greatest public health threats. Over 7 million quality-adjusted life years are lost annually as a result of excess body weight in the United States alone.1 Projections suggest that the rapid rise in obesity will eventually lead to a decline in life expectancy in the United States.2
To address this problem, scientists and policymakers need a clear understanding of the underlying pathophysiological mechanisms that link overweight and obesity to poor health. Much needs to be learned. It is assumed that body fat itself causes the higher rates of hypertension, dyslipidemia, and metabolic syndrome seen among obese persons.3 However, there is little evidence that this assumption is correct, leading some scientists to challenge the adiposity (body fat) hypothesis.4 Even those linkages between adiposity and the metabolic syndrome—one of the most studied pathways—are imperfectly understood.5
One plausible explanation is that the stigma overweight persons face6,7 produces stress, a risk factor for hypertension, diabetes, and dyslipidemia.8 There is evidence that discrimination against heavy people is pervasive, occurring in social settings, the workplace, and the home.7,9 It is also severe; in one study, 89% of formerly obese participants reported that they would choose blindness over a return to being obese.10 These stigma are likely internalized, leading to a negative body image that also may serve as a source of chronic stress.
There are several reasons to suspect that obesity-related stress affects physical health. First, the conditions associated with the stress response—hypertension, heart disease, type 2 diabetes, and hypercholesterolemia—are the very conditions associated with overweight and obesity.8
Second, body mass index (BMI; weight in kilograms divided by height in meters squared) consistently emerges as an explanatory variable in studies that focus on the association between stress and health.11–14 For instance, BMI is the strongest known predictor of some serological markers of stress, such as C-reactive protein and fibrinogen, 2 mediators of the stress response.14,15 These biomarkers, or “stress mediators,” play a central role in glucose metabolism (both in production and cellular uptake via insulin), blood pressure regulation, and lipid regulation.
Third, there is evidence that the BMI–health association is culturally produced. Younger persons, Whites, and women are disproportionately affected by negative body image concerns, and these groups unduly suffer from BMI-associated morbidity and mortality.1,16–18 For instance, overweight women lose 7 times more quality-adjusted life years than do overweight men. Likewise, whereas Whites begin to experience excess mortality with a BMI of greater than 25 kg/m2 (overweight), Blacks do not suffer a net excess mortality unless they are obese (i.e., > 30 kg/m2).16
There is a large body of evidence that indicates that social stress adversely affects mental health as well.19 Although genetic vulnerability and coping mechanisms are important components in the pathway from stress to mental distress, environmental stressors appear to play a large role. Numerous researchers have examined a variety of social stressors including discrimination, stigma, and low socioeconomic status.20–22 These stressors have, in turn, been linked to poor mental health outcomes including depression, anxiety, alcohol or substance abuse, and personality disorders. There also is preliminary evidence that indicates that overweight and obese women suffer from higher rates of depression than do normal-weight women and that social stress may be a contributing factor.23,24
If social stress caused by being overweight is an additional contributor to the increased prevalence of mental and physical illness among heavier persons relative to thinner persons, we would expect that body image perceptions, after we controlled for actual BMI, would be a predictor of mental and physical health.
In this study, we constructed a variable for body image perceptions that was operationalized as the percentage discrepancy between actual weight and perceived ideal weight. Higher discrepancies between actual and ideal weight were hypothesized to be associated with poorer mental health or physical health, independent of actual BMI. Because of differences in subcultural norms regarding weight, we stratified the analyses by gender, race, and ethnicity. We hypothesized that this discrepancy between perceived ideal weight and actual weight would be predictive of both poor mental health and poor physical health outcomes and that these effects would be most prominent among women and non-Hispanic Whites.
METHODS
We conducted a secondary analysis of the 2003 Behavioral Risk Factor Surveillance System (BRFSS) data set. This study used a random-digit-dialing system to survey participants and employed a multistage cluster design.25 The BRFSS sample is representative of noninstitutionalized adults (18 years and older) in the United States. In our analyses, to reduce the likelihood of sampling participants with anorexia nervosa, we excluded participants with a BMI of less than 23 kg/m2. We also excluded participants who wished to gain weight, because they were out of the scope of the research question. The 2003 BRFSS sample included 247027 participants who answered the question, “How much would you like to weigh?” Of these, 60588 participants had a BMI of less than 23 kg/m2 and 15862 wished to gain weight, which left a total of 170 577 participants in the final analysis. The demographic characteristics of the original sample of 247027 participants are presented in Table 1 ▶.
TABLE 1—
Comparison of Descriptive Statistics Among US Adults, by Weight Status: Behavioral Risk Factor Surveillance System, 2003
| Wanted to Gain Weight | Happy With Weight | Wanted to Lose Weight | |
| Number of participants | 15 862 | 65 353 | 165 812 |
| Percentage of total | 8.2 | 25.7 | 66.2 |
| Age, y, % | |||
| 18–44 | 11.0 | 25.7 | 63.3 |
| 45–64 | 4.2 | 21.5 | 74.3 |
| ≥ 65 | 6.9 | 33.2 | 59.8 |
| Gender, % | |||
| Men | 11.9 | 30.4 | 57.7 |
| Women | 4.6 | 21.1 | 74.4 |
| Race/ethnicity, % | |||
| Non-Hispanic White | 6.6 | 25.9 | 67.5 |
| Non-Hispanic Black | 14.3 | 24.2 | 61.5 |
| Hispanic | 10.2 | 23.7 | 66.1 |
| Asian/Pacific Islander | 13.1 | 27.2 | 59.7 |
| American Indian/Alaska Native | 11.6 | 26.8 | 61.6 |
| Other | 13.5 | 32.0 | 54.6 |
| Education, % | |||
| No high school diploma or GED | 13.0 | 28.7 | 58.3 |
| High school diploma or GED | 9.5 | 26.0 | 64.6 |
| Postsecondary degree | 6.5 | 24.8 | 68.7 |
| BMI, kg/m2, % | |||
| < 20.0 | 38.2 | 49.1 | 12.6 |
| 20.0–24.9 | 13.5 | 41.3 | 45.2 |
| 25–29.9 | 3.2 | 20.5 | 76.3 |
| ≥ 30.0 | 0.6 | 4.8 | 94.5 |
| Unhealthy days, mean no. | 7.6 | 4.9 | 6.3 |
| Physically unhealthy days | 4.4 | 3.0 | 3.7 |
| Mentally unhealthy days | 4.5 | 2.6 | 3.6 |
Notes. GED = general educational development degree; BMI = body mass index. Overweight was defined as a BMI of 25.0–29.9 kg/m2 obese was ≥ 30 kg/m2 All values in the table are significant across desired weight categories and within groups at P < .001.
Statistical Analyses
Outcomes of interest included the number of physical unhealthy days in the previous month, measured by asking, “Now thinking about your physical health, which includes physical illness and injury, for how many days during the past 30 days was your physical health not good?”, and the number of mentally unhealthy days in the previous month, measured by asking, “Now thinking about your mental health, which includes stress, depression, and problems with emotions, for how many days during the past 30 days was your mental health not good?” Total unhealthy days is the sum of mentally and physically unhealthy days. The main predictor variable of interest, the difference between actual body weight and the body weight perceived by the participant to be ideal (referred to as percentage of desired weight loss), was calculated as
 |
(1) |
where kg is the self-reported actual weight and D is the self-reported response to the question “How much would you like to weigh?”
We estimated mean physically and mentally unhealthy days with regression models. A separate model was built for men, women, non-Hispanic Whites, non-Hispanic Blacks, and Hispanics. We also built separate models by outcome measure (physically unhealthy days and mentally unhealthy days). All models included age grouped in 5-year intervals and entered as age and age squared within each interval to improve model fit, BMI as a categorical variable (normal weight was 23.0–24.9 kg/m2; overweight was 25.0–29.9 kg/m2; and obese was ≥ 30.0 kg/m2), and percentage of desired weight loss, which also was entered as a quadratically transformed variable for better fit.
In the first model, we examined age, BMI, and percentage of desired weight loss. The second model added several covariates.
The basic model assumed the form
 |
(2) |
where U is unhealthy days (either physically or mentally); age is the participant’s age in years; BMI is body mass index; PD is percentage difference in participant’s actual weight and desired weight; C is covariates (i.e., educational attainment, dieting to lose weight, exercising to lose weight, current smoker); and e is error. (Descriptions of the models can be found alongside tables and analyses in an appendix available as a supplement to the online version of this article at http://www.ajph.org.)
RESULTS
Approximately 66% of the US adults wanted to lose weight, and about 26% of the population were happy with their current weight (Table 1 ▶). Approximately 74% of women and 58% of men wished to lose weight. Non-Hispanic Whites were more likely than were any other group to want to lose weight. However, a majority of all races and ethnicities reported wanting to lose weight.
With respect to BMI, 41% of normal-weight people, 20% of overweight people, and 5% of obese people were happy with their weight. Older persons were also more likely to be happy with their weight than were younger persons. Despite their higher mean age, persons who were happy with their weight experienced fewer physically unhealthy days (3.0 vs 3.7) and mentally unhealthy days (2.6 vs 3.6) compared with persons unhappy with their weight.
Regression Analyses
The number of unhealthy days increased as participants became increasingly dissatisfied with their weight (Figure 1 ▶). When we controlled for age, BMI, and percentage of desired weight loss, the relationship between percentage of desired weight loss and number of unhealthy days (both types) was closer to linear for men than for women. Men experienced fewer unhealthy days at any value of percentage of desired weight loss than did women. When we controlled for BMI and age, men who wished to lose 1%, 10%, and 20% of their body weight suffered a net increase of 0.1, 0.9, and 2.7 total unhealthy days per month, respectively, relative to those who did not wish to lose weight (Figure 1 ▶). For women, the corresponding numbers were 0.1, 1.6, and 4.3 total unhealthy days per month.
FIGURE 1—
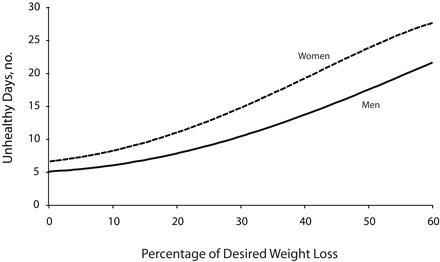
The relationship between the percentage of desire weights loss and total unhealthy days per month among US adults by gender: Behavioral Risk Factor Surveillance System, 2003.
Note. Percentage of desired weight loss was the difference between actual body weight and the body weight perceived by the participant to be ideal. At values greater than zero, women had more unhealthy days and the slope of the curve increased more sharply than for men. The formula used to calculate percentage of desired weight loss is in the “Methods” section.
There was a positive relationship between percentage of desired weight loss and the number of physically as well as mentally unhealthy days, both before and after we controlled for age and BMI (data available as a supplement to the online version of this article at http://www.ajph.org). In all models, percentage of desired weight loss was a stronger predictor than was BMI of mentally and physically unhealthy days. For instance, percentage of desired weight loss explained 10 times the variability in physically unhealthy days as did BMI for non-Hispanic White women in model 1, and in many models, the explanatory power of BMI disappeared completely when percentage of desired weight loss was added.
In terms of subgroup analyses, the relationship between percentage of desired weight loss and number of unhealthy days varied by gender, race, ethnicity, and type of unhealthy day measured (mentally vs physically). After age and BMI were held constant, the relationship between percentage of desired weight loss and physically unhealthy days was statistically significant (P<.05) among non-Hispanic Whites of both genders and non-Hispanic Black women (Table 2 ▶), but not among the other subgroups. With respect to mentally unhealthy days, this relation was significant only for non-Hispanic Whites of both genders. However, analyses for most racial/ethnic groups other than the non-Hispanic Whites were only adequately powered to detect a moderate change in unhealthy days.
TABLE 2—
Mean Number (Standard Error) of Physically and Mentally Unhealthy Days During the Month Prior to the Interview Among US Adults by Desire to Lose Weight: Behavioral Risk Factor Surveillance System, 2003
| Mentally Unhealthy Days | Physically Unhealthy Days | |||
| Men | Women | Men | Women | |
| Model 1 | ||||
| Non-Hispanic White, percentage desired weight lossa | ||||
| 1% | 0.1 (0.0) | 0.1 (0.0) | 0.1 (0.0) | 0.0 (0.0) |
| 20% | 3.0 (0.5) | 1.6 (0.6) | 2.5 (0.5) | 1.4 (0.6) |
| 50% | 7.5 (1.3) | 5.8 (2.3) | 6.3 (1.2) | 6.4 (2.1) |
| Non-Hispanic Black, percentage desired weight lossa | ||||
| 1% | NS | NS | NS | 0.0 (0.0) |
| 20% | NS | NS | NS | 0.7 (0.4) |
| 50% | NS | NS | NS | 4.6 (2.2) |
| Model 2 | ||||
| Non-Hispanic White, percentage desired weight lossa | ||||
| 1% | 0.1 (0.0) | 0.0 (0.0) | 0.0 (0.0) | 0.0 (0.0) |
| 20% | 2.5 (0.5) | 0.6 (1.8) | 0.8 (0.2) | 0.7 (0.3) |
| 50% | 6.4 (1.3) | 3.5 (1.1) | 5.2 (1.1) | 4.5 (2.2) |
Notes. BMI = body mass index; NS = not significant. Only groups for which the association between percentage of desired weight loss and physically or mentally unhealthy days was statistically significant (P < .05) are shown. None of the between-group differences were significantly different. Model 1 (n = 137 132) was controlled for age and BMI. Model 2 (n = 136 734) was controlled for age, BMI, education, and smoking.
aPercentage of desired weight loss was calculated as [(actual weight – desired weight)/actual weight] ×100%.
Table 2 ▶ shows that non-Hispanic White men and women who wished to lose 1% of their weight suffered 0.1 mentally unhealthy days per month beyond that suffered by those with no desire to lose weight. Among those who wished to lose 50% of their weight, however, non-Hispanic White men suffered approximately 8 excess mentally unhealthy days per month, and non-Hispanic White women suffered approximately 6 excess mentally unhealthy days per month (differences between groups were nonsignificant at the P<.05 level).
As we saw with regard to mentally unhealthy days, persons who wished to lose 1% of their weight (relative to persons who did not want to lose any weight) suffered few additional physically unhealthy days per month. However, non-Hispanic White men and women who wished to lose half of their weight each suffered approximately 6 excess physically unhealthy days per month. Likewise, non-Hispanic Black women who wished to lose half of their weight suffered about 5 additional physically unhealthy days per month. (Note that these are relative terms. Thus, although men always suffered fewer physically and mentally unhealthy days than did women across the range of percentage of desired weight loss values in Figure 1 ▶, differences in percentage of desired weight loss were similar for women and men at lower values of percentage of desired weight loss.)
When age, BMI, education, and smoking were all included in the model, the relationship between percentage of desired weight loss and the number of unhealthy days was maintained (Table 2 ▶). However, the effect sizes were moderated somewhat relative to models that contained age and BMI alone. Among non-Hispanic White men, the effect of percentage of desired weight loss on the number of physically unhealthy days became significantly more curvilinear after these covariates were added to the model.
Of all covariates, education was perhaps the most strongly predictive of having more unhealthy days. This was true despite the positive association between percentage of desired weight loss and education (Table 1 ▶). Among non-Hispanic White men, a college degree produced a reduction in the amount of physically unhealthy days that was roughly equivalent to the fulfillment of a wish for a 30% reduction in weight. Self-reported dieting was negatively associated with physically unhealthy days in all models, and exercise was positively associated with physically unhealthy days in all models, possibly because of exercise-induced injuries. There was no significant association between these variables and mentally unhealthy days.
DISCUSSION
As we hypothesized, the desire to lose weight appears to be a powerful independent predictor of psychological and biological health. In addition, these morbidity patterns varied in manners consistent with subcultural body image norms among non-Hispanic Whites, non-Hispanic Blacks, Hispanics, men, and women.18 Specifically, women were affected more than men, and non-Hispanic Whites more than other racial/ethnic groups. Our findings are consistent with those of other studies that have examined morbidity and mortality by BMI across different social groups.1,16
In short, our findings added support to our hypothesis that psychological stress associated with a negative body image explains some of the morbidity commonly associated with being obese. Our finding that percentage of desired weight loss was a much stronger predictor of unhealthy days than was BMI further suggests that percentage of desired weight loss plays a greater role in generating disease than adiposity itself. Our study builds on a growing literature demonstrating that perceptions of one’s social acceptability and desirability can lead to health or disease whether this perception stems from being discriminated against, being poor, or being overweight.26,27
One notable effect was that the relationship between percentage of desired weight loss and physically unhealthy days was more curvilinear among women than among men after age and BMI were held constant (Figure 1 ▶). Among men, negative body perceptions might be checked by social norms that suggest that social or intellectual accomplishments are more important than physique.28 Among women, whose social norms tend to emphasize the importance of physique, distorted notions of the “ideal” self may lead to a greater stress response. However, the difference between non-Hispanic White men and women in the amount of physically or mentally unhealthy days by percentage of desired weight loss was not statistically significant.
Limitations
Our study was subject to a number of limitations. Foremost, the physically unhealthy days models were potentially subject to identifiable endogeneity. Namely, the very conditions associated with discrimination or low socioeconomic position—hypertension, hypercholesterolemia, diabetes, and so on—were the same conditions associated with obesity.29 Moreover, any person who was diagnosed with these conditions would likely wish to lose weight and would, as a result of the condition, have more physically unhealthy days.
We tested this possible confounding in a number of ways (each of these analyses is available in the appendix available as a supplement to the online version of this article at http://www.ajph.org). First, we excluded participants who had been advised by a doctor to lose weight. This had no effect on the overall analysis (with some coefficients slightly stronger and some slightly weaker). Second, we entered self-reported diagnoses of diabetes and hypertension as covariates in the model. This produced a modest tempering effect on coefficient size. Finally, we repeated the regressions with hypertension and diabetes as dependent variables rather than physically or mentally unhealthy days. Here, as before, we saw that percentage of desired weight loss was more predictive of each of these outcome measures than was BMI. None of these subanalyses changed the rank order of percentage of desired weight loss effects by gender, race, or ethnicity. In sum, these sub-analyses supported the (logical) contention that the observed effects were bidirectional.
Another limitation surrounded difficulties related to model specification. Our study utilized 2 linear models. The first examined the effects of age, percentage of desired weight loss, and BMI on amount of mentally and physically unhealthy days. The second examined the same variables but also included educational attainment and smoking as additional covariates. It is unclear whether the additional covariates in the second model may have enhanced or possibly biased the results. For example, overweight and obese people are more likely to smoke and less likely to achieve a high degree of educational attainment than are normal-weight persons. If smoking and lower educational attainment are consequences of obesity,6 controlling for them potentially biases the model. However, if genetic factors simultaneously predispose some persons to obesity, lower educational attainment, and smoking, it would be appropriate to control for these factors.30 Including and excluding these covariates should therefore provide a range of values associated with the social effects of body image, some of which also are linked to health outcomes. Regardless, adding these covariates produced only a modest moderating effect on the models overall.
Our analysis was also subject to biases associated with self-reporting. Recall bias may have affected the number of unhealthy days reported over the past month. However, because participants were less likely to remember minor illnesses that were resolved more than a week before the interview, this would likely have served to bias the effect size downward.
Another source of bias associated with self-report data of height and weight was that women tend to underreport their weight and men tend to overreport their height.31,32 These sources of bias more or less cancel each other out in comparisons by gender and caused a systematic underestimation of the effect sizes in our study.
Finally, our findings for racial/ethnic groups other than the non-Hispanic Whites were of limited statistical power, and many of these analyses were borderline significant. In most cases, these models only had the statistical power to detect a difference of more than roughly 1 unhealthy day per month for a 10% change in percentage of desired weight loss, which is less than that seen in non-Hispanic White men, but is nonetheless certainly clinically significant.
These limitations, particularly those pertaining to third-variable effects, must be weighed against other evidence that supports our hypothesis. Previous studies have shown that overweight adversely affects the health and longevity of women but produces a positive or neutral effect on men.1 When obesity is considered, men catch up with women with respect to morbidity (as measured by the health-related quality of life) and mortality. We similarly found that women were more affected (with effects in men possibly occurring in a subset of the population), but that percentage of desired weight loss provides the most explanatory power for all groups.
Conclusions
If our findings are correct, the policy implications may be counterintuitive. Foremost, if more of the association between BMI and poor health is perceptual, some public health messages that advocate idealized body types may be harming their target audience. Concerted efforts to disassociate health messages, such as encouragement of exercise, from obesity stigmatization may circumvent the paradox.
Clearly, changes in procedure should be backed by a much stronger evidence base than what we offer here. One simple first step would be a small-area analysis of obesity and mortality patterns. These analyses are subject to ecological fallacy and have produced a great deal of controversy with respect to the study of the effects of income inequality on health.33 Nonetheless, such a study would be useful in ascertaining whether the overweight and obese feel more comfortable in areas of the country with a higher mean BMI and, thus, suffer less morbidity and mortality.
Our findings potentially have broad implications. First, our results may have broad implications for public health policy, health communications campaigns, and most importantly, bench research on the physiological effects of adiposity. Second, if our initial findings hold, our study will contribute to the debate over the psychophysiological effects of discrimination and inequality, such as perceived racism and lower socioeconomic position.27 Third, these findings may have implications beyond body fat, race, and socioeconomic status, extending to other aspects of physical attractiveness.34 Finally, our preliminary data suggest that some of the obesity epidemic may be attributable to social constructs that surround ideal body types, which may open a new area of scientific inquiry.
Acknowledgments
This study was funded by a Minority Research Fellowship grant from Columbia University.
Human Participant Protection This study used publicly available datasets and no institutional review board approval was required.
Peer Reviewed
Contributions P. Muennig originated the study, developed the article, and guided the statistical analyses. H. Jia conducted the statistical analyses. R. Lee and E. Lubetkin provided input on the direction of the study and contributed to article development.
References
- 1.Muennig P, Lubetkin E, Jia H, Franks P. Gender and the burden of disease attributable to obesity. Am J Public Health. 2006;96:1662–1668. [DOI] [PMC free article] [PubMed] [Google Scholar]
- 2.Olshansky SJ, Passaro DJ, Hershow RC, et al. A potential decline in life expectancy in the United States in the 21st century. N Engl J Med. 2005;352:1138–1145. [DOI] [PubMed] [Google Scholar]
- 3.Burton BT, Foster WR. Health implications of obesity: an NIH Consensus Development Conference. J Am Diet Assoc. 1985;85:1117–1121. [PubMed] [Google Scholar]
- 4.Campos P, Saguy A, Ernsberger P, Oliver E, Gaesser G. The epidemiology of overweight and obesity: public health crisis or moral panic? Int J Epidemiol. 2006;35:55–60. [DOI] [PubMed] [Google Scholar]
- 5.Zimmet PZ, McCarty DJ, de Courten MP. The global epidemiology of non-insulin-dependent diabetes mellitus and the metabolic syndrome. J Diabetes Complications. 1997;11:60–68. [DOI] [PubMed] [Google Scholar]
- 6.Gortmaker SL, Must A, Perrin JM, Sobol AM, Dietz WH. Social and economic consequences of overweight in adolescence and young adulthood. N Engl J Med. 1993;329:1008–1012. [DOI] [PubMed] [Google Scholar]
- 7.Puhl R, Brownell KD. Bias, discrimination, and obesity. Obes Res. 1991;9:788–805. [DOI] [PubMed] [Google Scholar]
- 8.McEwen BS. Protective and damaging effects of stress mediators. N Engl J Med. 1998;338:171–179. [DOI] [PubMed] [Google Scholar]
- 9.Falkner NH, French SA, Jeffery RW, Neumark-Sztainer D, Sherwood NE, Morton N. Mistreatment due to weight: prevalence and sources of perceived mistreatment in women and men. Obes Res. 1999;7:572–576. [DOI] [PubMed] [Google Scholar]
- 10.Rand CS, Macgregor AM. Successful weight loss following obesity surgery and the perceived liability of morbid obesity. Int J Obes. 1991;15:577–579. [PubMed] [Google Scholar]
- 11.Cohen S, Doyle WJ, Skoner DP. Psychological stress, cytokine production, and severity of upper respiratory illness. Psychosom Med. 1999;61:175–180. [DOI] [PubMed] [Google Scholar]
- 12.Epel ES, Blackburn EH, Lin J, et al. Accelerated telomere shortening in response to life stress. Proc Natl Acad Sci U S A. 2004;101:17312–17315. [DOI] [PMC free article] [PubMed] [Google Scholar]
- 13.Owen N, Poulton T, Hay FC, Mohamed-Ali V, Steptoe A. Socioeconomic status, C-reactive protein, immune factors, and responses to acute mental stress. Brain Behav Immun. 2003;17:286–295. [DOI] [PubMed] [Google Scholar]
- 14.Muennig P, Sohler N, Mahato B. Socioeconomic status as an independent predictor of physiological biomarkers of cardiovascular disease: evidence from NHANES. Prev Med. 2007;45:35–40. [DOI] [PubMed] [Google Scholar]
- 15.Alley DE, Seeman TE, Ki Kim J, Karlamangla A, Hu P, Crimmins EM. Socioeconomic status and C-reactive protein levels in the US population: NHANES IV. Brain Behav Immun. 2006;20:498–504. [DOI] [PubMed] [Google Scholar]
- 16.Fontaine KR, Redden DT, Wang C, Westfall AO, Allison DB. Years of life lost due to obesity. JAMA. 2003;289:187–193. [DOI] [PubMed] [Google Scholar]
- 17.Paeratakul S, White MA, Williamson DA, Ryan DH, Bray GA. Sex, race/ethnicity, socioeconomic status, and BMI in relation to self-perception of overweight. Obes Res. 2002;10:345–350. [DOI] [PubMed] [Google Scholar]
- 18.Cash TF, Phillips KA, Santos MT, Hrabosky JI. Measuring “negative body image”: validation of the Body Image Disturbance Questionnaire in a nonclinical population. Body Image. 2004;1:363–372.17075607 [Google Scholar]
- 19.Dohrenwend BP. The role of adversity and stress in psychopathology: some evidence and its implications for theory and research. J Health Soc Behav. 2000;41:1–19. [PubMed] [Google Scholar]
- 20.Jackson JS, Brown TN, Williams DR, Torres M, Sellers SL, Brown K. Racism and the physical and mental health status of African Americans: a thirteen year national panel study. Ethn Dis. 1996;6:132–147. [PubMed] [Google Scholar]
- 21.Banks KH, Kohn-Wood LP, Spencer M. An examination of the African American experience of everyday discrimination and symptoms of psychological distress. Community Ment Health J. 2006;42:555–570. [DOI] [PubMed] [Google Scholar]
- 22.Ren XS, Amick BC, Williams DR. Racial/ethnic disparities in health: the interplay between discrimination and socioeconomic status. Ethn Dis. 1999;9:151–165. [PubMed] [Google Scholar]
- 23.Palinkas LA, Wingard DL, Barrett-Connor E. Depressive symptoms in overweight and obese older adults: a test of the “jolly fat” hypothesis. J Psychosom Res. 1996;40:59–66. [DOI] [PubMed] [Google Scholar]
- 24.Stunkard AJ, Faith MS, Allison KC. Depression and obesity. Biol Psychiatry. 2003;54:330–337. [DOI] [PubMed] [Google Scholar]
- 25.Centers for Disease Control and Prevention. Behavioral Risk Factor Surveillance System. Available at: http://www.cdc.gov/brfss. Accessed January 25, 2007.
- 26.Adler NE, Ostrove JM. Socioeconomic status and health: what we know and what we don’t. Ann N Y Acad Sci. 1999;896:3–15. [DOI] [PubMed] [Google Scholar]
- 27.Williams DR. Race, socioeconomic status, and health. The added effects of racism and discrimination. Ann N Y Acad Sci. 1999;896:173–188. [DOI] [PubMed] [Google Scholar]
- 28.Cash TF, Santos MT, Williams EF. Coping with body-image threats and challenges: validation of the Body Image Coping Strategies Inventory. J Psychosom Res. 2005;58:190–199. [DOI] [PubMed] [Google Scholar]
- 29.Wong MD, Shapiro MF, Boscardin WJ, Ettner SL. Contribution of major diseases to disparities in mortality. N Engl J Med. 2002;347:1585–1592. [DOI] [PubMed] [Google Scholar]
- 30.Ding W, Lehrer SF, Rosenquist JN, Audrain-McGovern J. The Impact of Poor Health on Education: New Evidence Using Genetic Markers. National Bureau of Economic Research working paper 12304; 2006. Available at: http://www.nber.org/papers/w12304. Accessed May 31, 2007.
- 31.Palta M, Prineas RJ, Berman R, Hannan P. Comparison of self-reported and measured height and weight. Am J Epidemiol. 1982;115:223–230. [DOI] [PubMed] [Google Scholar]
- 32.Strauss RS. Comparison of measured and self-reported weight and height in a cross-sectional sample of young adolescents. Int J Obes Relat Metab Disord. 1999;23:904–908. [DOI] [PubMed] [Google Scholar]
- 33.Lynch J, Smith GD, Harper S, et al. Is income inequality a determinant of population health? Part 1. A systematic review. Milbank Q. 2004;82:5–99. [DOI] [PMC free article] [PubMed] [Google Scholar]
- 34.Smith GD, Shipley MJ, Rose G. Magnitude and causes of socioeconomic differentials in mortality: further evidence from the Whitehall Study. J Epidemiol Community Health. 1990;44:265–270. [DOI] [PMC free article] [PubMed] [Google Scholar]