

Abstract
Mortality rates for American Indians (including Alaska Natives) declined for much of the 20th century, but data published by the Indian Health Service indicate that since the mid-1980s, age-adjusted deaths for this population have increased both in absolute terms and compared with rates for the White American population.
This increase appears to be primarily because of the direct and indirect effects of type 2 diabetes. Despite increasing appropriations for the Special Diabetes Program for Indians, per capita expenditures for Indian health, including third-party reimbursements, remain substantially lower than those for other Americans and, when adjusted for inflation, have been essentially unchanged since the early 1990s.
I argue that inadequate funding for health services has contributed significantly to the increased death rate.
OVER THE PAST CENTURY, mortality among American Indians (including Alaska Natives) declined roughly in parallel with that of the rest of the US population, although rates continue to be higher than for White Americans. The decline, which persisted for most of the 20th century despite the vicissitudes of federal policies, practices, and appropriations, is an example of the epidemiological transition from a regime characterized by infectious diseases to one characterized by noninfectious, chronic diseases.1 It is generally assumed that in advanced economies this progression is more or less inevitable; infectious diseases recede and are replaced in relative importance by noninfectious diseases, but total mortality continues to fall.
The collapse of the Soviet Union and the catastrophic reversal of declining mortality in its former republics and elsewhere in Eastern Europe show that such progress is not inevitable.2 There are other cases of reversal or, at the very least, stagnation of declining mortality in advanced economies. For example, the life expectancy of Aboriginal Australians has been largely stagnant for several decades,3 and recent changes in the mortality rates of American Indians indicate something similar.
I use published data to examine recent changes in age-adjusted mortality of American Indians in general and of Navajos in particular. Navajo data are included for several reasons: (1) the Navajos, as the largest tribe living on a reservation in the United States, have an important impact on overall rates; (2) during the period under consideration, Navajo health services were provided by the Indian Health Service (IHS) and not by tribally managed programs; and (3) historical data on Navajo health services and mortality are more readily available than for other, smaller American Indian populations.
Causes of death are classified as either amenable or not amenable to interventions by the health care system. This classification is usually traced to the work of David Rutstein et al. in the mid-1970s.4 As Holland has said,
Here medical care is defined in its broadest sense, that is prevention, cure and care, including the application of all relevant medical knowledge, the services of all medical and allied personnel, the resources of governmental, voluntary, and social agencies, and the co-operation of the individual himself. An excessive number of such unnecessary events serves as a warning signal of possible shortcomings in the health care system, and should be investigated further.5(p1)
Avoidable deaths, which are described in more detail in the following section, may thus arise for a variety of reasons, including unusual genetic and epidemiological characteristics of particular populations, inadequate funding, inaccessible services or populations, incompetent staff, uninformed populations, and noncompliant patients. Although all of these factors may be contributory, the fact that some populations have higher rates than others is an indication that adequate health services responsive to the unique needs of particular populations may not be available.6
I briefly consider 2 other issues. The first has to do with the impact of devolution of responsibility for services to American Indian tribal governments or other entities. Self-determination in American Indian affairs has been federal policy since 1974, and some attempts have been made to examine the impact, if any, on health of changes in management.7 The second has to do with a question debated in public health since the early years of the 20th century: the degree to which programs should be vertical or horizontal. The former refers to programs aimed at the eradication or control of a particular disease. The latter refers to programs covering a broad range of services.8–11
METHODS
Data for my analyses of time trends in American Indian mortality from the early 1970s through the 1990s came from IHS publications.12,13 They included only deaths in the IHS service area, which comprises primarily states in the Midwest and West. Data for the Navajo Area of the IHS came from 2 different sources. Historical data, taken from previously published material,14 were for the population living on the Navajo Reservation. Data from the late 1990s and early 2000s, published by the Navajo Area IHS,15 refer to the service area, which comprises both the reservation and adjacent nonreservation lands where many Navajos live.
Because death data were available only for New Mexico and Arizona, only the populations of the service areas in those 2 states were used as the denominator for calculating rates. The number of Navajos living in the Utah portion of the service area is very small, and their exclusion did not significantly influence the results. The classifications of cause of death on the Navajo Reservation in 1972 through 1978 and in the Navajo service area in 1998 through 2002 were from different revisions of the International Classification of Diseases16,17 and thus may not be precisely comparable. Nonetheless, the codings of several of the most important causes of death, most notably diabetes, are similar enough to be useful for broad comparative purposes.
Causes of death amenable and not amenable to interventions by the health care system are the same as have been used elsewhere.18 The IHS does not publish death rates for all causes, nor are age data published for most causes. (The causes that are available for the analysis of deaths caused by conditions amenable to health care interventions can be found as a supplement to the online version of this article at http://www.ajph.org.13,19,20)
RESULTS
Mortality Trends Among American Indians
Figure 1 ▶ displays all-cause, age-adjusted (to the 1940 US population) death rates from 1973 through 1997 for American Indian and White Americans. Although rates for the former are higher than for the latter, they both declined during the first half of the period. Starting in the mid-1980s, however, they diverged as the rate for American Indians began to increase. At its nadir in 1986, the death rate for American Indians was 669.1 per 100 000. Over the next 10 years, it rose to 715.2 per 100 000, an increase of about 46 per 100 000. Over the same period, the rate for White Americans declined from 520.1 per 100 000 to 456.5 per 100 000 and has continued to decline in subsequent years.
FIGURE 1—
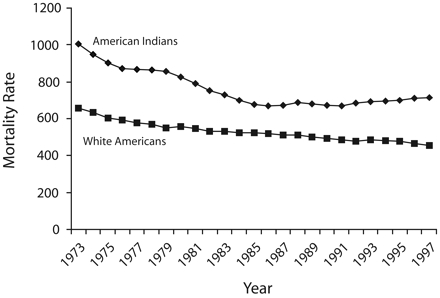
Mortality rates, per 100 000, by race, from all causes of mortality: American Indiansa and White Americans, 1973–1997.
Note. Mortality rates are age-adjusted to the 1940 US population. aIncludes Alaska Natives.
Figures 2 ▶ and 3 ▶ display age-adjusted death rates from 1973 through 1997 for causes amenable and not amenable to intervention by the health care system. Among the former causes, deaths from diabetes among American Indians increased most significantly, whereas deaths from heart disease and cerebrovascular diseases declined, but at lower rates than among White Americans—so much so, indeed, that over the 24-year period the relative positions of the death rates of American Indians and of White Americans reversed.
FIGURE 2—
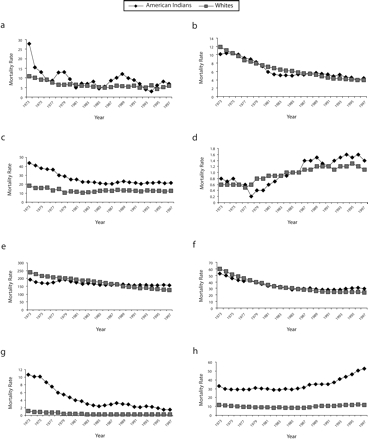
Mortality rates, per 100 000, by race, from maternal causes (a), neonatal causes (b), influenza and pneumonia (c), asthma (d), heart disease (e), cerebrovascular disease (f), tuberculosis (g), and diabetes (h): American Indiansa and White Americans, 1973–1997.
Note. Mortality rates are age-adjusted to the 1940 US population. These causes of mortality are amenable to intervention by the health care system. aIncludes Alaska Natives.
FIGURE 3—
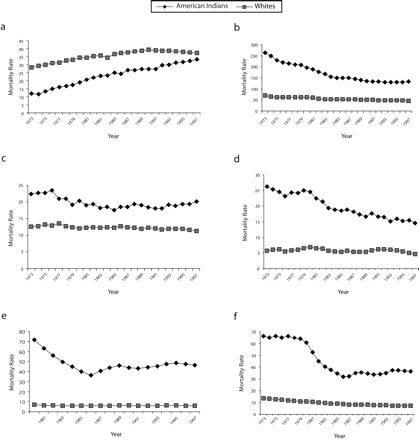
Mortality rates, per 100 000, by race, from lung cancer (a), unintentional injuries (b), suicide (c), homicide (d), alcohol-related causes (e), and chronic liver disease and cirrhosis (f): American Indiansa and White Americans, 1973–1997.
Note. Mortality are rates age-adjusted to the 1940 US population. These causes of mortality are not amenable to intervention by the health care system. Data for earlier years of alcohol-related causes were not available. aIncludes Alaska Natives.
The increased all-cause death rate of American Indians starting in the mid-1980s seems to have been partly the result of a stagnation in rates of decline of alcohol-related and cirrhosis deaths, and of deaths from pneumonia or influenza and tuberculosis, and an increase in rates of death from lung cancer and diabetes, the latter almost doubling from 29 per 100 000 to 53 per 100 000. Although there are insufficient data to explain the entire increase in all-cause mortality, it is clear that slightly more than half the increase (24 of 46 per 100 000) was directly caused by diabetes. Over the same 10-year period, deaths from lung cancer increased from 24 per 100 000 to 34 per 100 000, accounting for about 20% of the increase.
The Navajo Area
Per capita allocations of the IHS budget among service areas vary greatly; in 1993 they ranged from $575 per enumerated American Indian in the Oklahoma area to $1906 in Alaska.6 Among rural populations, the Navajo Area, which is located in Arizona, New Mexico, and a small strip of southern Utah, had one of the lowest allocations, whether measured per user of services ($608) or per enumerated American Indian in the service area ($ 717). At the time to which the following data apply, all services were provided directly by the IHS and not by the Navajo Nation, although 2 of the 8 service units have since come under the control of community boards.
Table 1 ▶ shows that the number of hospital beds per 1000 population has declined steadily over the past 70 years, as have occupancy rates, hospitalizations per 1000 population, and average length of stay.
TABLE 1—
Health Facilities and Utilization of Services in the Navajo Area of the Indian Health Service: 1933–2003
| Year | Hospital Beds, No. | Occupancy Rate, % | Average Beds/1000 Population | Hospitalizations/Length of Stay, d | 1000 Population | Outpatient Visits/Person |
| 1933 | 352 | 111.0a | … | … | … | … |
| 1940 | 564 | 50.0 | 11.3 | 20.5 | 182.8 | 1.1 |
| 1960 | … | … | … | … | … | 1.5–1.7 |
| 1966 | 547 | 83.6 | 5.2–5.9 | 8.9 | 158–181 | … |
| 1977/78 | 557 | 60.0 | 3.9 | 5.4 | 152.0 | 4.5 |
| 2003 | 351 | 43.3 | 1.5 | 3.3 | 72.5 | 5.1 |
Table 2 ▶ shows that since the 1970s, nursing staff has become more professionalized as registered nurses have replaced licensed practical nurses, but overall, the ratio of nursing staff to population has remained the same. Likewise, the ratio of public health nurses to population, considered separately, has remained almost unchanged. By contrast, the number of physicians per 10 000 population has almost doubled over the same period, from 8.3 to 15.5; this figure, although substantially less than the nationwide figure of 23.2 per 10 000,15(p41) is similar to those for Arizona (17.2 per 10 000) and New Mexico (16.8 per 10 000).21,22 At the same time, median household income increased substantially (Table 3 ▶). Although the rate of increase in income was greater on the Navajo Reservation than in the surrounding states in the 1990s, absolute income was still substantially less.
TABLE 2—
Medical Personnel at Health Facilities in the Navajo Area of the Indian Health Service: 1977 and 2003
| Year | Registered Nurses | Public Health Nurses | Licensed Practical Nurses | Total Nursing Staff | Physicians |
| 1977 | 16.9 | 2.81 | 10.8 | 30.5 | 8.3 |
| 2003 | 26.9 | 2.4 | 2.2 | 31.5 | 15.5 |
TABLE 3—
Median Family Income in Current and 1999 Dollars on the Navajo Reservation and in Neighboring States: 1969–1999
| Navajo Reservation | New Mexicoa | Arizonaa | ||||
| Year | Current $ | 1999 $ | Current $ | 1999 $ | Current $ | 1999 $ |
| 1969 | 3 084b | 12 083 | 7 096 | 27 803 | 8 199 | 32 125 |
| 1979 | … | … | 14 654 | 31 350 | 16 448 | 35 118 |
| 1989 | 10 958c | 14 296 | 24 087 | 31 425 | 27 540 | 35 930 |
| 1999 | 20 005d | 20 005 | 34 133 | 34 133 | 40 558 | 40 558 |
From the early 1970s to the years 1996 through 1998, life expectancy increased from 58.8 years for men and 71.8 years for women to 68 and 76.5 years for men and women, respectively.12,26 This reflects the continuing epidemiological transition experienced by the Navajos over the past century. Infectious diseases have declined and noninfectious conditions have increased, some in relative importance and others in absolute importance. Table 4 ▶ displays crude average annual death rates for the periods 1972 to 1978 and 1998 to 2002 for several different broadly defined causes. Among conditions considered not amenable to health service interventions, accidents declined, suicide increased, and homicide and cirrhosis remained essentially unchanged. Among conditions amenable to intervention by the health care system, tuberculosis, neonatal mortality, pneumonia, and influenza all declined, whereas death rates from heart and cerebrovascular disease and from diabetes increased.
TABLE 4—
Crude Average Annual Death Rates in the Navajo Area of the Indian Health Service: 1972–1978 and 1998–2002
| Death Rate per 100 000 | ||
| Cause | 1972–1978 | 1998–2002 |
| Accidents (motor vehicle accidents) | 213.0 (106.0) | 99.5–106.9 (63.6–68.4) |
| Homicide | 15.6 | 13.0–13.9 |
| Suicide | 8.3 | 16.4–17.6 |
| Neoplasms | 38.0 | 63.6–68.4 |
| Circulatory/cardiovascular disease | 72.8 | 108.0–116.1 |
| Tuberculosis | 6.8 | 1.7–1.8 |
| Diabetes | 10.1a | 28.6–30.7 |
| Infant mortality | 17.6 | 6.2 |
| Neonatal | 8.7 | 4.1 |
| Postneonatal | 8.9 | 2.1 |
| Cirrhosis/chronic liver disease | 18.1 | 18.4–19.8 |
| Pneumonia/influenza | 56.1a | 24.6–26.4 |
| Estimated population | 132 156 | 200 000–215 000 |
The epidemic of non–insulin-dependent diabetes among American Indians was relatively late in affecting the Navajos. Although prevalence seems to have begun to increase in the 1960s, it began to receive increasing attention only in the 1980s.27,28 It is widely agreed to be the consequence of increasing obesity and changing dietary and activity patterns,29–31 and it carries with it increased risk of morbidity and of mortality from cardiovascular diseases.28,32–34 Moreover, hypertension is also strongly associated with diabetes, but only about 50% of hypertensive individuals found in a community survey had been told by a physician that they had hypertension.35 About one third of diabetics in the same survey were unaware that they had diabetes, suggesting that both screening and prevention were not widely available.36
DISCUSSION
Although all the data I present have been published previously, most appeared in government publications, both federal and tribal, and are not widely known to the public health community. The data are important both in their own right, reflecting as they do a deterioration in the health of a small but significant population of Americans, and because they may foreshadow changes experienced more broadly in the United States, especially among the poor. Income has increased among American Indians in general37 and Navajos in particular, but mortality caused by several chronic conditions amenable to intervention by the health care system has increased. This is similar to what has occurred in many poor countries, in which the emergence of ischemic heart disease and other chronic conditions is now recognized as a widespread phenomenon.38 Such changes are usually attributed to changes in diet and exercise patterns attendant on the shift to relatively sedentary occupations and the increased availability of processed foods.
Avoidable Deaths
Important as changes in lifestyle are, however, health services have an important role to play in the prevention and treatment of these conditions. Health care systems in general, including the IHS, have been effective in reducing death rates from many conditions. Typically, these conditions have been primarily infectious diseases; however, the incidence and severity of stroke, hypertension,39,40 and ischemic heart disease41 in non–American Indian populations have also been affected by treatment. In addition, diabetics, who are at substantially increased risk of death from cardiovascular disease, also benefit from tight control of their diabetes, treatment of hypertension, and use of anticoagulants such as aspirin.42,43
Reduction of diabetes-related deaths is not simply a matter of primary prevention and changes in lifestyle. Compared with Whites, American Indians have higher rates of self-reported obesity, smoking, diabetes, and heart disease; spend less time in leisure-time physical activity; and have worse self-assessed health, even after adjustment for sociodemographic variables.44–46 Primordial prevention (the prevention of the underlying causes of risk factors) and primary prevention (the reduction of risk factors) are thus crucially important in this population. High death rates, however, cannot simply be accepted as the result of too many fast food restaurants and irresponsible or uninformed lifestyle choices and personal behavior. As the concept of amenable conditions suggests,
an excessive number of such unnecessary events serves as a warning signal of shortcomings in the health care system, and should be investigated further.5(p1)
Indeed, this has been recognized by both the IHS and the US Congress. A Special Diabetes Program for Indians was mandated in 1997 that has provided substantial and increasing funds for the prevention and treatment of diabetes: $30 million per year in 1997 through 2000, $100 million per year in 2001 through 2003, and $150 million per year since 2004.13,47 The results have been encouraging: among treated diabetics, such measures as average diastolic blood pressure and cholesterol, hemoglobin A1c, and triglyceride levels all declined from 1995 through 2001, although mortality rates from diabetes have not declined.48,49
Although these declines are statistically significant, their clinical and epidemiological significance is uncertain because (1) these measures are still high, and cardiovascular disease risk factors are more important for diabetics than for nondiabetics, and (2) some of the results may be shifted downward by lead-time bias, whereby more-thorough screening leads to more cases being detected at an earlier and milder stage. Nonetheless, the recognition of the magnitude of the problem presented by diabetes, and the attempt to intervene, is of great significance.
Unfortunately, even taking these new funds and third-party payments into account, per capita expenditures for American Indian health remain well below those for other citizens, and in constant dollars they have remained essentially flat for well over a decade.13 At the beginning and end of the 1990s, per capita expenditures for the IHS service population were about $1662; according to recent unpublished analyses by the IHS, they remain about the same (Cliff Wiggins, IHS, oral communication, February 27, 2007).
Horizontal and Vertical Programs
In this context, specially targeted funds such as the Special Diabetes Program for Indians are no doubt important and welcome, but they raise a question that has been debated in public health for much of the 20th century: the appropriateness of vertical as opposed to horizontal programs. The justification for vertically organized programs aimed at specific diseases has been that once diseases are eradicated or at least controlled, they no longer need to be a concern for the health care system.8 Smallpox is the best example. By contrast, horizontal programs are justified because they provide the full range of services and indeed may be necessary if vertical programs are to have a lasting effect.9
One may also speculate that vertical programs are less likely to successfully stand alone when they are targeted at chronic diseases rather than, for instance, vaccine-preventable diseases. Chronic diseases may require a full range of services. Diabetes, for example, causes complications that may require dialysis and surgical intervention, which are best provided by a comprehensive health care system. With an essentially unchanging budget, however, provision of a broad range of services—that is, horizontal programs—becomes increasingly difficult to sustain, because expenditures fail to keep pace with population growth and inflation of health care costs.
The shift from inpatient to out-patient care on the Navajo Reservation over the past 70 years is largely the result of the change from infectious to noninfectious diseases, as well as changes in medical practice. The evidence cited here, however, also indicates that a high proportion of people with hypertension and diabetes are unaware of their diagnoses, suggesting that services are not reaching many who could benefit from them. This may be, at least in part, a consequence of having too few health care providers to meet the needs of the population, which in turn results from the very low per capita health expenditures for the Navajo population. Another possible cause, however, is that even in areas in which there are about the same number of providers as for nearby non–American Indian populations, the ability to provide needed services has been compromised by deficient budgets.
Self-Determination
Budgetary issues also confound attempts to assess the impact of self-determination on health. The years since the early 1970s have been a time of major change in American Indian health programs. It was in 1974 that President Nixon declared that, henceforth, tribal self-determination rather than termination (i.e., ending recognition of tribes as domestic sovereign nations) would be his administration’s policy.50 That has been government policy ever since, and an increasing number of tribal governments have assumed responsibility for providing services to their populations. One appraisal of the policy in 1998 claimed that IHS data showed a continuing improvement in the health status of American Indians over the previous 20 years,7(p227) which at the very least demonstrated that self-determination was not having deleterious consequences. More-recent data presented here, however, indicate that there have been changes for the worse in health status. Indeed, unpublished data from the IHS indicate that American Indian mortality has continued to stagnate since 1997 (Edna Paisano and Joanne Papallardo, IHS, written and oral communication, February 16, 2007).
The reversal of mortality decline cannot, however, be attributed to the management of health services by tribal entities. First, regional analyses published elsewhere show no clear association—either positive or negative—between rates of death from causes amenable to intervention and the proportion of services managed by tribes, beyond what could be better explained by median household income.6,51 Second, over the years for which Navajo Area data were analyzed, during which deaths from diabetes and cardiovascular diseases increased, none of the health programs were managed by the Navajo Nation.
Although the temporal association between a stagnant budget and stagnant mortality rates do not prove causation, the relationship is not likely to be entirely fortuitous. The continuing low level of funding for American Indian health programs, regardless of whether services are provided directly by the IHS or by tribal entities, seems likely to have had an impact on health status. Health care for American Indians is not treated as an entitlement in the federal budget49 but is a discretionary item subject to changing administration and congressional priorities.52 This is why spending has been flat, and it is reasonable to suggest that it is also why American Indians have not benefited from health services as they should.
Acknowledgments
Edna Paisano, Joanne Papallardo, and Cliff Wiggins provided unpublished data from the Indian Health Service. Helpful comments and advice were provided by Michael Everett, Laurence Jacobs, and Matthew C. Riddle.
Peer Reviewed
References
- 1.Omran AR. The epidemiologic transition: a theory of the epidemiology of population change. Milbank Mem Fund Q. 1971;49:509–538. [PubMed] [Google Scholar]
- 2.World Development Indicators [CD-ROM]. Washington, DC: World Bank; 2002.
- 3.Kunitz SJ. Disease and Social Diversity: The Impact of Europeans on the Health of Non-Europeans. New York, NY: Oxford University Press; 1994.
- 4.Rutstein DD, Berenberg W, Chalmers TC, Child CG, Fishman AP, Perrin EB. Measuring the quality of medical care: a clinical method. N Engl J Med. 1976;294:582–588. [DOI] [PubMed] [Google Scholar]
- 5.Holland WW, ed. European Community Atlas of “Avoidable Death.” Vol 2. Oxford, England: Oxford University Press; 1993.
- 6.Kunitz SJ. The history and politics of health care for Native Americans. In: Healy J, McKee M, eds. Accessing Health Care: Responding to Diversity. Oxford, England: Oxford University Press; 2004:303–324.
- 7.Dixon M, Shelton BL, Roubideaux Y, Mather D, Smith CM. Tribal perspectives on Indian self-determination and self-governance in health care management. In: Amending the Indian Self Determination and Education Assistance Act to Provide for Further Self-Governance by Indian Tribes, and for Other Purposes, Report 106–221, 106th Cong, 1st Sess (1999).
- 8.Soper FL. Building the Health Bridge: Selections From the Work of Fred L. Soper. Bloomington: Indiana University Press; 1970.
- 9.Djukanovic V, Mach EP. Alternative Approaches to Meeting Basic Health Needs in Developing Countries. Geneva, Switzerland: World Health Organization; 1978.
- 10.Berman P. Selective primary health care: is efficient sufficient? Soc Sci Med. 1982;16:1054–1059. [DOI] [PubMed] [Google Scholar]
- 11.Gish O. Selective primary health care: old wine in new bottles. Soc Sci Med. 1982;16:1049–1053. [DOI] [PubMed] [Google Scholar]
- 12.Regional Differences in Indian Health 2000–2001. Rockville, Md: Indian Health Service, Division of Program Statistics; 2003.
- 13.Trends in Indian Health 2000–2001. Rockville, Md: Indian Health Service, Division of Program Statistics; 2004.
- 14.Kunitz SJ. Disease Change and the Role of Medicine: The Navajo Experience. Berkeley: University of California Press; 1983.
- 15.2005 Navajo Community Health Status Assessment. Window Rock, Ariz: Navajo Area Indian Health Service, Office of Program Planning and Evaluation; 2005.
- 16.International Classification of Diseases, Ninth Revision. Geneva, Switzerland: World Health Organization; 1980.
- 17.International Classification of Diseases, 10th Revision. Geneva, Switzerland: World Health Organization; 1990.
- 18.Kunitz SJ, Pesis-Katz I. Mortality of white Americans, African Americans, and Canadians: the causes and consequences for health of welfare state institutions and policies. Milbank Q. 2005;83:5–39. [DOI] [PMC free article] [PubMed] [Google Scholar]
- 19.Manuel DG, Mao Y. Avoidable mortality in the United States and Canada, 1980–1996. Am J Public Health. 2002;92:1481–1484. [DOI] [PMC free article] [PubMed] [Google Scholar]
- 20.EC Working Group on Health Services and “Avoidable Deaths.” European Community Atlas of “Avoidable Death” 1985–89. Oxford, England: Oxford University Press; 1997.
- 21.National Center for Health Work-force Analysis. The Arizona Health Workforce: Highlights from the Health Workforce Profile. Available at: http://bhpr.hrsa.gov/healthworkforce/reports/statesummaries/arizona.htm. Accessed December 1, 2007.
- 22.National Center for Health Work-force Analysis. The New Mexico Health Workforce: Highlights from the Health Workforce Profile. Available at: http://bhpr.hrsa.gov/healthworkforce/reports/statesummaries/newmexico.htm. Accessed December 1, 2007.
- 23.Table S1. Median household income by state: 1969, 1979, 1989, and 1999. Income Surveys Branch/HHES Division, US Census Bureau. Available at: http://www.census.gov/hhes/www/income/histinc/state/state1.html. Accessed December 1, 2007.
- 24.Final Report PC(2)-1F, American Indians. Washington, DC: US Bureau of the Census; 1973: Table 14.
- 25.Rodgers L. 1990 Census: Population and Housing Characteristics of the Navajo Nation. Window Rock, Ariz: Division of Community Development, Navajo Nation; 1993.
- 26.Thornton R. The Navajo–US population mortality crossover since the mid-20th century. Popul Res Policy Rev. 2004;23:291–308. [Google Scholar]
- 27.Hoy W, Light A, Megill D. Cardiovascular disease in Navajo Indians with type 2 diabetes. Public Health Rep. 1995;110:87–94. [PMC free article] [PubMed] [Google Scholar]
- 28.Sugarman JR, Hickey M, Hall T, Gohdes D. The changing epidemiology of diabetes mellitus among Navajo Indians. West J Med. 1990;153:140–145. [PMC free article] [PubMed] [Google Scholar]
- 29.Sugarman JR, Gilbert TJ, Weiss NS. Prevalence of diabetes and impaired glucose tolerance among Navajo Indians. Diabetes Care. 1992;15:114–120. [DOI] [PubMed] [Google Scholar]
- 30.Sugarman JR, White LL, Gilbert TJ. Evidence for a secular change in obesity, height, and weight among Navajo Indian schoolchildren. Am J Clin Nutr. 1990;52:960–966. [DOI] [PubMed] [Google Scholar]
- 31.White LL, Ballew C, Gilbert TJ, Mendlein JM, Mokdad AH, Strauss KF. Weight, body image, and weight control practices of Navajo Indians: findings from the Navajo Health and Nutrition Survey. J Nutr. 1990;127(suppl 10):2094S–2098S. [DOI] [PubMed] [Google Scholar]
- 32.Freedman DS, Serdula MK, Percy CA, Ballew C, White L. Obesity, levels of lipids and glucose, and smoking among Navajo adolescents. J Nutr. 1997;127(suppl 10):2120S–2127S. [DOI] [PubMed] [Google Scholar]
- 33.O’Connor PJ, Crabtree BF, Nakamura RM, Kelley D. Hospitalization experience of Navajo subjects with type II diabetes and matched controls: an historical cohort study. J Clin Epidemiol. 1990;43:881–890. [DOI] [PubMed] [Google Scholar]
- 34.O’Connor PJ, Crabtree BF, Nakamura RM. Mortality experience of Navajos with type 2 diabetes mellitus. Ethn Health. 1997;2:155–162. [DOI] [PubMed] [Google Scholar]
- 35.Will JC, Strauss KF, Mendlein JM, Ballew C, White LL, Peter DG. Diabetes mellitus among Navajo Indians: findings from the Navajo Health and Nutrition Survey. J Nutr. 1997;127(suppl 10):2106S–2113S. [DOI] [PubMed] [Google Scholar]
- 36.Percy C, Freedman DS, Gilbert TJ, White L, Ballew C, Mokdad A. Prevalence of hypertension among Navajo Indians: findings from the Navajo Health and Nutrition Survey. J Nutr. 1997;127(suppl 10):2114S–2119S. [DOI] [PubMed] [Google Scholar]
- 37.Taylor JB, Kalt JP. American Indians on Reservations: A Databook of Socioeconomic Change Between the 1990 and 2000 Censuses. Cambridge, Mass: Harvard Project on American Indian Economic Development, Harvard University; 2005.
- 38.World Health Organization. 2002. Global Burden of Disease Project. Available at: http://www.who.int/healthinfo/statistics/gbdwhoregionmortality2002.xls. Accessed February 15, 2007.
- 39.Barker WH, Mullooly JP. Stroke in a defined elderly population, 1967–1985: a less lethal and disabling but no less common disease. Stroke. 1997;28:284–290. [DOI] [PubMed] [Google Scholar]
- 40.Barker WH, Mullooly JP, Linton KLP. Trends in hypertension prevalence, treatment, and control in a well-defined older population. Hypertension. 1998;31(pt 2):552–559. [DOI] [PubMed] [Google Scholar]
- 41.Tunstall-Pedoe H, Vanuzzo D, Hobbs M, et al. Estimation of contribution of changes in coronary care to improving survival, event rates, and coronary heart disease mortality across the WHO MONICA Project populations. Lancet. 2000;355:688–700. [DOI] [PubMed] [Google Scholar]
- 42.Sunder M. Intense management of diabetes mellitus: role of glucose control and antiplatelet agents. J Clin Pharmacol. 2004;44:414–422. [DOI] [PubMed] [Google Scholar]
- 43.Ostgren CJ, Lindblad U, Melander A, Rastam L. Survival in patients with type 2 diabetes in a Swedish community: Skaraborg Hypertension and Diabetes Project. Diabetes Care. 2002;25:1297–1302. [DOI] [PubMed] [Google Scholar]
- 44.Centers for Disease Control and Prevention. Diabetes prevalence among American Indians and Alaska Natives and the overall population—United States, 1994–2002. MMWR Morb Mortal Wkly Rep. 2003;52:702–704. [PubMed] [Google Scholar]
- 45.Centers for Disease Control and Prevention. Prevalence of Heart Disease—United States, 2005. MMWR Morb Mortal Wkly Rep. 2007;56:113–118. [PubMed] [Google Scholar]
- 46.Denny CH, Holtzman D, Goins RT, Croft JB. Disparities in chronic disease risk factors and health status between American Indian/Alaska Native and white elders: findings from a telephone survey, 2001 and 2002. Am J Public Health. 2005;95:825–827. [DOI] [PMC free article] [PubMed] [Google Scholar]
- 47.Vogt DU, Walke R. Indian Health Service: Health Care Delivery, Status, Funding, and Legislative Issues. Washington, DC: Congressional Research Service, Library of Congress; September 12, 2006.
- 48.Wilson C, Gilliland S, Cullen T, et al. Diabetes outcomes in the Indian health system during the era of the Special Diabetes Program for Indians and the Government Performance and Results Act. Am J Public Health. 2005;95:1518–1522. [DOI] [PMC free article] [PubMed] [Google Scholar]
- 49.Interim Report to Congress, Special Diabetes Program for Indians. Albuquerque, NM: Indian Health Service National Diabetes Program; December 2004.
- 50.Kunitz SJ. The history and politics of health care policy for American Indians. Am J Public Health. 1996;86:1464–1473. [DOI] [PMC free article] [PubMed] [Google Scholar]
- 51.Adams A. The road not taken: how tribes choose between tribal and Indian Health Service management of health care resources. Am Indian Cult Res J. 2000;24:21–38. [DOI] [PubMed] [Google Scholar]
- 52.Westmoreland TM, Watson KR. Redeeming hollow promises: the case for mandatory spending on health care for American Indians and Alaska Natives. Am J Public Health. 2006;96:600–605. [DOI] [PMC free article] [PubMed] [Google Scholar]