

Abstract
Patterning in multicellular organisms results from spatial gradients in morphogen concentration, but the dynamics of these gradients remains largely unexplored. We characterize, through in vivo optical imaging, the development and stability of the Bicoid morphogen gradient in Drosophila embryos that express a Bicoid-eGFP fusion protein. The gradient is established rapidly (~1 hour after fertilization) with nuclear Bicoid concentration rising and falling during mitosis. Interphase levels result from a rapid equilibrium between Bicoid uptake and removal. Initial interphase concentration in nuclei in successive cycles is constant (±10%), demonstrating a form of gradient stability, but subsequently decays by approximately 30%. Both direct photobleaching measurements and indirect estimates of Bicoid-eGFP diffusion constants (D ≤ 1 μm2/s), provide a consistent picture of Bicoid transport on short (~min) time scales, but challenge traditional models of long range gradient formation. A new model is presented emphasizing the possible role of nuclear dynamics in shaping and scaling the gradient.
INTRODUCTION
The most widely accepted conceptual framework for pattern formation in developing multicellular organisms is the morphogen gradient: a spatially varying concentration of a transcription factor or extra-cellular signaling molecule across a field of developing cells in which cells acquire information about their spatial location from local measurements of morphogen concentration (Wolpert 1969). Although molecular studies have identified candidate morphogens and demonstrated that cells can respond differently to different concentrations of these molecules (Lawrence 1992; Driever & Nüsslein-Volhard 1988b; Zecca et al 1995; Ariizumi & Asashima 1995), the mechanisms that produce the gradients and read out positional information are not understood.
One of the best studied morphogen gradients is the Bicoid (Bcd) gradient in early Drosophila melanogaster embryos (Driever & Nüsslein-Volhard 1988a; Struhl et al 1989; Ephrussi & St Johnston 2004). Bcd is a maternal anterior determinant in the developing embryo that controls anterior-posterior (AP) patterning. Its mRNA is deposited during oogenesis at the anterior pole of the egg, and translated soon after fertilization. Antibody staining in fixed embryos demonstrates that Bcd concentration decays approximately exponentially with distance from the anterior pole. The exponential shape is consistent with the gradient being formed by a balance of localized Synthesis, Diffusion, and spatially uniform Degradation (Crick 1970; Lacalli & Harrison 1991), which we will refer to as the SDD model. Important unmeasured parameters in the SDD model are the diffusion coefficient (D) of Bcd and its lifetime (τ) in the cytoplasm. In general, the model remains untested and alternatives, such as active transport, have not been ruled out.
The dynamic properties of the Bcd gradient have not previously been characterized. For example, it is unknown how quickly the gradient is established and whether or not its amplitude and shape evolve or fluctuate with time. Characterizing this dynamics is important both for defining the plausibility of mechanisms implied by the SDD model and defining what positional information actually is available for morphogen readout. In the simplest SDD model implementation, the concentration profile of Bcd reaches a steady state, and this requires some minimum time that depends on the Bcd diffusion coefficient. Is the actual development time of the Bcd gradient consistent with its diffusion coefficient? Similarly, the mechanism of gradient readout might necessarily be more complex than a single time point measurement of concentration if the gradient is found to change shape or fluctuate significantly.
Our understanding of the development and stability of the Bcd gradient has been limited by the use of fixed tissue and antibody staining techniques that provide only static snapshots of the morphogen distribution. In addition, the analysis is complicated by the fact that the gradient arises during a stage when the embryo is undergoing rapid syncytial nuclear mitoses. As expected for a transcription factor, Bcd protein localizes to nuclei during interphase, but during mitosis nuclear envelopes break down, and it is unknown if the gradient is affected. Are events inside the nucleus responding passively to a gradient established in the surrounding cytoplasm, or do intranuclear processes help to shape the gradient itself? Along these lines, it recently has been suggested that Bcd degradation in nuclei contributes to the mechanism for scaling across embryos of different sizes (Gregor et al 2005).
Here we address these issues with a dynamic measurement of the Bcd gradient in single embryos. Fly transformants that encode a fusion gene of bcd and the coding region of the enhanced green fluorescent protein (eGFP) were generated. Observing these transformants with time-lapse two-photon fluorescence microscopy and photobleaching methods, the dynamics of the Bcd gradient was measured and perturbed during the first three hours of embryonic development. We show that the gradient is formed within the first hour after egg fertilization, and then is stably maintained during blastodermal stages. After each mitotic division, the concentration of Bcd in nuclei at a given position along the AP-axis of the egg reaches the same value it had in the previous nuclear cycle with a precision of 10%, despite changes in nuclear size and density. The nuclear and cytoplasmic concentrations are shown to be in a dynamic equilibrium on the ~1 min time scale. Direct and indirect measurements of the Bcd diffusion constant are all consistent with D ~ 0.3 μm2/s, which is much smaller than expected and raises problems for understanding how it is possible for the gradient to be established so rapidly. Finally, we propose a variant of the SDD model involving nuclear degradation that captures the Bcd dynamics revealed in our measurements and emphasizes a role for those dynamics in solving the scaling problem.
RESULTS
Bcd-GFP construct: initial characterization
To visualize the spatiotemporal dynamics of Bcd concentration we made transgenic Drosophila embryos in which endogenous Bcd was replaced with a fluorescent eGFP-Bcd fusion protein (called Bcd-GFP hereafter). Flies were generated utilizing a transcript coding for eGFP (Tsien 1998) fused to the N-terminus of Bcd. As in previous work with a GFP (rather than eGFP) fusion protein (Hazelrigg et al 1998), the construct contained endogenous bcd 5′ and 3′ UTRs, which are known to mediate anterior localization and translation of bcd mRNA.
Embryos expressing Bcd-GFP demonstrated an intricate spatial and temporal pattern of fluorescence concentration dynamics that was captured by time lapse two-photon excitation laser scanning microscopy (Denk et al 1990; Svoboda et al 1997). A typical image stack of three focal planes from a Bcd-GFP embryo during nuclear cycle 12 is shown in Fig 1A. The fluorescence consisted of two components: bright nuclei and dispersed cytoplasmic fluorescence of lower intensity. The bright nuclei are consistent with previous antibody stainings of Bcd and the fact that Bcd is a transcription factor that should, at some point, be targeted to nuclei. A gradient in fluorescence intensity from anterior to posterior is observed in both the nuclear and cytoplasmic components, also consistent with previous work (Driever & Nüsslein-Volhard 1988a). See movie in Supplemental Data.
FIG. 1.
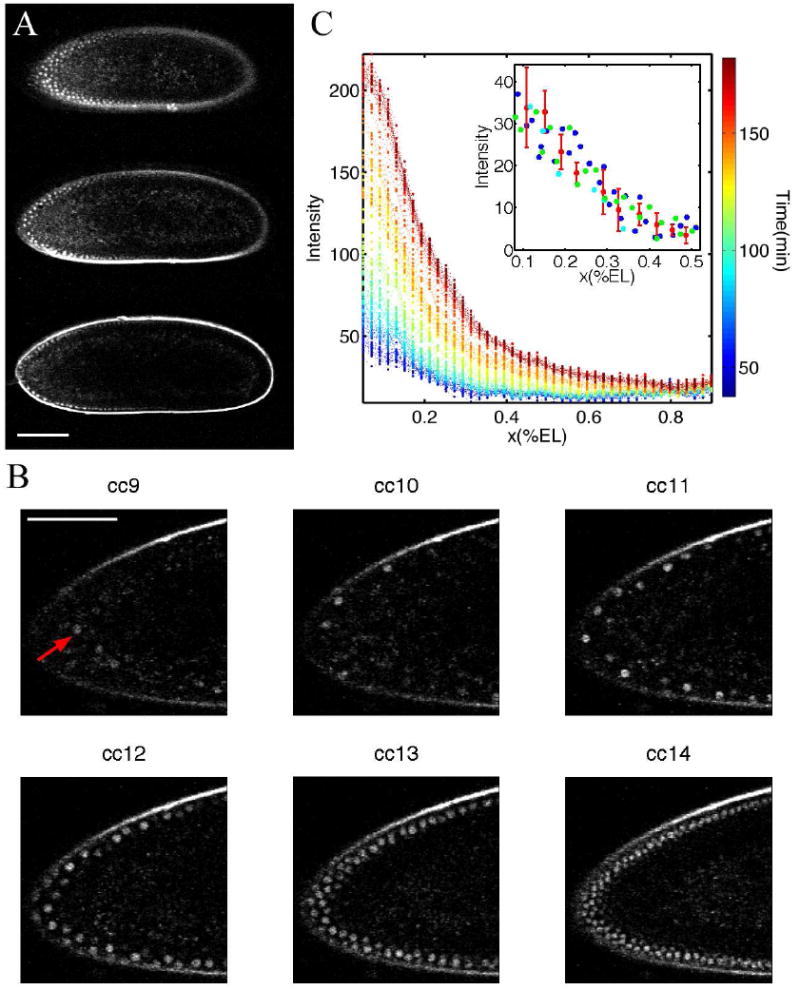
Time-lapse movie of a Drosophila embryo expressing Bcd-GFP using two-photon microscopy. A Typical image stack during nuclear cycle 12 of three focal planes at 30 μm (top panel), 60 μm (mid panel) and 90 μm (bottom panel) below the top surface of the embryo. (Scale bar 100 μm.) B Six snapshots of a time-lapse movie of the anterior third of the mid-sagittal plane of a Drosophila embryo expressing Bcd-GFP. Each snapshot corresponds to a time point during interphases 9 to 14. Red arrow points to individual nucleus during interphase 9 when nuclei are deeper inside the egg. (Scale bar 60 μm.) C Bcd-GFP fluorescence profiles are extracted from two-photon time-lapse movies and projected on the egg’s AP-axis by sliding (in software) an averaging box of 10 × 10 μm2 size along the edge of the egg focussed at the mid-sagittal plane. Time is represented by colorcode. Time zero corresponds to oviposition. Imaging started 20 ± 15 min after oviposition. Inset: Nuclear Bcd gradients in nuclear cycles 11 (blue), 12 (green), 13 (red) and 14 (cyan) projected on the AP-axis in the anterior half of the embryo.
Fluorescence from Bcd-GFP was first detected in anterior surface nuclei during nuclear cycle 9, approximately 90 min after fertilization. As shown in Figure 1B, during each successive nuclear division 9–14, bright nuclei reappear during interphase in the cortical layer. Qualitatively, these images reveal that in any given perimeter region, the total amount of fluorescence increases with each division. However, the intensity within individual nuclei at a given spatial location, appears, qualitatively, to be the same. To provide initial quantification of these effects, at each time point fluorescence was measured within a rectangular region (containing several nuclei and surrounding cytoplasm) that was slid along the embryo perimeter (Houchmandzadeh et al 2002). As shown in (Figure 1C), a fluorescence gradient that is approximately an exponential function of distance along the embryo can first be measured about one hour after fertilization. The overall intensity increases progressively with development time. In contrast, as shown in the inset to Figure 1C, the intensity measured in a very small box within individual nuclei maintains a fixed profile as a function of distance along the embryo. Both the shape of the spatial decay and the absolute concentration do not appear to change, within measurement error, as a function of nuclear cycle.
A series of control experiments was performed to test the biological relevance of these measurements from two different perspectives. First, we asked the question: does Bcd-GFP functionally substitute for endogenous Bcd and do flies expressing Bcd-GFP develop normally? Second, we asked: does the GFP fluorescence quantitatively represent the distribution of Bcd-GFP, and how does this distribution compare to that of endogenous Bcd?
First, the P[egfp-bcd]transgene completely rescues the headless anterior defect normally observed in embryos from bcd mutant mothers; qualitatively, no developmental defects are observed throughout the entire life cycle. Quantitatively, the position along the AP-axis of the cephalic furrow, a strong indicator of the total amount of active Bcd protein, was measured. In embryos with the Bcd-GFP construct in a bcd-null mutant background, the furrow location at 32.8±1.3% egg length (mean and s.d. over n = 10 embryos) was identical to that of wild-type embryos (33.8 ± 0.7%; n = 12); these results are consistent with previous qualitative estimates of approximately 35% (Driever and Nüsslein-Volhard 1988b). Thus, by both qualitative and quantitative criteria, fluorescent egfp-bcd behaves indistinguishably from wild-type bcd in the early embryo, indicating that its localization and translational regulation are conserved, and that the protein is folded properly despite the attached eGFP epitope.
Second, to determine the faithfulness with which eGFP fluorescence reports both Bcd-GFP and endogenous Bcd concentration, fixed embryos were co-labeled with fluorescent antibodies against Bcd and GFP and the fluorescence intensities at locations around the perimeter were compared to each other and to endogenous GFP fluorescence. As summarized in the scatter plots in Fig 2, the intensity of one probe always is linearly related to the intensity of a different probe. These results demonstrate that, except for differences in background levels, the fluorescence intensity in each case is proportional to the protein concentration. Further implications of these studies, such as the linearity of antibody staining as a method of quantifying relative protein concentration, are discussed in Supplemental Data.
FIG. 2.
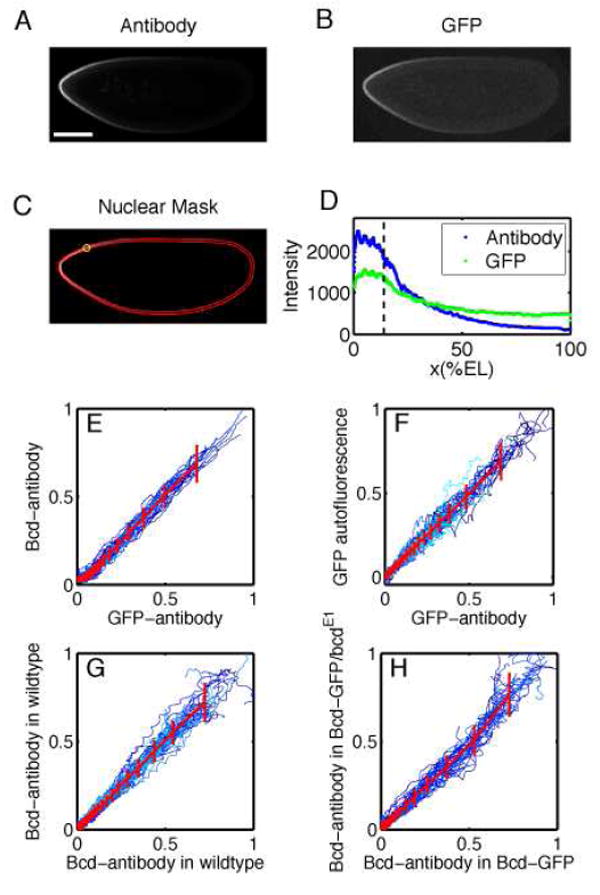
Comparison of Bcd profiles in Drosophila embryos expressing Bcd-GFP. (Embryos were formaldehyde fixed during nuclear cycle 14 and imaged at the mid-sagittal plane via confocal microscopy.) A Embryo stained with GFP antibodies.(Scale bar 100 μm.) B GFP autofluorescence for the same embryo as in A. C Nuclear layer obtained via image analysis software used to extract gradients from images A and B by sliding a circular averaging area (yellow circle) along the edge of the embryo images. D Extracted raw gradients from A and B projected on embryo AP-axis. Dashed line corresponds to location of yellow circle in C. E-H Scatter plots of fluorescence intensities extracted from Bcd profiles for different embryos. All profiles were normalized by a background subtraction and a scale factor (see Materials and Methods). Both dorsal and ventral profiles are shown in each panel. Colors represent individual embryos, red lines correspond to the average profile scatter, errorbars are for equal amounts of data points. Deviations of the compared profiles from the diagonal indicate a difference in the shape of the profile. For more information see Supplemental Data.
Together, these control experiments reveal that the biological and physical properties of the Bcd-GFP construct reproduce the properties of the endogenous bcd gene. Thus our time lapse observations of dynamics in Bcd-GFP expressing embryos with a bcd-null mutant background quantitatively represent wild-type behavior of the Bcd morphogen gradient.
Constancy of nuclear Bcd concentration
The low magnification time lapse movies in Figure 1 provide initial support for the idea that the gradient in intranuclear Bcd concentration along the embryo develops early and is approximately constant in amplitude and shape over time during nuclear cycles 9–14. This stability is, however, somewhat surprising, since several processes are occurring simultaneously that would be expected to produce local spatial and temporal variations in Bcd concentration: the number of nuclei doubles with each mitotic cycle, the size (diameter) of individual nuclei changes during interphase and between adjacent cycles, Bcd concentrations must rise and fall as nuclear membranes form and dissolve. To further characterize and understand these expected changes in Bcd concentration and what kind of stability may exist at the local level, individual nuclei were tracked over time at higher magnification.
High-resolution time lapse images were taken of nuclei in the anterior half of the embryo, with the field of view reduced to 50 × 50 μm2. Figure 3A depicts two nuclei during interphase 12; the same field of view during mitosis 13 is shown in Figure 3B. The concentration profiles of a thin horizontal rectangle across the center of the nuclei in Figures 3A and the corresponding position in 3B, depicted in Figure 3C, clearly show that the cytoplasmic concentration increases during mitosis at the location between the two nuclei, as expected if Bcd-GFP is freed to diffuse into the cytoplasm as the nuclei enter mitosis.
FIG. 3.
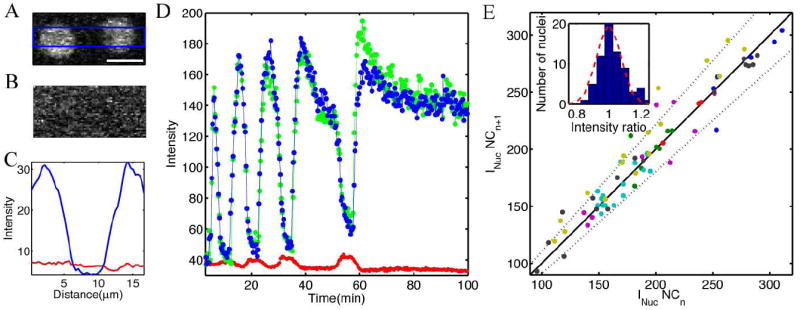
Bcd gradient stability. A Close up of two adjacent nuclei expressing Bcd-GFP fluorescence during mid-interphase 12. (Scale bar 10 μm.) B Same field of view as in A during mitosis 13. C Intensity profile of a mean horizontal cross-section through images in A (blue line, vertical average over blue rectangle in A) and B (red line, vertical average over entire image). D Typical nuclear and cytoplasmic development of Bcd-GFP concentration from nuclear cycles 10 to 14. Each data point corresponds to the concentration of a single nucleus at a given time point, computed as the mean intensity value over an area that corresponds to the smallest nuclear size encountered in over the entire time course (384 pixels). Blue and green traces follow two individual nuclei (located at ~ 50 μm distance from the anterior pole of the embryo), red curve corresponds to the average concentration in the interstitial space between the nuclei over a field of view of 50 × 50 μm (linear pixel dimension 0.20 μm/pixel). Time points are in 20 s intervals. E Scatter plot of peak nuclear intensities INuc, averaged over 1–5 time points, during nuclear cycle n versus nuclear cycle n+1. Different colors represent different embryos (N=7). For each embryo 1–8 nuclei were compared in nuclear cycles 10 to 14, resulting in a total of 77 data points. Black line with slope 1 corresponds to perfect intensity reproducibility across nuclear cycles. Dotted line corresponds to an accuracy of 10%. Inset: Bars: Histogram of observed intensity ratios in bins of width 5%. Dashed line: Results expected for Gaussian variations having the observed standard deviation of 7.9%.
To measure the complete time course of nuclear Bcd-GFP concentration from time lapse movies during cycles 10–14, a fixed size region of interest (ROI) within the nuclear membrane boundary of a single nucleus was determined during interphase. The average intensity within this ROI was determined for a sequence of images starting with the cytoplasm before nuclear membrane formation, through interphase, and continuing in the cytoplasm immediately following nuclear envelope breakdown. To continue the time course into the succeeding cycle, the ROI was switched to an area within the newly forming nucleus that was closest to the position of the first nucleus in order to maintain positional constancy along the AP-axis of the egg. Figure 3D shows two time courses of nuclear concentration, determined by this procedure, from the same embryo.
These data demonstrate a stereotyped response in which peak intranuclear concentrations occur early in each syncytial nuclear cycle. They further reveal that these peaks are nearly constant between nuclear cycles 10 and 14. This is quantified by plotting, in Figure 3E, the concentration in one cycle against that in the preceding cycle. Monitoring 3–4 nuclei in each of 7 different embryos, in most cases the peak is reproducible to better than 10% accuracy. More quantitatively, the ratio of fluorescence intensities from one cycle to the next has a mean of 1.02 and a standard deviation of just 7.9% (N = 77). These results hold over a wide range of absolute concentrations, corresponding to positions from 5% to 35% of the distance from anterior to posterior pole.
Figure 3D also shows the cytoplasmic Bcd-GFP concentration across nuclear cycles 10–14. As for the nuclear concentration, a highly reproducible pattern between interphase and mitosis is observed with cytoplasmic concentration peaks during mitosis representing the equilibration of Bcd-GFP concentration after release from the nuclei, as shown in Figure 3C.
Our data show a surprising coexistence of highly dynamic behavior and precise constancy. Over the course of a single nuclear cycle, the concentration of Bcd varies systematically over a factor of four at the location corresponding to a single nucleus. When the next cycle starts, however, the nuclear Bcd concentration is restored to the same value with ~ 10% accuracy. This reproducibility validates a dynamic version of the positional information hypothesis: From one nuclear cycle to the next, Bcd concentration provides information about the spatial location of the nucleus, and the mapping from position to concentration is invariant across cycles. This stability in the nuclear concentration gradient occurs despite the fact that the total concentration of Bcd in a local cortical region containing multiple nuclei is increasing with each cycle.
Nucleo–cytoplasmic Bcd concentration equilibrium
Although peak Bcd concentrations are reproduced from one nuclear cycle to the next, closer inspection of the nuclear concentration time courses reveals a highly dynamic pattern, both in relative and in absolute terms. We identify three distinct behaviors of nuclear Bcd-GFP concentration during each mitotic cycle, marked as intervals I (nuclear envelope breakdown), II (refilling) and III (interphase) during nuclear cycle 13 in Figure 4A. Note that during interphase interval III, a concentration drop of approximately 30% is observed.
FIG. 4.
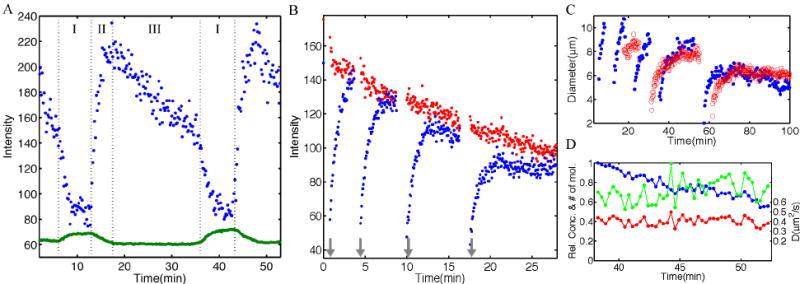
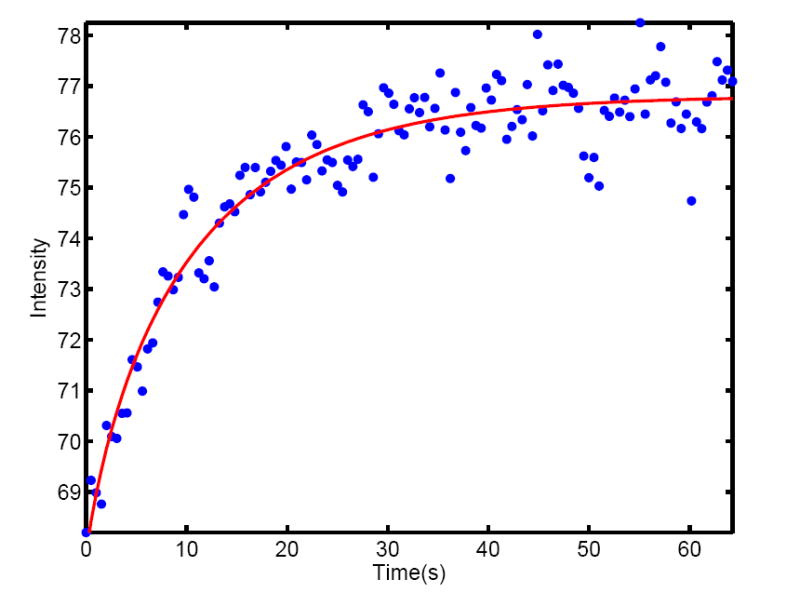
Nuclear Bcd concentration dynamics. A Typical nuclear (blue) and cytoplasmic (green) Bcd-GFP concentration development during nuclear cycle 13. Three intervals correspond to: I) Nuclear envelope breakdown and diffusive nuclear Bcd-GFP release, II) rapid refilling of newly formed nuclei after mitosis, and III) interphase 13. B Fluorescence recovery after photobleaching of a single nucleus of a Bcd-GFP embryo during interval III of nuclear cycle 14. Blue curves are the recovery curves of a 4 times successively bleached nucleus, red curve is the concentration in a neighboring unbleached nucleus. Bleach pulses (10 – 15 s long) are indicated by gray arrows. Data points are in 4 s intervals. The time constants τ of exponential recovery fits are 60 s, 53 s, 52 s, 50 s, respectively for the 4 bleaching traces. The linear decay of the red curve is due to the increasing nuclear diameter during interphase which leads to an effective decrease in the nuclear Bcd-GFP concentration (see text). C Development of nuclear diameter from nuclear cycle 10 to 14. Blue and red data points correspond to two different embryos (blue corresponds to the data set of Figure 3A). The nuclear diameters at the end of interphase (averaged over 2 embryos) in nuclear cycles 10 to 14 are 10.0 μm, 10.5 μm, 9.2 μm, 8.2 μm, 6.5 μm, respectively. D Relative intensity (blue), relative number of molecules (green) and ratio of number of molecules to influx (red) as a function of time during nuclear cycle 13. Blue curve corresponds to average nuclear intensity I(t) represented by the blue trace in Figure 3D during interphase 13. Green curve corresponds to the product of where 2rn(t) is the nuclear diameter represented by the blue trace in C. Red curve corresponds to the product . The right side of the vertical axis has been normalized to yield the cytoplasmic diffusion constant , see text. To quantify the observation that is constant while , we looked for linear correlations between these quantities and time; for the correlation (0.50) is highly significant (p = 0.0013), while for there is essentially no correlation (0.01, p = 0.93) – data sets for five embryos showed similar results.
A fundamental question raised by our results is whether the high intranuclear concentration of Bcd results from simple trapping of Bcd or from a dynamic equilibrium of Bcd molecules exchanging between cytoplasm and the nuclei. To address this question, we bleached the fluorescence of Bcd-GFP in single nuclei during interphase. Nuclear fluorescence recovered, demonstrating that Bcd-GFP is being transported across the nuclear membrane. A typical recovery trace of a single bleached nucleus in cycle 14 is shown in Figure 4B. If repetitively bleached during the slow interphase decay (interval III), the recovering concentration asymptotically approaches the intensity level of adjacent control nuclei. These data suggest that there is a dynamic equilibrium between transport into the nucleus and a loss, either via outward transport or intranuclear protein degradation.
To interpret the results of the photobleaching experiments more quantitatively, a simple model is considerd in which molecules are transported into the nucleus at a rate proportional to the concentration outside in the cytoplasm (kinCout) and leave the nucleus either from transport back into the cytoplasm (at rate kout) or by degradation (at rate kd−nuc). The dynamics for the number of molecules within a nucleus n(t) is given by
| (1) |
| (2) |
where τn is the effective lifetime of the molecule in the nucleus. If the cytoplasmic concentration is approximated as being constant during the measurement (consistent with experiment, see Figure 3D), then if the photobleaching pulse reduces the number of fluorescent molecules by an amount Δn0 the model predicts an exponential recovery
| (3) |
where n∞ = kinτnCout is the steady state number of molecules in the nucleus, and the observable fluorescence is proportional to the number of molecules n(t). Notice that although recovery of fluorescence after photobleaching provides evidence for Bcd transport into the nucleus, the actual time constant for exponential recovery is related to the rate at which molecules leave the nucleus, either by export or degradation.
Following Equation (3), exponential functions were fit to 19 fluorescence recovery curves from 4 embryos in nuclear cycle 14. The time constant determined from these fits is τn = 68.9±17.6 s (mean ± s.d.). Thus, any disequilibrium in Bcd concentration between the nucleus and the surrounding cytoplasm will be corrected within roughly one or two minutes, which is quite fast on the scale of the nuclear cycles. In particular, this time is short enough that at each moment during interphase interval III (cf Figure 4A), the nuclear concentration should be in steady state. Why, then, is it drifting downward by ~ 30%?
Geometric factors correlate with nuclear Bcd concentration reduction during interphase
The sizes of nuclei during interphase are not constant; their diameters approximately double in size, as shown quantitatively in Figure 4C. Then perhaps the simplest hypothesis, which could explain the drop in intranuclear Bcd concentration that is evident during interphase interval III, is that as the nuclei increase in volume, the intranuclear concentration is reduced by dilution. Indeed, the model above predicts that the steady state number of molecules inside the nucleus is given by n∞ = kinτnCout, and hence the concentration will be given by , where rn is the radius of the nucleus, or ; if all other parameters are fixed, the product should be constant. In fact this prediction is not consistent with the data: is an increasing function of time during interphase interval III (green curve in Figure 4D).
To understand the concentration decrease during interval III it may be useful to look more carefully at the physical factors which determine the rate of transport into the nucleus, kin. The largest possible value for kin can be calculated by assuming that the entire spherical surface of the nuclei is a perfect absorber for Bcd molecules that arrive via diffusion. Consideration of this limit is inspired by ligand binding to receptors on a bacterial cell surface (Berg & Purcell 1977), and is analogous to the diffusion limited rate constant for an enzymatic reaction (Fersht 1985). Transport occurs through discrete nuclear pores, but the nuclei have of the order of 2500 nuclear pore complexes on their surface (Kiseleva et al 2001), or 20–40 pores per square micron. If each pore acts as an absorber with a radius of a few nanometers, then this density of pores may be sufficient to make the entire nucleus act as an almost perfect absorber (Berg & Purcell 1977). If this is true, the rate of Bcd transport into the nucleus should be given by the maximal, diffusion limited rate kin = 4πrnD, where D is the diffusion constant of Bcd in the surrounding cytoplasm. Diffusion limited transport means that, as the nuclei increase in size, the flux into the nucleus becomes larger, and this should partially offset the effect of dilution. More quantitatively, with kin = 4πrnD our simple model predicts that
| (4) |
We have seen that the cytoplasmic concentration Cout and the recovery time τn both are approximately constant during interphase, so we predict that the product should be constant, which is consistent with our data, as Figure 4D shows.
The combination of this result with the photobleaching experiment supports a picture in which nuclear Bcd is in rapid dynamic equilibrium with cytoplasmic Bcd, and the transport into the nucleus is as fast as possible, being limited by cytoplasmic diffusion. All of the quantities in Equation (4) are directly measured except for the diffusion constant D. Thus this simple model could predict a cytoplasmic diffusion constant in terms of our other data, . The result, as shown in Figure 4D, is D = 0.37±0.05 μm2/s (mean ± s.d.). Although our results in Figure 4D are consistent with a simple model, there are several caveats. In particular, the nuclear pores might not act as perfect absorbers, either because the kinetics of transport through the pore itself is too slow [but this is unlikely, see Kubitscheck et al (2005)], or because competition among many protein species lowers the efficiency for transport of Bcd. We thus view the diffusion constant which emerges from the analysis of Figure 4D not as a measurement, but as a prediction to be tested by more direct experiments.
Bcd-GFP diffusion in the cortical cytoplasm
To directly measure the diffusion constant of Bcd-GFP in the cortical cytoplasm, we measured the dynamics of recovery after pattern photobleaching. A rectangular volume 16 × 16 × 7 μm3 in the anterior cytoplasm of Bcd-GFP expressing embryos was photobleached during mitosis 13, when Bcd-GFP is uniformly distributed (locally) throughout the cortical cytoplasm and the cytoplasmic concentration is relatively high. A typical recovery curve is shown in Figure 5. Recovery curves were fit to solutions of the diffusion equation to estimate D (see Methods). From a total of 21 recovery curves in 4 embryos, our analysis provided a cytoplasmic diffusion constant D = 0.30±0.09 μm2/s (mean ± s.d.) during mitosis 13, which is very close to our estimate from the transport model.
FIG. 5.
Cortical diffusion constant measurements by fluorescence recovery after photobleaching. Recovery curve of bleached wild-type Drosophila embryos expressing Bcd-GFP during mitosis 13. Bleaching was done with a scanning two-photon microscope in a volume of 16 × 16 × 7 μm3 at the anterior tip of the egg. The bleaching pulse was generated by increasing the laser power 2-fold for a duration of 5 seconds. Data points are spaced 0.5 sec and shown as blue dots. Red curve represent a fit to the solution of the diffusion equation (see Methods), yielding a diffusion constant D = 0.27 ± 0.07 μm2/s.
This cortical diffusion constant is surprisingly small, especially given earlier measurements (Gregor et al 2005) which showed significantly higher diffusion constants for biologically inert molecules injected into eggs. As we discuss below, it is very difficult to reconcile the small diffusion constant measured for Bcd-GFP with the fact that the gradient forms in about one hour and remains stable over nuclear cycles 10–14. Within the SDD model, the gradient would never reach steady-state with our measured small diffusion constant for Bcd-GFP, given the obvious developmental time constraints.
Cortex vs. core
The diffusion constants for Bcd protein we measure on the surface of the embryos would not be representative of the embryo as a whole if the cortex contains structures that trapped the protein or slowed its diffusion. The classic example of this effect is the slowing of calcium ion diffusion in neurons (Hodgkin & Keynes 1956). In the Supplemenal Data, we show mathematically how the presence of bindings sites would affect diffusion and observed Bcd concentration in the context of the SDD model. The result is that the presence of fixed binding sites should both slow the diffusion and enhance the total (bound + free) concentration of Bcd, both in proportion to the density of sites.
In sectioned cycle 14 embryos (Figure 6A), we do in fact see a significantly higher concentration of Bcd in the cortex relative to the central core of the egg. The intensity ratio between the cortex and the core increases in an approximately exponential fashion with progressing nuclear cycles and the increasing number of nuclei in the cortical cytoplasm (see Figure 6D). This suggests that structures which bind Bcd in the cortex are associated with the nuclei themselves. The roughly ten fold enhancement of Bcd concentration, presumably as a result of binding to an enhanced density of fixed sites near the cortex, would be consistent with diffusion constants being an order of magnitude larger in the core of the embryo [see Equation (S9) in Supplemental Data], although we are unable to measure this directly.
FIG. 6.
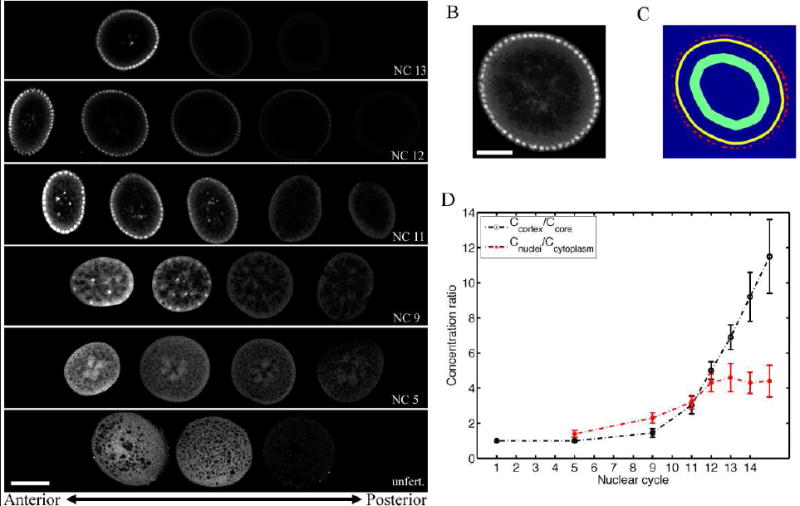
Bcd concentration accumulation at the egg’s cortex. A Confocal images of hand-cut sections of formaldehyde-fixed wild-type Drosophila embryos. (Scale bar 100 μm.) Embryos have been stained with Bcd antibodies prior to cutting. Each row corresponds to a single embryo with sections ordered from anterior (left) to posterior (right) parts of the embryo during nuclear cycles 13, 12, 11, 9 and 5 (top to bottom). Bottom row shows a Bcd antibody staining of an unfertilized egg. B Typical anterior slice of hand-cut embryo stained with Bcd antibodies (close up of second slice from the right in 2nd row of A, scale bar 50 μm.). C Mask used to extract concentration averages in B. Red area corresponds to nuclear mask, yellow area corresponds to cytoplasmic mask and green area corresponds to core area. D Ratio of cytoplasmic Bcd concentration in the cortex and the inner core of the egg (black curve), and ratio of nuclear Bcd concentration and adjacent cytoplasmic Bcd concentration (red curve), both as a function of nuclear cycle. Concentrations are extracted from cut sections of A.
Bcd diffusion and degradation in unfertilized eggs
To evaluate whether the presence of nuclei, or some nuclear related cytoplamic structure, changes the diffusive behavior of Bcd protein in the cortex, we examined the movement of Bcd in the cortex of unfertilized eggs. Although such eggs have only a single female pronucleus and do not undergo the progressive reorganization of the cortical cytoplasm associated with normal development, they still initiate translation of bcd RNA when the egg is laid. In contrast to the syncytial blastoderm stages described above, Bcd protein in unfertilized eggs show no obvious enrichment in the cortex (see Figure 6A). To determine the Bcd diffusion constant in such eggs, we performed photobleaching experiments identical to those described earlier for fertilized eggs, In 7 measurements on 3 eggs, the diffusion constant was D = 0.35±0.12 μm2/s, nearly identical to that measured in the cortical cytoplasm of embryos. We conclude that the diffusive behavior measured in the cortex is not dependent on the presence of nuclei or associated cytoplasmic structure and may in fact represent the general behavior of all regions of the egg. In particular, to the extent that the unorganized cortex of the unfertilized egg approximates the environment in the central core of the fertilized egg, our results argue against the possibility that the central cytoplasm would provide a faster path for Bcd diffusion (see Discussion).
Although diffusion constants appear to be identical, the fertilized or unfertilized state of the egg may still impact the final distribution of Bcd protein. To assess this possibility, we measured the average Bcd-GFP fluorescence intensity in 400 μm2 regions near the anterior and posterior poles, and compared the results with those from similar measurements in fertilized eggs. (A more detailed comparison of full in vivo gradients in unfertilized and fertilized eggs will be presented elsewhere.) In the fertilized eggs, intensities were 3.8±0.4 times larger at the anterior pole than at the posterior (mean and s.d. over 13 embryos). This ratio is not as large as the full dynamic range of the gradient (c.f. Figure 1C) because the averaging region is chosen relatively large so as to have a robust signal from the unfertilized eggs.
In the unfertilized eggs, we found that Bcd intensities at the posterior portion of unfertilized eggs are reproducibly greater than the near background levels observed in that region of fertilized eggs (data not shown), which is in agreement with earlier findings by Driever & Nüsslein-Volhard (1988a). At the anterior pole, intensities were lower and the overall ratio was 1.5 ± 0.3 (mean and s. d. over 13 embryos). At 5h, when the anterior intensity of Bcd-GFP in unfertilized eggs was more nearly equal to that in fertilized eggs at cycle 14, the the anterior/posterior ratio had not changed (1.3 ± 0.3; n = 13 embryos).
These observations suggest that gradient formation in unfertilized eggs differs from that of fertilized eggs in two significant respects: The levels achieved at the posterior pole are higher and the overall shape is flatter. Since the level of Bcd at the posterior pole would be expected to be greatly influenced by degradation, this provides support for considering models in which the nuclei present in fertilized eggs contribute to the degradation process itself (see Discussion).
DISCUSSION
Our principal results, together with those of previous work (Driever & Nüsslein-Volhard 1988a,b; Houchmandzadeh et al 2002; Gregor et al 2005), provide the following foundation for any mechanistic model for the formation or read out of the Bcd gradient:
The gradient is approximately (but not necessarily exactly) an exponential decay in intranuclear (and cytoplasmic) concentration that is established rapidly (less than 90 min).
Bcd diffuses relatively slowly (D = 0.3 μm2/s) in the cortical cytoplasm containing the nuclei.
The Bcd gradient is stable over nuclear cycles 10–14, when the number of nuclei is growing by a factor of two with each division and Bcd is concentrated and released from nuclei in a dynamic process. In particular, the initial post interphase concentration in nuclei in successive cycles is constant to at least 10%, but decays by approximately 30% during the subsequent interphase period.
Bcd is not simply trapped in nuclei, rather it is in dynamic equilibrium between influx and efflux with the cytoplasm and, possibly, intranuclear degradation.
The total concentration (bound + free) of Bcd in the cortical cytoplasm is distinctly higher than in the yolk.
The spatial shape of the Bcd gradient (the length constant for an exponential decay) scales with embryo length over a factor of five range in lengths in different dipteran species (Gregor et al 2005).
Problems with the simplest gradient model
The most widely considered and simplest model for Bcd gradient formation, namely the SDD model, consists of a source of protein synthesis localized at the anterior pole, intracellular Bcd diffusion away from the source, and spatially uniform degradation by a first order reaction. If Bcd molecules diffuse throughout the embryo with diffusion constant D and are degraded with lifetime τ, the concentration of Bcd protein in this simple model obeys
| (5) |
The source is described as a boundary condition at the anterior pole (x = 0).
This model predicts the steady state concentration profile, and its principal virtue is that it produces the experimentally observed exponential decay, C(x) = C(0) exp(−x/λ), with . Steady state is reached, however, only after a time much greater than the protein lifetime τ, assuming (as observed) that the length constant λ is much smaller than the length of the embryo. Since we have no direct measurement of τ, it is more useful to say that the time required to reach steady state is τss ≫ λ2/D. The observed concentration profiles have λ ~ 100 μm, which means that to reach a steady state within 90 min requires that the diffusion constant of Bcd must be D ≫ 2 μm2/s. This is an order of magnitude larger than what we measure directly in photobleaching experiments (Figure 5), or what we infer indirectly from the dynamics of nuclear-cytoplasmic exchange (Figure 4D).
It could have been that the diffusion constants were slow, but that correspondingly the gradient did not reach steady state during the blastodermal stages of development. Alternatively, the apparent steady state behavior of the gradient for cycles 10 through 14 would not be surprising if diffusion constants were large. The paradox is that we observe both slow diffusion and the rapid establishment of a steady state. Simply put, the diffusion processes that we observe cannot be the ones which generate the steady state profile, because they are too slow.
There are, broadly speaking, three possible ways in which the paradox of slow diffusion and rapid arrival at the steady state could be resolved: Diffusion in the bulk of the embryo could be faster than we observe in the cortex, diffusion could be faster in the first hour after fertilization (where we were unable to measure Bcd), or the effective diffusion constants could be different on different time scales (~1 minute vs. ~1 hour) because of active transport mechanisms. These possibilities are discussed in the Supplemental Data.
Nuclear degradation and scaling of the Bcd gradient
Perhaps the most striking result in the present work is the dynamic exchange of Bcd from cytoplasm to nuclei. In cycle 14, the number of nuclei, the enhancement of cytoplasmic concentration near the cortex and the further enhancement of concentration above this in the nuclei all combine to mean that ~ 40% of the Bcd molecules in the entire embryo are localized in the nuclei (see Methods for details). Thus, rather than passively sampling a large excess of molecules in the cytoplasm, the nuclei must perturb the gradient significantly. In particular, it is natural to ask if events inside the nucleus could influence or even dominate Bcd degradation (Dhananjayan et al 2005; Collins & Tansey 2006). Although our results do not directly prove this assertion, it is intriguing that there is a smaller anterior to posterior ratio of Bcd concentration in unfertilized eggs than in fertilized eggs undergoing nuclear divisions. Driever and Nüsslein-Volhard (1988a) also noted a pronounced increase in Bcd concentration in unfertilized eggs after the first hour, which is consistent with our observations (data not shown).
What is particularly interesting about the possibility of nuclear involvement in degradation is that it can naturally solve the scaling problem. To illustrate how this can work, it is useful to consider an extreme (and admittedly unrealistic) model. Suppose that there is no degradation of Bicoid in the bulk of the embryo, but the degradation rate inside nuclei is so high that once molecules diffuse into the cortical layer of nuclei they never escape. Then rather than a model in which degradation is a specific term in the dynamics of the Bcd concentration, as in Equation (5), one can think of the degradation process as a boundary condition near the embryo surface. In this limit, no lifetimes or rate constants appear in the equations, and so the steady state is determined by balancing boundary conditions–a source at the anterior pole and a distributed ‘sink’ along the cortical surface. As a result, the steady state profile depends only on the geometry of the embryo itself and hence automatically scales as one considers embryos of different sizes.
As a more realistic model, imagine a two dimensional array of nuclei at positions near the embryo surface, and let us assume that degradation of protein within the nuclei occurs with lifetime τnuc, in contrast to the lifetime τ in the cytoplasm outside the nuclei. If τ ≫ τnuc, then almost all the degradation will happen in the nuclei, and the effective rate of degradation, averaged over some reasonable volume, can be shown to be proportional to the density of nuclei in that volume, τeff ∝ 1/ρnuc, so that the length constant . Importantly, the number of nuclei at a given cycle is constant across embryos of very different size (Gregor et al 2005), so that ρnuc = Nnuc/(Aℓ), where A is the surface area of the egg and ℓ is the thickness of the cortical layer (ℓ ~ 30 μm in cycle 14). Different size embryos from different flies seem to have similar aspect ratios, so we expect A ~ GL2, where G ~ 0.3 reflects this geometry. The result is that , so that is equivalent to λ ∝ L. Thus, if trapping of Bcd in the nuclei dominates the dynamics, and if nuclei are ordered in space and time as observed, then we have scaling automatically. Within this model, scaling is achieved because the number of nuclei is conserved in differently sized eggs, and hence the nuclear density is reduced in larger eggs.
One central problem of models in which the nuclei play an essential role is that the number of nuclei is changing, doubling every nine to twelve minutes during the crucial period of development. There is no evidence that the Bcd profile changes shape during this time. In the simplest view, if nuclear processes dominate the degradation of Bcd, then the effective lifetime should change by a factor of two with each successive cycle, thus changing the length constant λ by a factor of four from cycle 10 to 14. But this simple view breaks down if the other relevant parameters are changing. Over the course of these four doublings in the number of nuclei, the radius of the nuclei changes by nearly a factor of two (Figure 4C), and the thickness ℓ of the cortical layer changes by a factor of three (Foe et al 1993). In addition, the partitioning of Bcd molecules between the cortical layer and the interior bulk of the egg changes substantially (Figure 6D). In a coarse grained picture, if degradation is dominated by events inside the nuclei then the effective lifetime of a Bcd molecule in the embryo should depend on the fraction of molecules localized in nuclei; the different factors listed above in fact conspire so that this fraction remains constant across cycles 11 through 14, within the ~20% accuracy of our estimates (see Methods).
Perspective
Our earlier work (Gregor et al 2005) established that molecular motion in the embryo is described well by the diffusion equation on the time (~1 h) and space (~0.1 mm) scales of relevance for morphogenesis. The present work shows that diffusion is an equally good description of Bicoid transport on the scale of minutes and microns. The difficulty is that the relevant diffusion constants differ by more than an order of magnitude. To explain our observation that the Bcd gradient reaches a nuclear steady state very quickly we need the larger diffusion constants, but the dynamics of transport into and out of the nuclei are consistent with the smaller diffusion constant, which we also measure directly. We have discussed possible resolutions of this paradox, but new experiments will be required to decide which of these is correct.
The most dramatic qualitative feature the we see in watching the development of the embryos expressing Bcd-GFP is the filling and emptying of the nuclei. Quantitatively, this results in a startling juxtaposition of dynamics and stability. Thus, although Bcd concentrations vary in time over a factor of four during the course of a mitotic cycle, the nuclear concentration near the start of interphase is reproducible with ~10% accuracy from cycle to cycle. Although the number of nuclei is changing by a factor of 16 from cycle 10 to cycle 14, the total number of Bcd molecules that are localized in nuclei changes hardly at all. At our present level of understanding, both these examples of stability in the presence of change seem to be the result of cancellation among several independent processes, which is implausible. One way of summarizing the problem is that the simplest model looks like it works, but this is only because many parameters have been adjusted to make it work, leaving the simplest model as an effective description of the dynamics after the mechanisms responsible for this adjustment have done their job. This layer of mechanisms remains to be discovered. his read-out.
METHODS
Construction of P[egfp-bcd]
P[egfp-bcd] transcription is driven by known bcd enhancers upstream of the 5’ UTR and in the first intron. This transcript contains bcd’s natural 5’ and 3’ UTRs which are known to mediate the localization and translation of normal bcd mRNA. Thus by using the endogenous regulates of bcd transcription and translation, our construct was designed to be maternally expressed and localized to the anterior pole.
pNBGA1 containing a 6.5 kb D. melanogaster genomic fragment of the entire bcd gene, with the GFP coding region inserted directly upstream of and in frame with the first exon of bcd, was kindly provided by Tulle Hazelrigg (Hazelrigg et al 1998). This plasmid was digested with NheI and SphI to remove GFP and replace it with either eGFP generated by PCR from pStinger (Barolo et al 2000) using primers appended with NheI and SphI restriction sites. The resulting fusion gene was subsequently subcloned into the BamHI and EcoRI sites of pCaSpeR4 (Thummel & Pirrotta 1992) to generate P[egfp-bcd].
Fly transformation
We followed standard P-element transformation procedures (Spradling & Rubin 1982). We injected 0.4 mg/ml of construct DNA together with 0.1 mg/ml helper plasmid pTURBO, which expresses the transposase into D. melanogaster yw embryos. We scored several different P[egfp-bcd] insertions, including insertions on chromosomes I, II and X. Stocks were established for each of these.
Fly stocks and genetics
For all experiments with flies expressing egfp-bcd we used a stock with an X-chromosomal insertion of P[egfp-bcd]. For substitution of endogenous bcd we conducted the mutant crosses of egfp-bcd with bcdE1,pp/TM3,Sb to generate egfp-bcd;bcdE1,pp. Unfertilized eggs of Oregon R wild-type D. melanogaster flies and of bcdE1;egfp-bcd flies were produced using sterile males generated from C(1,Y),yB/0.
Immunostaining of embryos
All D. melanogaster embryos were collected at 25° C. Embryos expressing Bcd-GFP were formaldehyde fixed (for 20 min in 3.7% formaldehyde/PBS:heptane and devitellinized in heptane:methanol), all other embryos were heat fixed, and the eggs were subsequently labeled with fluorescent probes following previously published protocols (Wieschaus & Nüsslein-Volhard 1986). We used rat anti-Bcd and rabbit anti-HB antibodies, gifts of J. Reinitz (Kossman et al 1998), as well as guinea pig anti-GFP (Molecular Probes) and rabbit anti-GFP (Chemicon). Secondary antibodies were conjugated with Alexa-488, Alexa-546 and Cy5-647 (Molecular Probes). Nuclei were labeled with DNA probes YOYO1 or TOTO3 (Molecular Probes). Eggs were mounted in AquaPolymount (Polysciences, Inc.).
Cut-sections of fixed eggs
Heat-fixed embryos were embedded in 50% glycerol and hand-cut with a sharp razor blade. The embryos employed were stained with Bcd antibodies (see above), and the cut-sectons were imaged focussing at the top-most surface of the section. To exclude a misrepresentation of our experiment due to problems with permeabilization and antibody penetration into the embryo, we tested and quantified two versions of this experiment: in the first version we heat-fixed embryos, stained with Bcd antibodies and hand-cut the eggs after the staining procedure was completed; in the second version of the experiment we heat-fixed the embryos and hand-cut them before running the staining procedure. Both procedures led to the same quantitative results.
Imaging of fixed tissue by confocal microscopy
High-resolution digital images (1024 × 1024, 12 bits per pixel) of fixed eggs were obtained on a Zeiss LSM 510 confocal microscope with a Zeiss 20x (NA 0.45) A-plan objective. Images were focused at midembryo to avoid geometric distortion for gradient extraction experiments. For measurements of nuclear fluorescence intensities eggs were flattened with a cover slip to maximize the number of nuclei at the focal top surface.
Live imaging by two-photon microscopy
Living embryos were collected 0-15 minutes after egg deposition, dechorionated, glued onto a coverslip and immersed in halocarbon oil (Sigma-Aldrich) or dH2O. Two-photon microscopy (Denk et al 1990) was performed by using a custom-built scanning microscope similar in design to that of ref. (Svoboda et al 1997). Time-lapse image sequences were taken with a Zeiss Plan-Neofluar multi-immersion objective (25x, NA 0.8) and an excitation wavelength of 900–920nm, minimizing embryonic yolk autofluorescence. Average laser power at the specimen was between 10 and 30mW.
Photobleaching experiments
Bcd-GFP expressing embryos were mounted as described above. Photobleaching of individual nuclei was performed using our scanning two-photon microscope by reducing the scan-field 8-fold while keeping the laser power constant, effectively increasing the power per pixel 64-fold for a duration of 5 seconds. Subsequently the recovery curve was recorded in 0.5 sec time bins with the original scan-field, where the recording power has been adjusted to avoid further photobleaching. The bleach-volume (8 × 8 × 7 μm3) generated with the 25x (NA 0.8) Zeiss Plan-Neofluar multi-immersion objective was measured separately, using fluorescently-labeled 40kD-dextran dH2O solution, diluted in polyethylene. Cytoplasmic photobleaching was performed by rapid modulation of the beam with a KDP* Pockels Cell (model 350-50; Conoptics, Danbury, CT) to generate the bleaching and monitoring intensities (Axelrod et al 1976). In these experiments the power modulation at the specimen was 2-fold, the bleach pulse was 6 s, and the bleach-volume was 16 × 16 × 7 μm3. Data was fitted to the exact solution of the 3d-diffusion equation (Brown et al 1999).
Profile quantification
Bcd protein profiles were extracted from images of stained embryos using software routines (MATLAB, MathWorks, Natick, MA) that allowed a circular window of the size of a nucleus to be systematically moved along the outer edge of the embryo (Houchmandzadeh et al 2002). At each position, the average pixel intensity within the window was plotted versus the projection of the window center along the AP-axis of the embryo. Measurements of the Bcd concentration were made separately along the dorsal and ventral sides of the embryo. All embryos were prepared, and images were taken under the same conditions: (i) all embryos were formaldehyde fixed for 20 min, (ii) embryos were stained and washed together in the same tube, and (iii) all images were taken with the same microscope settings in a single acquisition cycle.
Comparing gradients of antibody staining and GFP fluorescence
Gradients of double stained embryos expressing Bcd-GFP were compared in a scatter plot with the different gradient visualization methods (antibody against Bcd, antibody against GFP and endogenous GFP fluorescence) on each axis. Scatter plots of gradients of identical shape should should only have data points on the diagonal. We tested this method for comparing intensity profiles using artificially generated distributions of gradients with different mean shapes, and we obtained significant power-law dependencies for distributions that differed by more than 4% of their mean – the mean is characterized by the average length constant of artificially-generated, exponentially decaying intensity profiles.
Fraction of Bcd molecules in nuclei
To estimate the relative number of Bcd molecules in nuclei, cortical cytoplasm and the core of an embryo of length L ~ 490 μm, we consider a cross-sectional slice of thickness Δx with volume Vtot = πR2Δx, where R ~ 90 μm is the radius of the slice (see Figure 6A). The number of nuclei in the slice is given by (N/L)Δx, where N is the total number of nuclei in the embryo, typically ~ 6000 during nuclear cycle 14; hence the total nuclear volume is , with nuclear radius rn (see Figure 4C for values). The core volume is given by Vcore = π(R − ℓ)2Δx with ℓ being the thickness of the cortical cytoplasm. The relative number of Bcd molecules in nuclei, cortical cytoplasm and the core of an embryo are then respectively given by ncore = CcoreVcore, nnuc = CnucVnuc and ncort.−cyt. = Ccort.−cyt.(Vtot − Vcore − Vnuc), with core, nuclear and cortical Bcd concentrations Ccore, Cnuc and Ccort.−cyt., respectively. Finally, the fraction of Bcd molecules in the nuclei is given by
| (6) |
To estimate fnuc for nuclear cycles 11 to 14, we use cortical thicknesses ℓ of 11 μm, 15 μm, 24 μm and 31 μm, respectively (Foe et al 1993). Reading the respective concentrations and nuclear radii from our data (see Figures 6D and 4C), we obtain fractional nuclear Bcd molecules of 33%, 39%, 41%, 41% for nuclear cycles 11 to 14, respectively. Our estimated accuracy on these values is ~ 20%.
Supplementary Material
Acknowledgments
We thank N. Bisaria, M. Coppey, J. Drocco, T. Hazelrigg, J. Kinney, R. Samantha and G. Tkačik. This work was supported in part by the MRSEC Program of the National Science Foundation under Award Number DMR-0213706, and by NIH grants P50 GM071508 and R01 GM077599.
Footnotes
Publisher's Disclaimer: This is a PDF file of an unedited manuscript that has been accepted for publication. As a service to our customers we are providing this early version of the manuscript. The manuscript will undergo copyediting, typesetting, and review of the resulting proof before it is published in its final citable form. Please note that during the production process errors may be discovered which could affect the content, and all legal disclaimers that apply to the journal pertain.
References
- Ariizumi T, Asashima M. Control of the embryonic body plan by activin during amphibian development. Zoolog Sci. 1995;12:509–521. doi: 10.2108/zsj.12.509. [DOI] [PubMed] [Google Scholar]
- Axelrod D, Koppel DE, Schlessinger J, Elson E, Webb WW. Mobility measurement by analysis of fluorescence photobleaching recovery kinetics. Biophys J. 1976;16:1055–1069. doi: 10.1016/S0006-3495(76)85755-4. [DOI] [PMC free article] [PubMed] [Google Scholar]
- Barolo S, Carver LA, Posakony JW. GFP and beta-galactosidase transformation vectors for promoter/enhancer analysis in Drosophila. Biotechniques. 2000;29:726–732. doi: 10.2144/00294bm10. [DOI] [PubMed] [Google Scholar]
- Berg HC, Purcell EM. Physics of chemoreception. Biohys J. 1977;20:193–219. doi: 10.1016/S0006-3495(77)85544-6. [DOI] [PMC free article] [PubMed] [Google Scholar]
- Brown EB, Wu ES, Zipfel W, Webb WW. Measurement of molecular diffusion in solution by multiphoton fluorescence photobleaching recovery. Biophys J. 1999;77:2837–2849. doi: 10.1016/S0006-3495(99)77115-8. [DOI] [PMC free article] [PubMed] [Google Scholar]
- Collins GA, Tansey WP. The proteasome: a utility tool for transcription? Curr Opin Genet Dev. 2006;16:197–202. doi: 10.1016/j.gde.2006.02.009. [DOI] [PubMed] [Google Scholar]
- Crick F. Diffusion in embryogenesis. Nature. 1970;225:420–422. doi: 10.1038/225420a0. [DOI] [PubMed] [Google Scholar]
- Denk W, Strickler JH, Webb WW. Two-photon laser scanning fluorescence microscopy. Science. 1990;248:73–76. doi: 10.1126/science.2321027. [DOI] [PubMed] [Google Scholar]
- Dhananjayan SC, Ismail A, Nawaz Z. Ubiquitin and control of transcription. Essays Biochem. 2005;41:69–80. doi: 10.1042/EB0410069. [DOI] [PubMed] [Google Scholar]
- Driever W, Nüsslein-Volhard C. A gradient of Bicoid protein in Drosophila embryos. Cell. 1988a;54:83–93. doi: 10.1016/0092-8674(88)90182-1. [DOI] [PubMed] [Google Scholar]
- Driever W, Nüsslein-Volhard C. The Bicoid protein determines position in the Drosophila embryo. Cell. 1988b;54:95–104. doi: 10.1016/0092-8674(88)90183-3. [DOI] [PubMed] [Google Scholar]
- Ephrussi A, St Johnston D. Seeing Is Believing: The Bicoid Morphogen Gradient Matures. Cell. 2004;116:143–152. doi: 10.1016/s0092-8674(04)00037-6. [DOI] [PubMed] [Google Scholar]
- Fersht A. Enzyme structure and mechanism. San Francisco, CA: Freeman; 1985. [Google Scholar]
- Foe VE, Odell GM, Edgar BA. Mitosis and morphogenesis in the Drosophila embryo: point and counterpoint. In: Bate M, Martinez-Arias A, editors. The Development of Drosophila. Plainview, NY: Cold Spring Harbor Laboratory Press; 1993. [Google Scholar]
- Gregor T, Bialek W, de Ruyter van Steveninck RR, Tank DW, Wieschaus EF. Diffusion and scaling during early embryonic pattern formation. Proc Nat’l Acad Sci (USA) 2005;102:18403–18407. doi: 10.1073/pnas.0509483102. [DOI] [PMC free article] [PubMed] [Google Scholar]
- Hazelrigg T, Liu N, Hong Y, Wang S. GFP expression in Drosophila tissues: time requirements for formation of a fluorescent product. Developmental Biology. 1998;199:245–249. doi: 10.1006/dbio.1998.8922. [DOI] [PubMed] [Google Scholar]
- Hodgkin AL, Keynes RD. Movements of labelled calcium in giant axons. J Physiol (Lond) 1957;138:253–281. doi: 10.1113/jphysiol.1957.sp005850. [DOI] [PMC free article] [PubMed] [Google Scholar]
- Houchmandzadeh B, Wieschaus E, Leibler S. Establishment of developmental precision and proportions in the early Drosophila embryo. Nature. 2002;415:798–802. doi: 10.1038/415798a. [DOI] [PubMed] [Google Scholar]
- Kiseleva E, Rutherford S, Cotter LM, Allen TD, Goldberg MW. Steps of nuclear pore complex disassembly and reassembly during mitosis in early Drosophila embryos. J Cell Sci. 2001;114:3607–3618. doi: 10.1242/jcs.114.20.3607. [DOI] [PubMed] [Google Scholar]
- Kossman D, Small S, Reinitz J. Rapid preparation of a panel of polyclonal antibodies to Drosophila segmentation proteins. Dev Genes Evol. 1998;208:290–298. doi: 10.1007/s004270050184. [DOI] [PubMed] [Google Scholar]
- Kubitscheck U, Grunwald D, Hoekstra A, Rohleder D, Kues T, Siebrasse JP, Peters R. Nuclear transport of single molecules: dwell times at the nuclear pore complex. J Cell Biol. 2005;168:233. doi: 10.1083/jcb.200411005. [DOI] [PMC free article] [PubMed] [Google Scholar]
- Lacalli TC, Harrison LG. From gradient to segments: models for pattern formation in early Drosophila. Semin Dev Biol. 1991;2:107–117. [Google Scholar]
- Lawrence PA. The Making of a Fly: The Genetics of Animal Design. Blackwell Scientific; Oxford: 1992. [Google Scholar]
- Struhl G, Struhl K, Macdonald PM. The gradient morphogen Bicoid is a concentration-dependent transcriptional activator. Cell. 1989;57:1259–1273. doi: 10.1016/0092-8674(89)90062-7. [DOI] [PubMed] [Google Scholar]
- Thummel CS, Pirrotta V. New pCaSpeR P element vectors. Dros Info Serv. 1992;71:150. [Google Scholar]
- Tsien RY. The green fluorescent protein. Annu Rev Biochem. 1998;67:509–544. doi: 10.1146/annurev.biochem.67.1.509. [DOI] [PubMed] [Google Scholar]
- Spradling AC, Rubin GM. Transposition of cloned P-elements into Drosophila germ line chromosomes. Science. 1982;218:341–347. doi: 10.1126/science.6289435. [DOI] [PubMed] [Google Scholar]
- Svoboda K, Denk W, Kleinfeld D, Tank DW. In vivo dendritic calcium dynamics in neocortical pyramidal neurons. Nature. 1997;385:161–165. doi: 10.1038/385161a0. [DOI] [PubMed] [Google Scholar]
- Wieschaus E, Nüsslein-Volhard C. Looking at embryos. In: Roberts DB, editor. Drosophila, a Practical Approach. Oxford, England: IRL Press; 1986. [Google Scholar]
- Wolpert L. Positional information and the spatial pattern of cellular differentiation. J Theor Biol. 1969;25:1–47. doi: 10.1016/s0022-5193(69)80016-0. [DOI] [PubMed] [Google Scholar]
- Zecca M, Basler K, Struhl G. Sequential organizing activities of engrailed, hedgehog and decapentaplegic in the Drosophila wing. Development. 1995;121:2265–2278. doi: 10.1242/dev.121.8.2265. [DOI] [PubMed] [Google Scholar]
Associated Data
This section collects any data citations, data availability statements, or supplementary materials included in this article.