

Abstract
Directed embryonic stem (ES) cell differentiation is a potentially powerful approach for generating a renewable source of cells for regenerative medicine. Typical in vitro ES cell differentiation protocols involve the formation of ES cell aggregate intermediates called embryoid bodies (EBs). Recently, we demonstrated the use of poly(ethylene glycol) (PEG) microwells as templates for directing the formation of these aggregates, offering control over parameters such as size, shape, and homogeneity. Despite these promising results, the previously developed technology was limited as it was difficult to reproducibly obtain cultures of homogeneous EBs with high efficiency and retrievability. In this study, we improve the platform by optimizing a number of features: material composition of the microwells, cell seeding procedures, and aggregate retrieval methods. Adopting these modifications, we demonstrate an improved degree of homogeneity of the resulting aggregate populations and establish a robust protocol for eliciting high EB formation efficiencies. The optimized microwell array system is a potentially versatile tool for ES cell differentiation studies and high-throughput stem cell experimentation.
Introduction
Embryonic stem (ES) cells hold therapeutic potential as renewable source of cells in tissue engineering and regenerative medicine [1, 2]. ES cells are characterized by the capacity to differentiate into specific tissue lineages in response to temporally and spatially regulated extrinsic and intrinsic signals [1, 3, 4]. Recent work has interrogated protocols for directing ES cell fate in vitro [5–12]. Typical ES cell differentiation protocols involve the formation of embryoid bodies (EBs)--structures which recapitulate features of early embryonic development and give rise to a wide spectrum of cell types [13–16]. EBs are usually formed using the hanging drop method [16, 17] or in suspension culture [15]. The hanging drop method permits some control over EB size, but these cultures are cumbersome and not suitable for scale-up. Although suspension culture has advantages in that it is easily scalable and requires little expertise, the resulting EBs are heterogeneous in size and shape [18, 19]. It is known that ES cell differentiation is affected by microenvironmental stimuli that directly or indirectly depend on EB size [4, 18, 20]. Such environmental stimuli comprise cell-cell, cell-extracellular matrix (ECM), and cell-soluble factor interactions as well as other physicochemical factors including temperature, pH, and oxygen availability. Since these parameters can be functions of EB size, cell populations obtained from suspension culture EBs can vary dramatically—even when they were cultured under identical conditions [21]. To uniformly direct EB differentiation, microenvironmental stimuli must be precisely controlled by homogenizing EB parameters such as size and shape.
To overcome the challenges associated with traditional EB culture techniques, a variety of approaches have been developed. For example, stirred vessel bioreactors have been used to improve EB homogeneity [12, 19, 22]. Also, encapsulation of EBs in agarose capsules and the use of E-cadherin-blocking antibodies have been employed to reduce agglomeration of EBs in stirred cultures [23]. Rotary shakers have also been used to provide constant circular motion to suspension cultures, resulting in improved EB homogeneity [24, 25]. However, ES cell proliferation, viability, and aggregation are sensitive to hydrodynamic forces and shear stresses [26].
An ideal system for directing ES cell differentiation would provide uniform microenvironments to EBs while also being amenable to large scale culture. Such a system should allow for in situ analysis, but EBs should also be accessible for further experimentation. Ideally, such a platform would also be simple, inexpensive, and applicable in standard biological laboratories.
We have previously developed a microfabricated platform of poly(ethylene glycol) (PEG) microwell arrays that showed advantages over suspension culture in controlling size, shape and homogeneity of EB populations [27]. This system can be integrated into microfluidic platforms to enable high-throughput experimentation [28]. However, our initial approach had drawbacks in that cells often adhered to the microwells and cell seeding and EB retrieval yields were suboptimal.
In this study, we develop an optimized microwell platform. We enhance the cell-repellent properties of the microwell substrate and establish robust seeding procedures and aggregate retrieval methods. We also use computational simulations to guide selection of microwell geometry. Using our array system, we are able to grow large populations of cell aggregates that are both homogenous and easily retrievable.
Materials and Methods
Master fabrication
Photomasks were designed using the layout editor software CleWin Version 2.8 (WieWeb Software, Hengelo, Netherlands) and printed on Mylar™ clear films at Fineline Imaging Inc. (Colorado Springs, CO) with a high plot resolution of 20,230 dpi. Patterns of microwells with 50, 75, 100, 150 and 175 μm diameters were created on silicon wafers. The wafers were cleaned and spin coated with hexamethyldisilizane (Arch Chemical Industries, Norwalk, CT ) adhesion promotor before the permanent epoxy negative photoresist SU-8 2025 (MicroChem Corp., Newton, MA) was deposited. Spin coating was performed at 4000 rpm, yielding the desired film thickness of 20 μm. Wafer were softbaked at 65°C for 3 min, followed by a second softbaking at 95°C for 6 min. For crosslinking of the photoresist, the coated wafers were exposed to UV light of 350–400 nm for 90 s through a photomask. Subsequently, wafers were post-exposure baked at 65°C for 1 min and then at 97°C for 6 min. The photoresist-patterned silicon master was developed using SU-8 developer, rinsed with isopropyl alcohol for 10 s, and air dried with pressurized nitrogen. The pattern and depth of the microwells was analyzed using a Dektak surface profiler (Veeco Instruments, Santa Barbara, CA).
PDMS-stamp fabrication
Poly(dimethylsiloxane) (PDMS) molds were fabricated by curing a 10:1 mixture of silicone elastomer base solution and curing agent Sylgard 184 (Dow Corning Corporation, Midland, MI) on a silicon master patterned with SU-8 photoresist. The PDMS elastomer solution was degassed for 15 min in a vacuum chamber and cured at 70 °C for 2 h before the PDMS molds were peeled from the silicon masters. The generated PDMS replicas had patterns corresponding to the silicon master with protruding columns and were subsequently used for molding of PEG microwells.
Microwell fabrication
Non-adhesive microwells were fabricated using micromolding on UV-photocrosslinkable polyethylene glycol diacrylate and methacrylate (PEG-DA and PEG-MA) (Sigma-Aldrich Co., St. Louis, MO and Monomer-Polymer & Dajac Labs, Inc., Feasterville, PA) of different average molecular weights (MW) (258, 330, 575 and 1000 Da) mixed in a 1% (w/w) ratio of the photoinitiator 2-hydroxy-2-methyl propiophenone (Sigma-Aldrich Co., St. Louis, MO). Glass substrates were treated with 3-(Trimethoxysilyl) propylmethacrylate (TMSPMA) (Sigma-Aldrich Co., St. Louis, MO) for 5 min and baked at 70°C for 1 h. A patterned PDMS stamp was placed on an evenly distributed film of PEG monomer solution on a glass support and then photocrosslinked by exposure to light of 350–500 nm wavelength for 16 seconds at an intensity of 100 mW/cm2 using the OmniCure® Series 2000 curing station (EXFO, Mississauga, Canada). After polymerization, the PDMS stamp was peeled from the substrate. The stability of microwells micromolded on treated and untreated glass slides was assessed by incubating microarrays in Dulbecco’s phosphate-buffered saline (PBS) and analyzing the integrity of the arrays over time. In all cases, 1% photoinitiator was added and dilutions were made in PBS. Experiments performed to assess array stability were conducted in triplicates.
Murine ES cell culture
Pluripotent murine ES cells (R1 strain) [29] were manipulated under tissue culture hoods and maintained in a humidified incubator at 37°C with a 5% CO2 atmosphere. All tissue culture components were purchased from Gibco-Invitrogen Corporation (Carslbad, CA) unless otherwise indicated. Culture medium for maintenance of ES cells consisted of knockout Dulbecco’s modified Eagles medium (DMEM) supplemented with 15% (v/v) ES qualified Fetal Bovine Serum (FBS), 1% (v/v) non-essential amino acid solution MEM NEAA, 1 mM L-glutamine, 0.1 mM 2-Mercaptoethanol and 103 U/ml mouse leukemia inhibitory factor (LIF), ESGRO® (Chemikon Int. Inc., Eugene, OR). Cells were kept undifferentiated by changing media daily and passaging every 2 days with a subculture ratio of 1:4. Tissue culture plates (T75) were treated with 0.1% gelatin in distilled water and incubated for 24 h. For EB formation, LIF was omitted from the medium and ES cells were allowed to differentiate either in suspension culture using non-tissue culture treated dishes without gelatin coating or by seeding cells onto non-adherent PEG microwells arrays.
Protein adsorption
Fluorescein isothiocyanate (FITC) conjugated bovine serum albumin (BSA) was dissolved in PBS at 100 μg/ml. To test protein adsorption to PEG hydrogels made from macromers with different average MW (PEG 258, PEG 330, PEG 575 and PEG 1000), 50 μL of the protein solution were evenly distributed on the surfaces and incubated for 20 min at room temperature in the dark. After incubation, samples were washed twice in PBS and analyzed under an inverted fluorescent microscope (Nikon Eclipse TE2000-U). Fluorescent images were analyzed using ImageJ software. Pixel intensities were averaged for ten image fields for each of three independent experiments. Intensities were normalized to a glass control. Non FITC-BSA stained surfaces served as negative controls.
Cell adhesion
PEG hydrogels of different average MW (PEG 258, PEG 330, PEG 575 and PEG 1000) were polymerized on glass slides and analyzed for cell adhesion. ES cells were trypsinized and seeded at a density of 1.8 × 10² cells/mm2 onto the PEG surfaces, glass, non-tissue culture treated polystyrene and gelatin-coated polystyrene. After incubation at 37°C for 3 h, the slides were dipped into PBS to remove non-adherent cells. Ten random images were taken on each surface and adherent cells were counted. Results were normalized to the glass control. Experiments were performed in triplicates.
Formation of EBs within microwells
PEG microwells were washed in PBS and then disinfected with 70% (v/v) ethanol. Due to the low surface tension of ethanol, air bubbles trapped in the microwells were also removed in this step (trapped bubbles prevent cells from settling inside the microwells). Ethanol was diluted with PBS and aspirated multiple times before differentiation media was added. Undifferentiated ES cells grown in monolayer were washed, trypsinized for 3 min, resuspended in media without LIF, counted with a hemacytometer, and then plated onto the PEG microwell arrays. Cells were seeded at desired densities and allowed to settle into the microwells for one hour before the arrays were washed by applying a gentle flow to remove undocked cells. Seeded microwells were cultured at 37 °C and 5% CO2 and fed with medium without LIF every 3–4 days.
Analysis of EB homogeneity
To quantify diameter homogeneity of EB populations, we seeded arrays with cells at a density of 4 × 10² cells/mm2. Images were taken at days 3 and 6, and the diameters of 600 randomly selected aggregates were measured using ImageJ software. As a control, ES cells were grown in suspension culture on non-tissue culture treated Petri dishes with the same seeding density. Measured diameters were categorized in intervals of 5 μm and their relative frequencies were calculated and plotted. Experiments were conducted in triplicates.
Cell viability analysis
Cell viability was assessed using a LIVE/DEAD® viability kit (Molecular Probes Inc., Eugene, OR) according to the manufacturer’s instructions. Cells were incubated in 4 μM ethidium homodimer (EthD) and 2 μM calcein-AM in PBS for 10 min at 37°C. Live cells stained green due to enzymatic conversion of the nonfluorescent cell-permeant calcein-AM to fluorescent calcein. Dead cells stained red after binding of EthD to the DNA of membrane-compromised cells. Fluorescent cells were visualized with appropriate filters under an inverted microscope (Nikon Eclipse TE2000-U).
Aggregate retrieval efficiencies
EB harvesting from PEG 258 and PEG 1000 microwell arrays was compared. To control microwell array geometry, microwell arrays were molded from the same PDMS stamps, and PEG microwell depths were confirmed using optical measurement. Microwell arrays were seeded in a single 6 well plate and the number of EBs in each array was counted. At day 6, the arrays were inverted and gently agitated. Aggregates remaining inside the PEG 258 and PEG 1000 microwells after inversion and agitation were counted and the percentages of retrieved aggregates were compared. Experiments were performed in triplicates.
Statistical analysis
Statistical analyses were performed using a Student’s t-test (two-sided) with p < 0.05 considered statistically significant. For statistical analysis of EB sizes, a two-sided F-test was used to determine whether diameter distributions manifested different variances (and therefore different degrees of diameter heterogeneity).
Optimization of seeding density
ES cells grown in monolayer were trypsinized and counted with a hemacytometer. Cells were then seeded onto microwell arrays at various seeding densities and allowed to settle for 1 h. The number of cells settled within 150 randomly chosen microwells was manually counted at 40X magnification. Aggregate formation efficiency was computed as the percentage of wells containing an aggregate (n > 500). All experiments were performed in triplicates.
Shear stress simulations
Fluid flow over the microwells can be mathematically modeled using the Navier-Stokes equations for an incompressible fluid:
| (1) |
| (2) |
Where u is the velocity vector, ρ is the density, μ is the dynamic viscosity of the fluid medium, and p denotes pressure at a given point within the fluid domain. We assumed steady flow rates over the top surface of the microwells and no slip-conditions at the microwell walls. Finite element analysis was performed using COMSOL-Multiphysics 3.2 software (COMSOL, Inc., Los Angeles, CA). The partial differential equations were solved by matrix elimination using a linear predictor. A denser mesh was used for the surface to capture fine features of shear stress variation, and an overall minimum element quality of 0.31 was maintained.
Results
Microwell fabrication
Arrays were molded according to the steps outlined in Figure 1 A. Microwells of various diameters (50, 75, 100, 150 and 175 μm) were fabricated from photocrosslinked PEG of different average MWs (258, 330, 575 and 1000) (Figure 1 B). The well depth was kept at ~20 μm to facilitate aggregate retrieval and to minimize vertical diffusion limitations. To prevent cellular interaction with the underlying glass substrate, the entire array surface was engineered from PEG (Figure 1 B).
Figure 1.

Fabrication of a microwell array for EB culture. (A) Schematic representation of the micromolding process to generate a PEG microwell array from a photocrosslinkable PEG-DA prepolymer solution (brown). PEG was molded using a PDMS stamp with protruding features and then photocrosslinked with UV light. The cross-section shows a microwell array loaded with ES cells. (B) Phase contrast images show a 50 μm microwell before and after seeding. Higher magnification of a 175 μm microwell that was cut vertically shows that the entire microwell surface—including the well bottom—was made of PEG. In culture, EBs grew until they were constrained by the size of the well, yielding a homogeneous culture (upper image). In the previously developed platform, nonspecific cell adhesion led to monolayer formation (lower image). All scale bars represent 100 μm.
Cell adhesion and protein adsorption on different PEG surfaces
Photocrosslinkable PEG microstructures have variable properties depending on the MW of their individual macromers (average chain lengths). To guide selection of our hydrogen composition, we evaluated the resistance of PEGs of various MWs to ES cell adhesion and protein adsorption. We found that cell adhesion to PEG was lower than to gelatin treated polystyrene and non-tissue culture treated polystyrene (Figure 2 A), which are used for ES cell culture and EB suspension culture, respectively. Protein adsorption on PEG was also significantly lower than adsorption on gelatin, glass, and non-tissue culture treated polystyrene (Figure 2 B). Furthermore, the resistance of PEG to protein adsorption and cell adhesion correlated with increasing average MW. Given these findings, we hypothesized that high MW PEG formulations would be most suitable as a microwell substrate. Our results also confirm that PEG surfaces are sufficiently non-adhesive to model suspension culture conditions.
Figure 2.
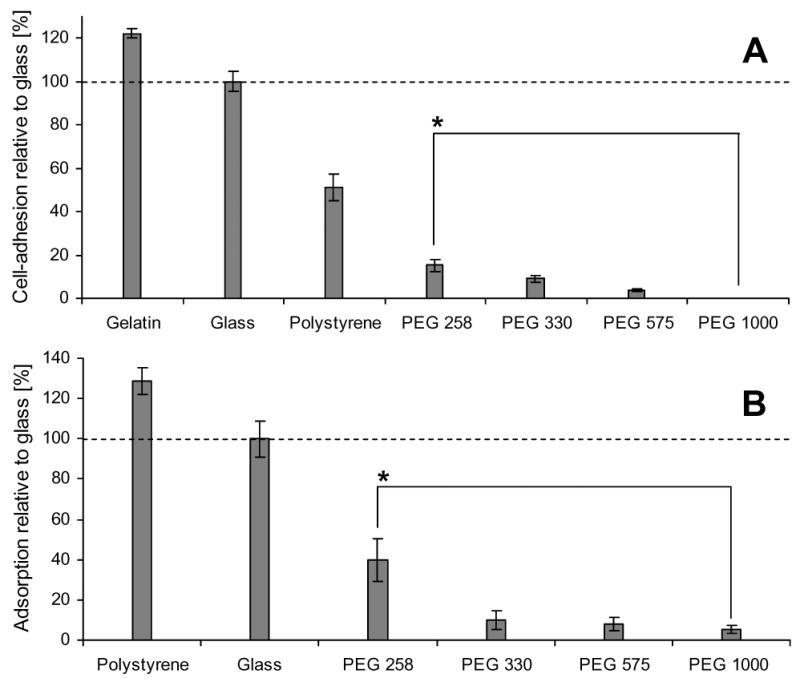
Cell adhesion and protein adsorption of various substrates. (A) Adhesion of ES cells on PEG hydrogels of different molecular weights (MWs), non-tissue culture treated polystyrene, and gelatin treated polystyrene after 3 hours of incubation (normalized to the glass control). PEG of higher MW showed less cell adhesion, with PEG 1000 being the most cell-repellent. (B) Protein adsorption to various MW PEG surfaces. Adsorption of FITC-coupled BSA was indirectly measured by quantifying fluorescent intensities relative to a glass control. Non-tissue culture treated polystyrene showed much higher protein adsorption than did PEG hydrogels. Protein adsorption of PEG hydrogels decreased with increasing MW. For both experiments, PEG 258 and PEG 330 were cured from 99% (w/w) PEG solutions. PEG 575 and PEG 1000 were highly hydrated polymers containing 20% PEG in PBS. (* indicates p < 0.05)
Stability of PEG microwell arrays
Approximately 30% of the PEG 258 microwell arrays did not remain stable on untreated glass supports when incubated in PBS for 3 days. Arrays were designated as “unstable” if they detached from the underlying glass substrate. To increase the integrity of the polymer-glass interface, glass substrates were acrylated using TMSPMA. This surface treatment introduced terminal acrylate functional groups on the glass, providing anchor sites for the PEG acrylates. Indeed, TMSPMA treatment increased the stability of PEG 258 and PEG 330 microwells to 100% (Figure 3 A, B). It was not, however, sufficient to maintain the stability of PEG 575 and PEG 1000 arrays. These arrays detached by day 3 of incubation. (Figure 3 B). We then diluted the PEG prepolymer solutions to concentrations from 10–80% (w/w) in PBS, observing that PEG 575 arrays remained stable at PEG concentrations of ≤ 50% (Figure 3 C) and PEG 1000 arrays at concentrations of ≤ 20% (Figure 3 D).
Figure 3.
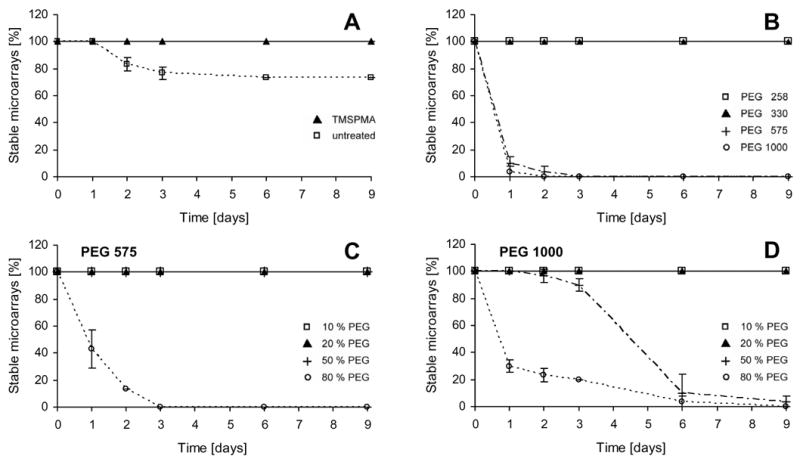
Stability of PEG microwell arrays. Arrays were incubated in PBS and their stability was analyzed over time. (A) PEG 258 arrays were more stable when the glass substrate was treated with TMSPMA. (B) Arrays made from PEG of higher MW detached even when the glass substrates were acrylated with TMSPMA. (C) Hydrated PEG 575 prepolymer solutions containing 10, 20, 50 and 80% (w/w) PEG were analyzed, and dilute solutions (PEG ≤ 50%) remained stable. (D) PEG 1000 microwell arrays remained stable for highly hydrated prepolymer solutions (PEG ≤ 20%).
Analysis of homogeneity of EB populations
ES cells were seeded onto PEG 575 and PEG 1000 arrays with microwells of each of two diameters: 50 and 150 μm. For each combination of microwell size and PEG formulation, the distribution of EB diameters was tracked over 6 days. Nonspecific cell adhesion to the PEG substrate was frequently observed on PEG 258 arrays. Such adhesion resulted in EB outgrowth and the fusion of neighboring EBs (Figure 4), leading to wide day 6 diameter distributions. In contrast, EBs cultured on PEG 1000 arrays were homogeneously constrained to the microwells (Figure 5). An F-test confirmed improved homogeneity of EB populations in PEG 1000 microwell arrays with respect to PEG 258 microwell arrays at day 6 (p < 1 × 10⁻¹⁰ for both the 50 and 150 μm cases).
Figure 4.
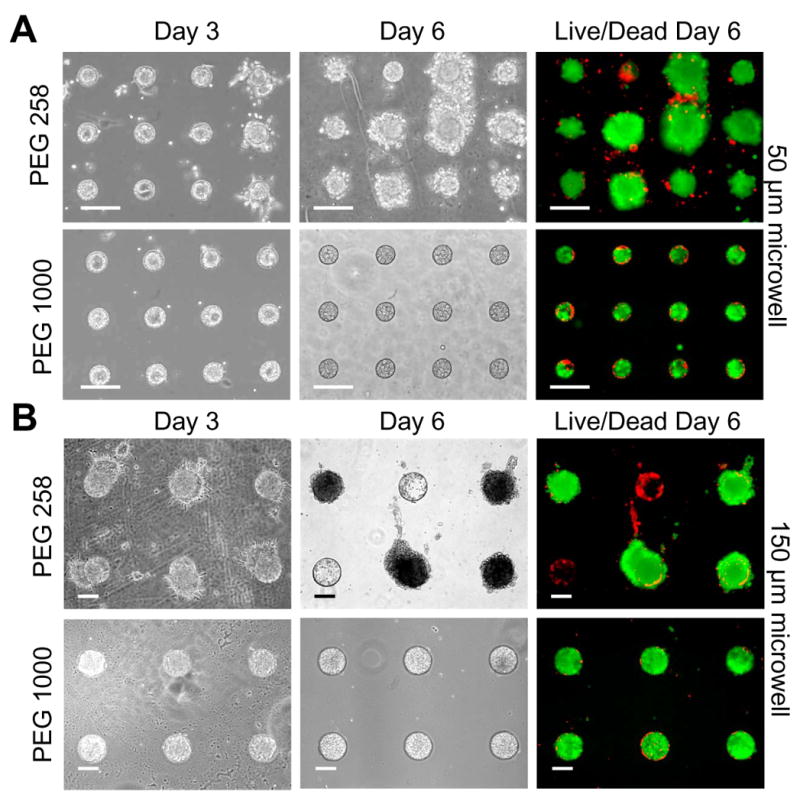
Aggregates grown in PEG 258 and PEG 1000 microwells after 3 and 6 days of culture. (A) Aggregates grown in 50 μm diameter wells. Significant overgrowth was observed by day 6 of culture on PEG 258. In contrast, aggregates in the PEG 1000 arrays were uniform and remained constrained to the microwells. (B) Aggregates grown in 150 μm microwells. LIVE/DEAD assays on day 6 show that EBs remained viable within the microstructures. All scale bars correspond to 100 μm.
Figure 5.
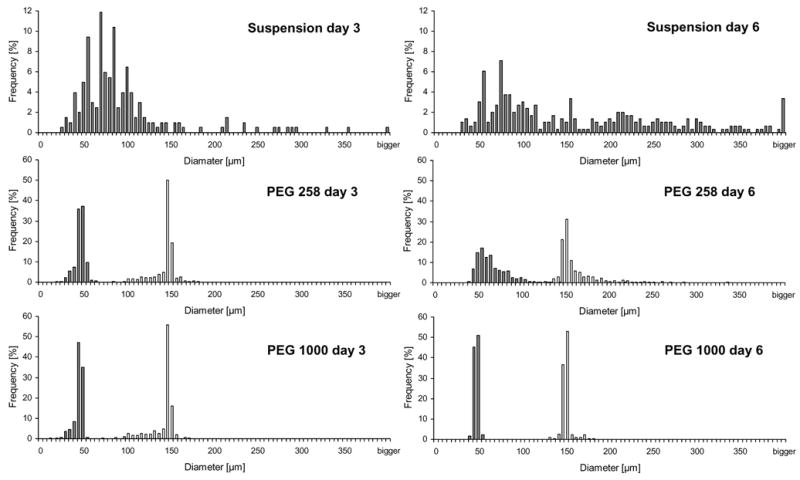
Quantitative analysis of aggregate diameter distributions shows improved homogeneity associated with growth on PEG 1000 arrays. The relative frequencies of diameters obtained in 50 and 150 μm microwells are shown in gray and white, respectively. For all experiments, the diameters of formed aggregates were measured on days 3 and 6 (n > 600). Suspension cultures yielded a wide distribution of diameters. EBs formed in microwells were more homogeneous. Comparison of PEG 258 and PEG 1000 reveals that EB populations generated in arrays made from PEG 1000 were more uniform.
Aggregate retrieval efficiencies
Employing our basic gravity- and agitation-driven retrieval method, we noted significantly higher retrieval efficiencies from PEG 1000 arrays than from PEG 258 arrays (Figure 6); we applied comparable stresses yet retrieved 20% more aggregates from the 50 μm microwells and 25% more aggregates from 150 μm microwells (Figure 6 A, D). Interestingly, retrieval efficiencies were size dependant—larger EBs were retrieved with higher yields. For PEG 1000 arrays, our retrieval method permitted the capture of more than 80% of the EBs from 150 μm microwells and more than 30% from 50 μm microwells (Figure 6 A, D). When higher stresses were generated by applying fluid flow, 100% of the aggregates could be retrieved in both cases. However, retrieval from PEG 1000 arrays was easier, allowing for application of gentler methods. LIVE/DEAD assays on retrieved 50 and 150 μm aggregates demonstrated that EBs remained viable after harvesting (Figure 6 B, C, E, F).
Figure 6.
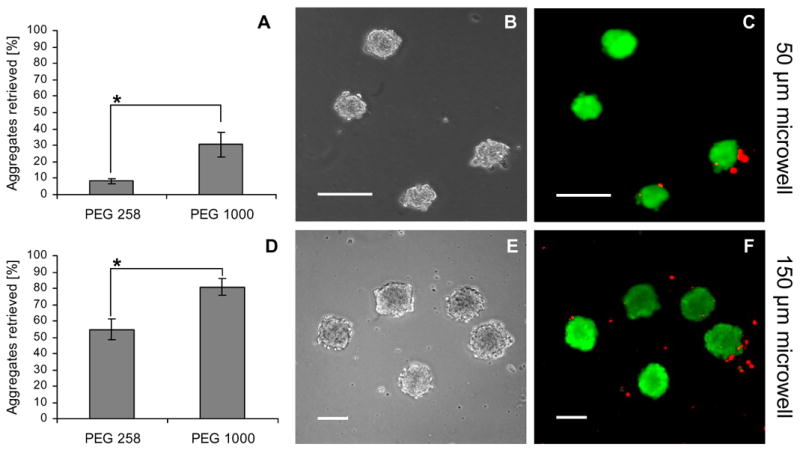
Retrieval of ES cell aggregates from PEG microwells. A comparison of retrieval yields from 50 μm (A) and 150 μm (D) microwells showed significantly higher retrieval efficiencies with PEG 1000 microwells. Phase and fluorescent images after applying a LIVE/DEAD assay to EBs from a 50 μm (B,C) and a 150 μm (E,F) PEG 1000 microwell array confirm that the EBs are viable after retrieval. Scale bars correspond to 100 μm. (* indicates p < 0.05)
Optimization of seeding density
Arrays were seeded with cells at various densities to establish a robust and reproducible protocol to dock cells into the microwells (Figure 7). At low seeding densities, the number of cells settled per well was often insufficient to yield an EB. Increasing the seeding density resulted in stochastic docking of cells into the microwells with more microwells achieving the critical cell density needed for aggregate formation. Higher seeding densities also increased the number of excess cells that settled around the microwells (Figure 7 A). We found that microwells of 20 μm depth saturated at a seeding density of ~4 × 10² cells/mm2 with an average number of 7.5 and 70 cells in 50 and 150 μm diameter wells, respectively. The number of resultant EBs correlated with seeding density but could not be increased when the density exceeded 4 × 10² cells/mm2, which was designated as our “optimal” seeding density. The corresponding maximal aggregate formation frequency was ~60% for microwells of both geometries (Figure 7 B, C).
Figure 7.
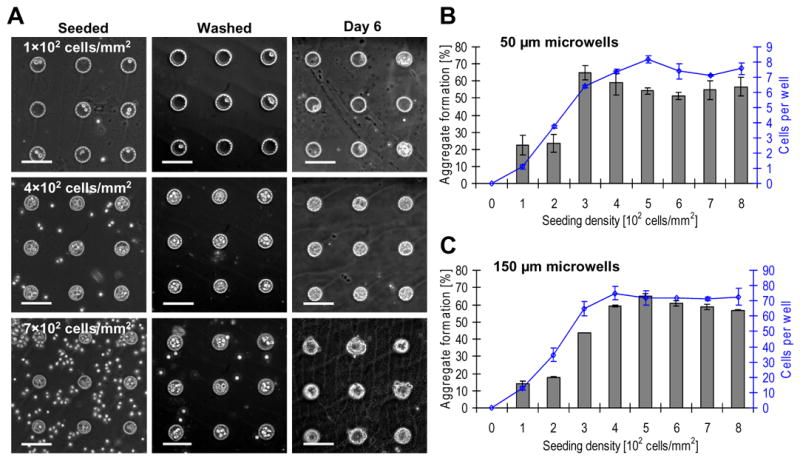
The effect of cell seeding density on aggregate formation efficiency. (A) Phase contrast images of 50 μm microwells. At low cell seeding densities, few cells settled inside the wells and, accordingly, few cell aggregates formed. Increasing the seeding density beyond the threshold 4 × 10² cells/mm2 does not result in a higher number of cells settled per well but rather only in higher numbers of undocked excess cells. All scale bars correspond to 100 μm. (B) The relation between cell seeding density, average number of cells settled per well (diagonal squares), and the corresponding frequency of EBs that formed in a 50 μm microwell array. Microwells were saturated at an optimal seeding density of 4 × 10² cells/mm2 with an average of 7.5 cells per well. Higher cell seeding densities did not yield higher EB formation efficiencies. (C) 150 μm microwells saturated with an average of 70 cells per microwell with the same optimal seeding density of 4 × 10² cells/mm2.
Shear stress simulations
Our computer simulations confirm that cells within the microwells are relatively shear-protected (Figure 8 A). We simulated shear stress profiles in response to the application of fluid flow over the microwells, with flow velocities ranging from 1–10 mm/s. We found that reducing the microwell depth:diameter ratio can attenuate internal shear stresses. Shear stresses at the bottom of 50 μm deep microwells were lower than those in 20 μm deep microwells irrespective of our changes in diameter (Figure 8 B). In these 50 μm deep arrays, shear stresses increased more rapidly with flow velocity in 150 μm diameter microwells than in 50 μm diameter microwells (Figure 8 B). However, microwells of 20 μm depth manifested shear stresses that were diameter-independent over a range of velocities (Figure 8 B). This diameter independence of shear stresses guided our selection of well depth, as it allowed for consistent washing and EB retrieval methods to be applied to microwells of different diameters.
Figure 8.
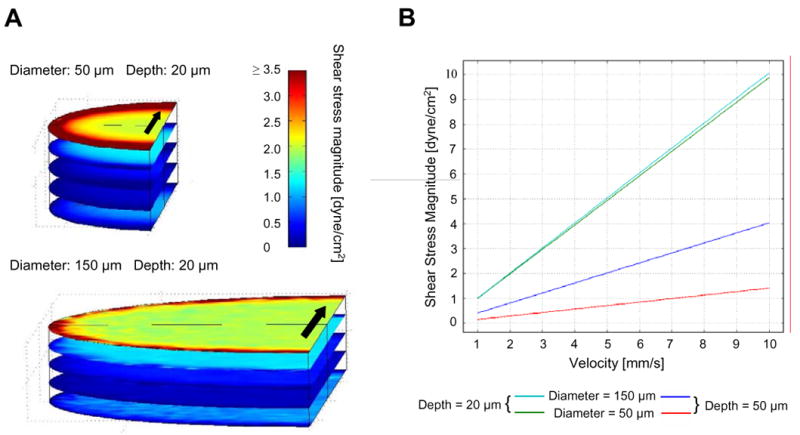
Shear stress simulations for PEG microwells of 20 μm depth. (A) Simulated shear stress profiles at steady state inside microwells with 50 and 150 μm diameters. Regions within the microwell are relatively shear-protected. The velocity over the top microwell surface was set to 1 mm/s. Arrows indicate the direction of fluid flow. (B) Shear stresses at the bottom center of 20 and 50 μm deep wells with 50 and 150 μm diameters for a range of fluid velocities over the top surface of the microwell (1–10 mm/s). Shear stresses generated during washing steps and general culture maintenance can affect the performance of the system and were thus predicted to be more comparable in 20 μm deep microwells of 50 and 150 μm diameters.
Discussion
ES cell differentiation is directed by a variety of environmental stimuli mediated through the ECM, cell-cell interactions, soluble factors, and physical stimuli [30–34]. In EBs, such stimuli may be particularly sensitive to aggregate size and shape. For example, cells on the EB surface are exposed to growth factors in the surrounding medium, whereas cells within an EB perceive soluble factor signals that are determined by internal diffusion gradients. EB size influences the number and degree of cell-cell contacts and the extent of ECM deposition. Some evidence suggests that mechanical forces and shear stresses may also affect differentiation outcome [35]. The integration of these stimuli can dictate differentiation fate. For example, cells in the periphery of EBs frequently differentiate into primitive endoderm while cells at the center tend towards primitive ectoderm [5, 36, 37].
To uniformly specify EB cell fate, the cellular microenvironment must be precisely controlled. We had previously developed a platform of PEG microwells for culturing EB populations [27]. However, the homogeneity of EBs grown on this platform was suboptimal due to nonspecific cell adhesion, which led to EB overgrowth, fusion of neighboring EBs, and even formation of monolayers (Figure 1 B). In this study, we adapted our previous system to optimize EB homogeneity. It should be noted that here we have not done extensive lineage analysis to confirm that the aggregates grown on our platform are indeed EBs, though our previous studies indicates that this is the case.
Nonspecific cell adhesion was a significant hurdle to achieving homogenous aggregate populations. Aiming to enhance the cell-repellence of our substrate, we tested PEGs of various average MWs for ES cell adhesion, finding that PEG surfaces were less adhesive than non-tissue culture treated polystyrene, the standard in vitro substrate for EB suspension cultures. We noted that the cell-repellence of PEG surfaces increases with increasing average MW (Figure 2 A). PEG 1000 surfaces manifested virtually no adhered cells. When cultured for extended periods of time, however, cells can secrete proteins and adhesion molecules that may change the properties of the surface on which they grow. This process is termed “surface remodeling” [38]. Surface remodeling may lead to enhanced nonspecific adhesion during prolonged culture. To address this possibility, we analyzed PEGs of various MWs for protein adsorption, finding that protein-repellence also increases with increasing average MW (Figure 2 B). Thus, we would expect high MW PEG surfaces to resist surface remodeling. For these reasons, PEG 1000 was selected as a desirable substrate for microwell fabrication. Successful application of our microwell platform requires that the PEG arrays remain stably fixed to an underlying substrate. Silane and acrylate chemistries have been widely used to graft PEG onto surfaces such as glass and to ensure the integrity of the glass-polymer interface [39, 40]. We treated glass supports with TMSPMA to introduce terminal acryl functional groups onto the glass surface. During free radical driven polymerization, these acryl groups established bonds with acrylate groups of the polymer, thus covalently anchoring the microwell array to its support. Acrylation increased the stability of PEG microwell arrays of low MW (Figure 3 A), but could not alone ensure the stability of PEG 575 and PEG 1000 microwell arrays (Figure 3 B).
We reasoned that detachment of the high MW PEG arrays might be caused by swelling upon exposure to an aqueous environment. For certain hydrogels, the degree of swelling can be predicted based on temperature and the average MW between crosslinks [41]. High MW PEG polymers are relatively diffusive, permitting rapid absorption of water. Rapid water uptake and swelling might create forces that stress the glass-polymer interface and lead to detachment of the microwell array. Accordingly, we used prepolymer solutions made from PEG diluted in PBS at different concentrations to generate hydrated polymers that would swell less when incubated. When a prepolymer solution containing 20% PEG 1000 was used, the resulting microwell arrays were stable during incubation and could be used for extended culture periods (Figure 3 C).
Cell aggregates were successfully grown inside the optimized microwell arrays and remained viable even for prolonged culture periods. After 6 days of culture on PEG 1000, cells had not attached to the polymer surface, and the troublesome formation of monolayers associated with PEG 258 arrays was not observed (Figure 4). Along with improved cell-repellence, the increased resistance of PEG 1000 microwell arrays to protein adsorption might explain the reduction in cell outgrowth. Aggregate populations obtained from the microwells were more homogenous in size than suspension culture EBs (Figure 5). An analysis of aggregates grown in the PEG 1000 platform revealed narrow diameter distributions with mean aggregate diameters falling close to the microwell diameters. Statistical analysis confirmed a significantly higher degree of diameter homogeneity among aggregates in PEG 1000 microwell arrays than in PEG 258 (Figure 5).
For an EB culture system to be widely applicable in differentiation studies, retrieval methods should preserve cell viability. We used a gravity- and agitation-driven retrieval method, and compared retrieval rates from PEG 258 and PEG 1000 microwell arrays of identical geometries. Retrieval efficiency was found to increase with increasing PEG MW (Figure 6). Aggregates retrieved at day 6 remained viable after removal (Figure 6 C, F). Easier harvesting from PEG 1000 arrays allowed for gentler retrieval methods, thus decreasing the probability of damaging cells.
EB formation hinges on the existence of a critical cell density within microwells. Below this density, aggregates form infrequently. To successfully grow large numbers of aggregates within a microwell array, it is thus necessary to achieve a critical cell density inside a large number of microwells. The need to achieve requisite cell densities should be balanced against the drawbacks of excessive cell seeding (namely expense and potential for overgrowth). To this end, we sought to establish a seeding protocol to optimize EB formation. Seeding at low densities yielded few EBs, and cells without cell-cell contact died (Figure 7 A). At higher densities, more aggregates formed, but cells also settled on the PEG surface between microwells and had to be washed away (Figure 7 A). If not washed away, these excess cells formed EBs in suspension that sometimes aggregated with EBs grown inside the microwells, reducing homogeneity of the EB population. Furthermore, cells that settled between the microwells were prone to nonspecific adhesion. Interestingly, the seeding density for maximal aggregate formation and the saturation density (the seeding density at which the microwells were saturated with cells) were identical (~4 × 10² cells/mm2) and independent of diameter (Figure 7 C, D). Subsequent experiments (data not shown) have demonstrated that formation efficiencies can be further increased by modifying microwell geometry.
ES cells preferentially docked in the shear-protected microwells. Cells within the microwells were shielded from stresses generated during routine washings and media changes needed for culture maintenance (Figure 8 A). Computer simulations predicted that shear stresses in 50 μm deep micowells would be lower than in microwells of 20 μm depth. However, for a shallow microwell depth of 20 μm, simulated shear stresses in 50 and 150 μm diameter microwells remained comparable for a wide range of velocities (Figure 8 B). As such, we could apply identical washing procedures to microwells of different diameters without introducing a potential bias for a given microwell geometry. We therefore used 20 μm deep microwells for this study. The shallow wells also attenuated vertical diffusion limits and eased aggregate retrieval. However, dependent on purpose, geometries of the microwells can be changed readily [27].
Conclusion
We present a system for culturing homogeneously sized EBs in arrays of shear-protected microwells. Using this platform, uniform populations of EBs can be reproducibly generated and retrieved. Nonspecific cell adhesion on the microwell substrate was reduced by appropriate choice of PEG formulation, thereby inhibiting overgrowth and preventing fusion of neighboring aggregates. We also established a robust seeding protocol for optimizing EB formation efficiencies. Our improved culture platform has the potential for scale-up and might be a versatile tool for ES cell differentiation studies and high-throughput stem cell experimentation.
Acknowledgments
We would like to thank Judy Yeh for helpful assistance and discussion. This research has been supported by the NIH, Draper Laboratory, and the Institute for Soldier Nanotechnology (DAAD- 19-02-D-002).
Footnotes
Publisher's Disclaimer: This is a PDF file of an unedited manuscript that has been accepted for publication. As a service to our customers we are providing this early version of the manuscript. The manuscript will undergo copyediting, typesetting, and review of the resulting proof before it is published in its final citable form. Please note that during the production process errors may be discovered which could affect the content, and all legal disclaimers that apply to the journal pertain.
References
- 1.Thomson JA, Itskovitz-Eldor J, Shapiro SS, Waknitz MA, Swiergiel JJ, Marshall VS, et al. Embryonic stem cell lines derived from human blastocysts. Science. 1998;282(5391):1145–7. doi: 10.1126/science.282.5391.1145. [DOI] [PubMed] [Google Scholar]
- 2.Tuch BE. Stem cells--a clinical update. Aust Fam Physician. 2006;35(9):719–21. [PubMed] [Google Scholar]
- 3.Evans MJ, Kaufman MH. Establishment in culture of pluripotential cells from mouse embryos. Nature. 1981;292(5819):154–6. doi: 10.1038/292154a0. [DOI] [PubMed] [Google Scholar]
- 4.Watt FM, Hogan BL. Out of Eden: stem cells and their niches. Science. 2000;287(5457):1427–30. doi: 10.1126/science.287.5457.1427. [DOI] [PubMed] [Google Scholar]
- 5.Hamazaki T, Oka M, Yamanaka S, Terada N. Aggregation of embryonic stem cells induces Nanog repression and primitive endoderm differentiation. J Cell Sci. 2004;117(Pt 23):5681–6. doi: 10.1242/jcs.01489. [DOI] [PubMed] [Google Scholar]
- 6.Lavon N, Yanuka O, Benvenisty N. Differentiation and isolation of hepatic-like cells from human embryonic stem cells. Differentiation. 2004;72(5):230–8. doi: 10.1111/j.1432-0436.2004.07205002.x. [DOI] [PubMed] [Google Scholar]
- 7.Kehat I, Kenyagin-Karsenti D, Snir M, Segev H, Amit M, Gepstein A, et al. Human embryonic stem cells can differentiate into myocytes with structural and functional properties of cardiomyocytes. J Clin Invest. 2001;108(3):407–14. doi: 10.1172/JCI12131. [DOI] [PMC free article] [PubMed] [Google Scholar]
- 8.Bielby RC, Boccaccini AR, Polak JM, Buttery LD. In vitro differentiation and in vivo mineralization of osteogenic cells derived from human embryonic stem cells. Tissue Eng. 2004;10(9–10):1518–25. doi: 10.1089/ten.2004.10.1518. [DOI] [PubMed] [Google Scholar]
- 9.Karp JM, Ferreira LS, Khademhosseini A, Kwon AH, Yeh J, Langer RS. Cultivation of human embryonic stem cells without the embryoid body step enhances osteogenesis in vitro. Stem Cells. 2006;24(4):835–43. doi: 10.1634/stemcells.2005-0383. [DOI] [PubMed] [Google Scholar]
- 10.Levenberg S, Golub JS, Amit M, Itskovitz-Eldor J, Langer R. Endothelial cells derived from human embryonic stem cells. Proc Natl Acad Sci U S A. 2002;99(7):4391–6. doi: 10.1073/pnas.032074999. [DOI] [PMC free article] [PubMed] [Google Scholar]
- 11.Zhang SC, Wernig M, Duncan ID, Brustle O, Thomson JA. In vitro differentiation of transplantable neural precursors from human embryonic stem cells. Nat Biotechnol. 2001;19(12):1129–33. doi: 10.1038/nbt1201-1129. [DOI] [PubMed] [Google Scholar]
- 12.Zandstra PW, Nagy A. Stem cell bioengineering. Annu Rev Biomed Eng. 2001;3:275–305. doi: 10.1146/annurev.bioeng.3.1.275. [DOI] [PubMed] [Google Scholar]
- 13.Doetschman TC, Eistetter H, Katz M, Schmidt W, Kemler R. The in vitro development of blastocyst-derived embryonic stem cell lines: formation of visceral yolk sac, blood islands and myocardium. J Embryol Exp Morphol. 1985;87:27–45. [PubMed] [Google Scholar]
- 14.Hopfl G, Gassmann M, Desbaillets I. Differentiating embryonic stem cells into embryoid bodies. Methods Mol Biol. 2004;254:79–98. doi: 10.1385/1-59259-741-6:079. [DOI] [PubMed] [Google Scholar]
- 15.Itskovitz-Eldor J, Schuldiner M, Karsenti D, Eden A, Yanuka O, Amit M, et al. Differentiation of human embryonic stem cells into embryoid bodies compromising the three embryonic germ layers. Mol Med. 2000;6(2):88–95. [PMC free article] [PubMed] [Google Scholar]
- 16.Keller GM. In vitro differentiation of embryonic stem cells. Curr Opin Cell Biol. 1995;7(6):862–9. doi: 10.1016/0955-0674(95)80071-9. [DOI] [PubMed] [Google Scholar]
- 17.Yamada T, Yoshikawa M, Kanda S, Kato Y, Nakajima Y, Ishizaka S, et al. In vitro differentiation of embryonic stem cells into hepatocyte-like cells identified by cellular uptake of indocyanine green. Stem Cells. 2002;20(2):146–54. doi: 10.1634/stemcells.20-2-146. [DOI] [PubMed] [Google Scholar]
- 18.Falconnet D, Csucs G, Grandin HM, Textor M. Surface engineering approaches to micropattern surfaces for cell-based assays. Biomaterials. 2006;27(16):3044–63. doi: 10.1016/j.biomaterials.2005.12.024. [DOI] [PubMed] [Google Scholar]
- 19.Dang SM, Kyba M, Perlingeiro R, Daley GQ, Zandstra PW. Efficiency of embryoid body formation and hematopoietic development from embryonic stem cells in different culture systems. Biotechnol Bioeng. 2002;78(4):442–53. doi: 10.1002/bit.10220. [DOI] [PubMed] [Google Scholar]
- 20.Ng ES, Davis RP, Azzola L, Stanley EG, Elefanty AG. Forced aggregation of defined numbers of human embryonic stem cells into embryoid bodies fosters robust, reproducible hematopoietic differentiation. Blood. 2005;106(5):1601–3. doi: 10.1182/blood-2005-03-0987. [DOI] [PubMed] [Google Scholar]
- 21.Williams RL, Hilton DJ, Pease S, Willson TA, Stewart CL, Gearing DP, et al. Myeloid leukaemia inhibitory factor maintains the developmental potential of embryonic stem cells. Nature. 1988;336(6200):684–7. doi: 10.1038/336684a0. [DOI] [PubMed] [Google Scholar]
- 22.Cameron CM, Hu WS, Kaufman DS. Improved development of human embryonic stem cell-derived embryoid bodies by stirred vessel cultivation. Biotechnol Bioeng. 2006;94(5):938–48. doi: 10.1002/bit.20919. [DOI] [PubMed] [Google Scholar]
- 23.Dang SM, Gerecht-Nir S, Chen J, Itskovitz-Eldor J, Zandstra PW. Controlled, scalable embryonic stem cell differentiation culture. Stem Cells. 2004;22(3):275–82. doi: 10.1634/stemcells.22-3-275. [DOI] [PubMed] [Google Scholar]
- 24.Zweigerdt R, Burg M, Willbold E, Abts H, Ruediger M. Generation of confluent cardiomyocyte monolayers derived from embryonic stem cells in suspension: a cell source for new therapies and screening strategies. Cytotherapy. 2003;5(5):399–413. doi: 10.1080/14653240310003062. [DOI] [PubMed] [Google Scholar]
- 25.Carpenedo RL, Sargent CY, McDevitt TC. Rotary Suspension Culture Enhances the Efficiency, Yield and Homogeneity of Embryoid Body Differentiation. Stem Cells. 2007 doi: 10.1634/stemcells.2006-0523. [DOI] [PubMed] [Google Scholar]
- 26.Schroeder M, Niebruegge S, Werner A, Willbold E, Burg M, Ruediger M, et al. Differentiation and lineage selection of mouse embryonic stem cells in a stirred bench scale bioreactor with automated process control. Biotechnol Bioeng. 2005;92(7):920–33. doi: 10.1002/bit.20668. [DOI] [PubMed] [Google Scholar]
- 27.Torisawa YS, Chueh BH, Huh D, Ramamurthy P, Roth TM, Barald KF, et al. Efficient formation of uniform-sized embryoid bodies using a compartmentalized microchannel device. Lab Chip. 2007;7(6):770–6. doi: 10.1039/b618439a. [DOI] [PubMed] [Google Scholar]
- 28.Karp JM, Yeh J, Eng G, Fukuda J, Blumling J, Suh KY, et al. Controlling size, shape and homogeneity of embryoid bodies using poly(ethylene glycol) microwells. Lab Chip. 2007;7(6):786–94. doi: 10.1039/b705085m. [DOI] [PubMed] [Google Scholar]
- 29.Khademhosseini A, Yeh J, Eng G, Karp J, Kaji H, Borenstein J, et al. Cell docking inside microwells within reversibly sealed microfluidic channels for fabricating multiphenotype cell arrays. Lab Chip. 2005;5(12):1380–6. doi: 10.1039/b508096g. [DOI] [PubMed] [Google Scholar]
- 30.Nagy A, Rossant J, Nagy R, Abramow-Newerly W, Roder JC. Derivation of completely cell culture-derived mice from early-passage embryonic stem cells. Proc Natl Acad Sci U S A. 1993;90(18):8424–8. doi: 10.1073/pnas.90.18.8424. [DOI] [PMC free article] [PubMed] [Google Scholar]
- 31.Quesenberry PJ, Becker PS. Stem cell homing: rolling, crawling, and nesting. Proc Natl Acad Sci U S A. 1998;95(26):15155–7. doi: 10.1073/pnas.95.26.15155. [DOI] [PMC free article] [PubMed] [Google Scholar]
- 32.Moro L, Venturino M, Bozzo C, Silengo L, Altruda F, Beguinot L, et al. Integrins induce activation of EGF receptor: role in MAP kinase induction and adhesion-dependent cell survival. Embo J. 1998;17(22):6622–32. doi: 10.1093/emboj/17.22.6622. [DOI] [PMC free article] [PubMed] [Google Scholar]
- 33.Artavanis-Tsakonas S, Rand MD, Lake RJ. Notch signaling: cell fate control and signal integration in development. Science. 1999;284(5415):770–6. doi: 10.1126/science.284.5415.770. [DOI] [PubMed] [Google Scholar]
- 34.Faloon P, Arentson E, Kazarov A, Deng CX, Porcher C, Orkin S, et al. Basic fibroblast growth factor positively regulates hematopoietic development. Development. 2000;127(9):1931–41. doi: 10.1242/dev.127.9.1931. [DOI] [PubMed] [Google Scholar]
- 35.Nakayama T, Momoki-Soga T, Yamaguchi K, Inoue N. Efficient production of neural stem cells and neurons from embryonic stem cells. Neuroreport. 2004;15(3):487–91. doi: 10.1097/00001756-200403010-00021. [DOI] [PubMed] [Google Scholar]
- 36.Ingber DE. Mechanical control of tissue morphogenesis during embryological development. Int J Dev Biol. 2006;50(2–3):255–66. doi: 10.1387/ijdb.052044di. [DOI] [PubMed] [Google Scholar]
- 37.Maye P, Becker S, Kasameyer E, Byrd N, Grabel L. Indian hedgehog signaling in extraembryonic endoderm and ectoderm differentiation in ES embryoid bodies. Mech Dev. 2000;94(1–2):117–32. doi: 10.1016/s0925-4773(00)00304-x. [DOI] [PubMed] [Google Scholar]
- 38.Coucouvanis E, Martin GR. Signals for death and survival: a two-step mechanism for cavitation in the vertebrate embryo. Cell. 1995;83(2):279–87. doi: 10.1016/0092-8674(95)90169-8. [DOI] [PubMed] [Google Scholar]
- 39.Roberts C, Chen CS, Mrksich M, Martichonok V, Ingber DE, Whitesides GM. Using Mixed Self-Assembled Monolayers Presenting RGD and (EG)3OH Groups To Characterize Long-Term Attachment of Bovine Capillary Endothelial Cells to Surfaces. J Am Chem Soc. 1998;120(26):6548–6555. [Google Scholar]
- 40.Plueddemann EP. Silane coupling agents. Plenum Press; New York: 1982. [Google Scholar]
- 41.Revzin A, Russell RJ, Yadavalli VK, Koh WG, Deister C, Hile DD, et al. Fabrication of poly(ethylene glycol) hydrogel microstructures using photolithography. Langmuir. 2001;17(18):5440–7. doi: 10.1021/la010075w. [DOI] [PubMed] [Google Scholar]
- 42.Peppas NA, Brannon-Peppas L. Hydrogels at critical conditions I: Thermodynamics and swelling behavior. Journal of membrane science. 1990;48(2–3):281–290. [Google Scholar]
- 43.Temenoff JS, Athanasiou KA, LeBaron RG, Mikos AG. Effect of poly(ethylene glycol) molecular weight on tensile and swelling properties of oligo(poly(ethylene glycol) fumarate) hydrogels for cartilage tissue engineering. J Biomed Mater Res. 2002;59(3):429–37. doi: 10.1002/jbm.1259. [DOI] [PubMed] [Google Scholar]
- 44.van de Wetering P, Metters AT, Schoenmakers RG, Hubbell JA. Poly(ethylene glycol) hydrogels formed by conjugate addition with controllable swelling, degradation, and release of pharmaceutically active proteins. J Control Release. 2005;102(3):619–27. doi: 10.1016/j.jconrel.2004.10.029. [DOI] [PubMed] [Google Scholar]