

Summary
Objective
Differences in the hypothalamic-pituitary-adrenal (HPA) axis response to stress may confer differences in susceptibility to a variety of diseases. We hypothesized that whites would differ from blacks in HPA axis response to a psychological stressor.
Design
Healthy subjects aged 18–30 were recruited from Baltimore, Maryland. At initial assessment, they completed psychometric tests measuring anxiety, mood, and personality. Subjects then participated in the Trier Social Stress Test (TSST), which consisted of 10 min of public speaking and mental arithmetic exercises. Subjective anxiety was measured immediately pre- and post-TSST. Race effects on cortisol, adrenocorticotrophin (ACTH), and prolactin responses to the TSST were analyzed by GEE longitudinal analysis methods. The analysis controlled for gender, baseline hormone levels, socioeconomic factors, anxiety, mood, and dimensions of personality.
Results
Ninety-eight subjects participated in the TSST. Whites had 36% greater relative mean cortisol response than blacks (95% CI: 10%–67%, P = 0.004). Whites had significantly higher mean ACTH compared to blacks at 25 min after the start of the TSST, (35%, 95% CI: 16%–58% greater, P < 0.001). There was no difference in prolactin response. Of note, whites and blacks did not differ in subjective anxiety response to the TSST.
Conclusions
In sum, we found that whites have a more robust HPA axis response to the TSST compared with blacks, even after controlling for several socioeconomic and psychological factors. In contrast, we observed no difference in prolactin response. There were no differences in subjective response to the TSST to explain the difference in HPA axis response. Further study is indicated to explain this finding and to test whether it can be extrapolated to other forms of stress.
Keywords: race, stress, cortisol, ACTH, HPA axis, prolactin
Introduction
Racial disparities in the prevalence and burden of disease exist for a broad spectrum of medical conditions. For instance, there is a higher prevalence and earlier onset of hypertension among blacks than whites (Ferdinand and Saunders, 2006). Blacks are also almost twice as likely to have diabetes than non-Hispanic whites (Centers for Disease Control, 2007). As would be expected, morbidity and mortality from cardiovascular diseases is higher among blacks compared with whites (National Heart Lung and Blood Institute, 2005). In contrast, certain conditions such as osteoporosis are less common in black than white women (Department of Health and Human Services, 2007). Also, several psychoaffective conditions such as anxiety, mood, and substance use disorders are less prevalent in blacks compared to non-Hispanic whites (Kessler et al., 2005). The underlying causes of these racial disparities are likely multifactorial and may relate to socioeconomic factors, healthcare access, patient preferences, and biological differences. With respect to the latter, variations in the response to environmental stressors are likely to play a contributory role.
The hypothalamic-pituitary-adrenal (HPA) axis is a cardinal mediator of the stress response. Inappropriate and maladaptive intensification or attenuation of HPA axis-mediated responses to stress can lead to chronic diseases (McEwen, 1998;Sapolsky, 1999;Tsigos and Chrousos, 2002). Following the perception of stress, corticotrophin releasing hormone (CRH) is released from the hypothalamus. CRH stimulates the synthesis and release of adrenocorticotrophic hormone (ACTH) from the pituitary gland, which in turn stimulates cortisol synthesis and release by the adrenal cortex. HPA axis dysregulation has been shown to contribute to conditions that show a racial difference, such as several of the aforementioned diseases (Gold and Chrousos, 2002;McEwen, 1998;Tsigos and Chrousos, 2002). Thus, it is conceivable that racial differences in susceptibility to certain chronic diseases could be partially explained by physiological variations in stress hormones such as cortisol.
Several studies have suggested that cortisol patterns during the day differ between blacks and whites. For instance, cortisol levels upon waking have been shown to be higher among higher-educated whites compared with blacks and lower educated whites (Bennett et al., 2004). Another study has suggested that blacks experience a less steep decline in cortisol during the course of the day, even after accounting for differences in socioeconomic status (Cohen et al., 2006).
No study has assessed for racial differences in HPA axis response to a standardized psychosocial stressor while adequately accounting for confounders. Based on the previous findings, we hypothesized that the HPA axis responses to a psychological stressor would differ between healthy whites and blacks, independent of anxiety, mood, personality, and socioeconomic factors. Thus, we administered a standardized psychosocial stress test, the Trier Social Stress Test (TSST), to healthy black and white subjects and measured their cortisol and ACTH response. This study objective was a secondary outcome of a larger study examining the relationship between genetic variation and HPA axis responses. In addition, we simultaneously measured the responses in another stress hormone, prolactin.
Methods
Recruitment
Among the 98 subjects analyzed in this study, 59 were previously analyzed in other studies (Oswald et al., 2006;Uhart et al., 2006a). Healthy males and females from the Baltimore area between the ages of 18 and 30 were recruited by newspaper, radio, and flyer advertisements. After being screened by a telephone interview, eligible persons were invited for an initial assessment. Written informed consent was obtained from each subject to participate in our protocol, which had been approved by the Johns Hopkins University School of Medicine Institutional Review Board. Subjects self-reported their race, yearly income, and years of education. A physician conducted a medical history and physical exam. A complete blood count, comprehensive metabolic panel, electrocardiogram, urinalysis, urine toxicology screen, and alcohol breathalyzer test were obtained for exclusionary criteria. Each female subject also received a pregnancy test. The Semi-Structured Assessment for the Genetics of Alcoholism (SSAGA) was administered by a master’s degree-level interviewer to recognize DSM-IV axis I psychiatric diagnoses (Bucholz et al., 1994). Nicotine dependence was determined using the Fagerstom test (Richardson and Ratner, 2005).
Exclusion criteria were as follows: presence of a serious medical condition; weight greater than 250 lbs, current or lifetime history of a DSM-IV axis I disorder (including alcohol or drug dependence); nicotine dependence; drug use in the prior 90 days; use of any psychoactive medications within the prior 30 days; treatment in the prior 6 months with any medication known to alter HPA axis function, including antidepressants, neuroleptics, sedative hypnotics, glucocorticoids, appetite suppressants, estrogens, opiates, or dopamine medications; seizure disorder; history of closed head trauma; positive urine toxicology screen; and, for females, pregnancy or lactation.
All females were pre-menopausal. Females were studied during the follicular phase, which was defined as the first 12 days of the menstrual cycle documented by menstrual diary and a progesterone level less than 1 ng/mL.
Behavioral Measures
Behavioral measures were obtained during the initial assessment interview to assess anxiety, mood, and personality dimensions. These measures included the State-Trait Anxiety Inventory (STAI) for adults (Spielberger CD, 1983), Perceived Stress Scale (PSS) (Cohen et al., 1983), Life Experiences Survey (LES) (Sarason et al., 1978), Combined Hassles and Uplifts Scales (CHUS) (Lazarus and Folkman S., 1989), Beck Depression Inventory, 2nd Edition (BDI-II) (Beck A.T. et al., 2007), and Revised NEO Personality Inventory (NEO-PI-R) (Costa and McCrae, 1992a;Costa and McCrae, 1992b).
Anxiety Measures
STAI
The STAI is a well-validated, 40-item self-rating scale, composed of the state anxiety (S-anxiety) and trait anxiety (T-anxiety) scales. The S-anxiety scale consists of 20 items evaluating how respondents feel at the moment; respondents describe the intensity of their feelings at the moment on a 4-point scale ranging from “not at all” to “very much so.” The T-anxiety scale consists of 20 items assessing how anxious people generally feel; respondents are instructed to rate the general frequency of their feelings of anxiety on a 4-point scale that ranges from “almost never” to “almost always.” Scores for both the S- and T-anxiety scales can vary from a minimum of 20 to a maximum of 80. The STAI is the most widely used tool for measuring anxiety. This scale has high criterion-validity under a wide range of stresses and high internal consistency. Test-retest reliability coefficients of 0.83 to 0.92 have been reported for the state subscale and 0.86 to 0.92 for the trait subscale. Alpha coefficients, measuring internal consistency, range from 0.83 to 0.92 for the state subscale and 0.86 for 0.92 for the trait subscale. Concurrent validity has also been shown (0.75 to 0.83) (Soderstrom and Grimm, 2007).
PSS
The PSS is a 10-item, self-report inventory that assesses the degree to which situations in an individual’s life are perceived as stressful. Respondents indicate how often they have felt or thought a certain way on a 5-point scale (0 = never, 1 = almost never, 2 = sometimes, 3 = fairly often, and 4 = very often). For example, the response time frame is, “In the last month how often have you felt that you were unable to control the important things in your life?” Scores range from 0 to 40. The PSS has established internal reliability (Cronbach’s alpha = 0.84 to 0.85) and test-retest correlation of 0.85 (Shaw et al., 2000). Validity has also been shown in that it has been routinely correlated with depression and anxiety (r = 0.50 to 0.80) and can predict both depressive symptoms and the onset of both physical and psychiatric symptoms (Shaw et al., 2000;Workman, 1998).
LES
The LES is a 57-item self-report measure that allows respondents to indicate events that they have experienced during the last year (0–6 months or 7 months–1 year). Ratings of the impact of events are on 7-point scale (−3 = extremely negative, −2 = moderately negative, −1 = somewhat negative, 0 = no impact, +1 = slightly positive, +2 = moderately positive, and +3 = extremely positive). Summing the impact ratings of those events designated as positive by the subject provides a positive change score. A negative change score is derived by summing the impact ratings of those events experienced as negative by the subject. The LES negative change score has test-retest reliability of 0.56 to 0.88. Its validity has been established by comparing relationships between LES scores and a variety of outcomes. For example, negative scores have been significantly related to both the trait (r = 0.29) and state (r = 0.46) scores of the STAI; correlations with the total score of the LES have also been shown to be significant (Shaw et al., 2000).
CHUS
This 53-item self-report inventory was used to measure the frequency and attitudes about daily negative events (hassles) and positive events (uplifts) over the past month. Subjects may rate events as hassles, uplifts, or both. There are four subscales: Hassles Frequency (number of events rated as a hassle); Hassles Severity (average severity rating on a 4-point scale for hassles (0 = none or not applicable, 1 = somewhat, 2 = quite a bit, and 3 = a great deal)); Uplifts Frequency (number of events rated as an uplift); and Uplifts Intensity (average intensity rating on 4-point scale for uplifts (0 = none or not applicable, 1 = somewhat, 2 = quite a bit, and 3 = a great deal). This scale has been shown to have both test-retest and internal consistency and concurrent validity (Delongis, 1985;Delongis et al., 1988).
Mood measure
BDI-II
The BDI-II is a 21-item self-report survey of symptoms of depression on which subjects are instructed to rate, on a scale of 0–3, how each symptom applies to them as related to the way they have felt over the past two weeks. Clinical interpretation of scores is accomplished through criterion-referenced procedures utilizing the following interpretive ranges: 0–13, minimal depression; 14–19, mild depression; 20–28, moderate depression; and 29–63, severe depression. The 1-week test-retest reliability of the BDI-II is 0.93. The convergent validity is supported by significant correlations with several other indices of depression, including a correlation of 0.93 with an earlier version of the instrument (Dozois and Dobson, 2004).
Personality measure
NEO-PI-R
The NEO PI-R is a validated, 240-item questionnaire developed through rational and factor analytic methods to measure the five major factors, or domains, of personality: Neuroticism (N), Extraversion (E), Openness to Experience (O), Agreeableness (A), and Conscientiousness (C). Each factor or domain is represented by six facet subscales that are designed to capture more specific traits associated with the given factor. Items describing general tendencies are answered on a 5-point scale ranging from “strongly agree” to “strongly disagree” The scales are balanced to control for the effects of acquiescence. Scores on the NEO PI-R are stardardized via conversion of raw scores to T-scores. T-scores < 45 are considered low, 45–55 average, and > 55 high. The NEO PI-R has been shown to have validity and reliability across a spectrum of populations and cultures. Internal consistency coefficients for the NEO-PI-R have been found to range from .86 to .95 for domain scales and from .56 to .90 for facet scales. Stability coefficients have been found to range from .51 to .83 in 3-year, 6-year, and 7-year longitudinal studies of the original NEO-PI factors. The NEO-PI-R has been validated against other personality inventories (Costa and McCrae, 1992b).
General Procedure
After completing the initial assessment interview, subjects reported to the Adult Outpatient Unit of the Johns Hopkins Hospital General Clinical Research Center to undergo the TSST. Subjects were instructed to record any stressful events in the week prior and to sleep adequately the night before the TSST. They were also requested to refrain from any alcohol, illicit drugs, or over-the-counter medications for 48 h prior to participating in the study protocol. Urine toxicology screens, alcohol breathlyzer tests, and urine pregnancy tests (for females) were completed before the TSST. On the day of TSST, subjects received a calorie-controlled breakfast at 0930 and fasted from 1000h until all study procedures were completed at 1530h. All procedures were performed under the same conditions for each subject, with the same study personnel and in the same study room.
TSST
The TSST was completed as previously described (Uhart et al., 2004), based on the original protocol by Kirschbaum et al (Kirschbaum et al., 1993). The S-anxiety scale of the STAI was administered just prior to the procedures. An intravenous catheter was placed at 1200h. One hour later, three blood samples were drawn at 15-min intervals to establish baseline cortisol, ACTH, and prolactin concentrations. Subjects listened to audiotaped instructions for 5 min. They were then given 10 min to mentally prepare for their performance task. They were then given 5 min to complete a public speaking task and 5 min to complete a mental arithmetic task. From the start of the audiotaped instructions to the end of the mental arithmetic task, there were 25 min. Immediately following the mental arithmetic task (i.e. 25 min from the start of the audiotaped instructions), four more blood samples for cortisol, ACTH, and prolactin were obtained at 15-min intervals. Also, the S-anxiety scale of the STAI was repeated at this time.
Hormone Assays
Plasma cortisol concentration was assayed by radioimmunoassay (Diagnostic Products Corporation, Inc.; Los Angeles, CA). Intra-assay and inter-assay coefficients of variance were each less than 9% for plasma cortisol. Plasma ACTH concentration was measured by the Nichols immunoradiometric assay. Intra-assay and inter-assay coefficients of variance were 6% and 8.5%, respectively, for plasma ACTH. Plasma concentrations of prolactin were measured by radioimmunoassay (Incstar Inc., San Francisco, CA). Intra-assay and interassay coefficients of variance were each less than 9%, and the detection limit for the assay was 0.1 ng/ml.
Statistical analysis
Summary tables and descriptive statistics were used to summarize the data for all subjects together and separately by race. Fisher’s exact tests and Wilcoxon ranksum tests were used to compare the categorical and continuous variables by race. The primary outcomes of interest were cortisol and ACTH concentrations following the TSST. Cortisol, ACTH, and prolactin concentrations were transformed to the logarithmic scale because of non-normality. The mean baseline for each hormone was calculated by taking the average of the baseline measurements (−30 min, −15 min, and 0 min time points).
Longitudinal regression models were used to compare cortisol, ACTH, and prolactin concentrations across race after adjusting for baseline hormone levels, gender, time and a quadratic function of time (time and time2) First, we tested whether the association between hormone levels and time differed by race by including the interaction between race and time and time2. Where appropriate, this time by race interaction was dropped and the adjustment for time and time2 was kept in the model. Standard errors of the regression models were adjusted to take into account the correlation of hormone levels within a person over time. The correlation structure was specified to be autoregressive. However, a robust variance estimate was used to ensure validity of our inferences despite this correlation model assumption. Additional longitudinal models were used to test whether gender is an effect-modifier of race (i.e. whether the race effect on cortisol differed by gender) and also to adjust the race effect by years of education; income; anxiety measures that predicted hormone response with a P-value of <0.1; BDI-II scores; and NEO-PI-R neuroticism and extraversion scores (which our group has demonstrated to be predictive of cortisol responses to the TSST (Oswald et al., 2006).
Furthermore, linear regression models were used to correlate the area-under-the-curve (AUC) for each hormone (cortisol, ACTH, and prolactin) with the change in the S-anxiety scores pre- and post- TSST for each race. These models were adjusted for baseline AUC hormone, pre-TSST S-anxiety scores, gender, level of education, income, anxiety measures that predicted hormone response with a P-value of <0.1, BDI-II scores, and NEO-PI-R neuroticism and extraversion scores.
Results
Table 1 summarizes the subject demographic variables. There was a statistically significant difference in gender and years of education between white and blacks. Whites were predominantly male (70% versus 37%, P = 0.015). Also, whites had roughly 1.3 additional years of education compared to blacks (P = 0.007).
Table 1.
Demographics
| All | Whites | Blacks | P-value | |
|---|---|---|---|---|
| Sample Size | 98 | 79 | 19 | |
| Age, mean (SD), (y) | 22.1 (3.01) | 22.3 (3.03) | 21.0 (2.8) | 0.074 |
| Male, No. (%) | 62 (63.6) | 55 (69.6) | 7 (36.8) | 0.015 |
| Smoking Status, No. (%) | ||||
| Smoker* | 5 (5.1) | 3 (3.8) | 2 (10.5) | |
| Non-smoker | 93 (94.9) | 76 (96.2) | 17 (89.5) | 0.248 |
| Income, No. (%) | ||||
| < $20,000 | 34 (36.6) | 27 (36.5) | 7 (36.8) | |
| $20,000 – 40,000 | 23 (24.7) | 18 (24.3) | 5 (26.3) | |
| > $40,000 | 36 (38.7) | 29 (39.2) | 7 (36.8) | 1.000 |
| Education, mean (SD), (y) | 14.6 (1.7) | 14.9 (1.6) | 13.6 (1.8) | 0.007 |
Smokers smoked equal to or less than 10 cigarettes per day and did not meet criteria for tobacco dependence, as determined by the Fagerstrom Test.
Table 2 summarizes the anxiety, mood, and personality measures by race. There was a statistically significant difference in the overall NEO-PI-R extraversion score (P = 0.021) with whites scoring higher on this scale on average by five points (higher scores indicate greater extraversion). However, there were no other statistically significant differences by race in any other psychological measures. Of note, there were no differences by race in pre-TSST S-Anxiety scores, post-TSST S-Anxiety scores, or change in S-anxiety scores pre- and post-TSST.
Table 2.
Summary of behavioral measures
| All | Whites | Blacks | P-value | |
|---|---|---|---|---|
| Measures obtained at initial assessment | ||||
| STAI S-Anxiety score | 28.3 (7.9) | 28 (8.2) | 29.5 (6.8) | 0.268 |
| STAI T-Anxiety score | 29.5 (7.4) | 29.4 (7.2) | 30.0 (8.4) | 0.900 |
| BDI-II total score | 2.9 (3.6) | 2.6 (3.2) | 4.2 (4.6) | 0.189 |
| PSS total score | 10.9 (5.9) | 10.5 (5.5) | 12.5 (7.2) | 0.465 |
| CHUS Hassles Frequency | 19.3 (9.7) | 19.5 (9.0) | 18.4 (12.2) | 0.612 |
| CHUS Hassles Severity | 1.3 (0.4) | 1.3 (0.4) | 1.3 (0.6) | 0.534 |
| CHUS Uplifts Frequency | 29.1 (8.9) | 28.9 (8.5) | 29.7 (10.7) | 0.467 |
| CHUS Uplifts Severity | 1.9 (0.4) | 1.9 (0.3) | 2.0 (0.4) | 0.060 |
| LES Number of negative life events in past year | 3.3 (3.1) | 3.1 (2.9) | 4.0 (3.6) | 0.281 |
| LES Impact rating for negative events in past year | 4.8 (5.2) | 4.2 (4.3) | 6.8 (7.8) | 0.149 |
| NEO-PI-R Neuroticism domain score | 44.0 (8.7) | 44.0 (8.5) | 43.8 (9.6) | 0.925 |
| NEO-PI-R Extraversion domain score | 52.3 (9.8) | 53.4 (10.1) | 47.5 (6.3) | 0.021 |
| Measures obtained on day of TSST | ||||
| STAI S-Anxiety score pre-TSST | 30.1 (8.5) | 29.6 (7.6) | 32.1 (11.4) | 0.590 |
| STAI S-Anxiety score post-TSST | 35.7 (10.1) | 35.0 (10.0) | 38.6 (10.3) | 0.151 |
| STAI change in S-Anxiety score pre-and post-TSST | 5.6 (8.2) | 5.4 (7.3) | 6.5 (11.4) | 0.472 |
Basic longitudinal models were used to estimate the relative mean hormone levels comparing whites to blacks as a function of time after adjusting for baseline hormone levels and gender. In the basic model for cortisol, we found that the race effect was statistically constant across time, i.e. the average difference in cortisol response between black and whites was the same at every time point. In the basic model for ACTH and prolactin, the race effect did vary by time. Therefore, subsequent models for ACTH and prolactin included the interaction between race and time.
Using these basic longitudinal models, we estimated that the mean cortisol levels in response to the TSST were 27% greater among whites relative to blacks (95% CI: 8% to 50% greater, P = 0.005). At 25 min after the start of the TSST (i.e. immediately after completion of the mental arithmetic task), whites had significantly higher mean ACTH compared to blacks (43%, 95% CI: 26% to 62% greater, P < 0.001). There were no other statistically significant differences at other TSST time points. We found no evidence that gender was an effect modifier for the cortisol or ACTH response versus race association. There was no association of race with prolactin response in the basic longitudinal model for prolactin.
The basic longitudinal models described above were extended to include adjustments for income (<$20,000/y, $20,000–$40,000/y, and >$40,000/y), years of education, anxiety measures that predicted hormonal responses (cortisol, ACTH, and prolactin) with a P <0.10, BDI-II scores, and NEO-PI-R neuroticism and extraversion scores. In the extended model for cortisol, we found that the cortisol response to the TSST was approximately 36% greater in whites than blacks (95% CI: 10%–67%, P = 0.004, Figure 1). In the extended model for ACTH, whites had significantly higher mean ACTH levels compared to blacks at 25 min after the start of the TSST, (35%, 95% CI: 16% to 58% greater, P < 0.001) (Figure 2). As was the case for the basic longitudinal model for prolactin, there was no association of race with prolactin in the extended model (Figure 3). There was no statistically significant difference in baseline cortisol, ACTH, or prolactin between whites and blacks.
Figure 1.
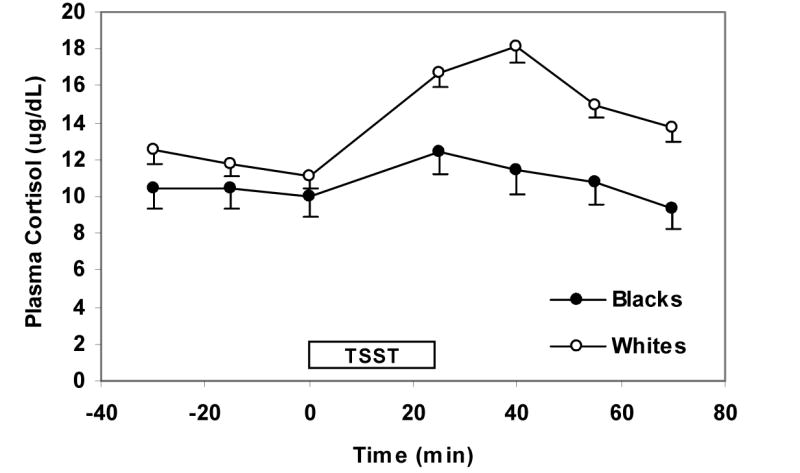
Cortisol response to the TSST by race. Values reflect means (SE) after adjusting for gender, baseline hormone levels, income, level of education, anxiety measures that predicted cortisol response with a P-value of <0.10 (i.e. CHUS Hassles Severity, Uplifts Frequency, and Uplifts Severity at initial assessment), BDI-II, scores, and NEO-PI-R neuroticism and extraversion scores. The TSST box designates the time from which the instructions for the TSST are given (time 0 min) to the time the arithmetic task is completed (time 25 min).
Figure 2.
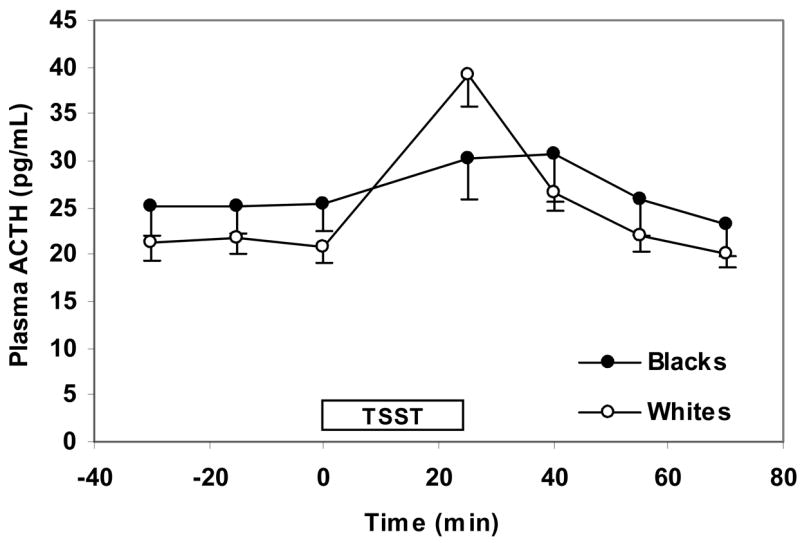
ACTH response to the TSST by race. Values reflect means (SE) after adjusting for gender, baseline hormone level, income, level of education, anxiety measures that predicted cortisol response with a P-value of <0.10 (i.e. PSS, CHUS Hassles Frequency, and CHUS Uplifts Frequency scores at initial assessment and change in STAI S-anxiety score pre- and post TSST), BDI-II scores, and NEO-PI-R neuroticism and extraversion scores. The TSST box designates the time from which the instructions for the TSST are given (time 0 min) to the time the arithmetic task is completed (time 25 min).
Figure 3.
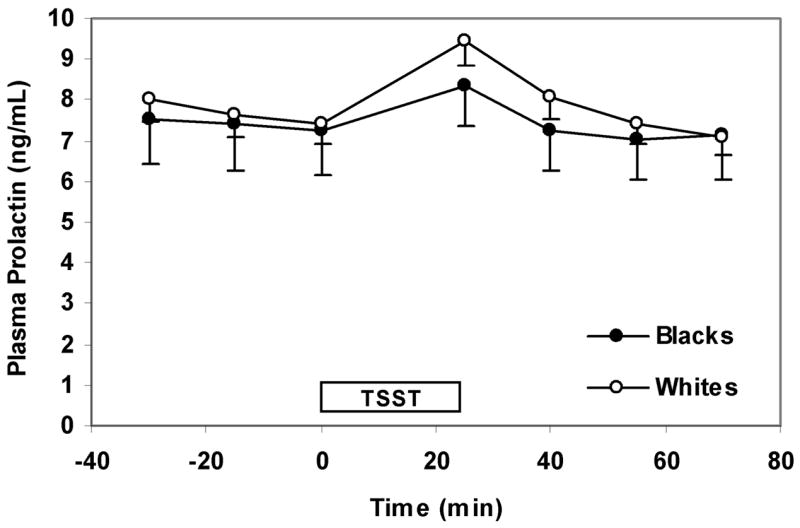
Prolactin response to the TSST by race. Values reflect means (SE) after adjusting for gender, baseline hormone levels, income, level of education, anxiety measures that predicted prolactin response with a P-value of <0.10 (i.e. change in STAI S-anxiety score pre- and post-TSST), BDI-II, scores, and NEO-PI-R neuroticism and extraversion scores. The TSST box designates the time from which the instructions for the TSST are given (time 0 min) to the time the arithmetic task is completed (time 25 min).
We found no statistically significant difference by race in the association between AUC hormone (cortisol, ACTH, and prolactin) and pre-TSST S-Anxiety scores, post-TSST S-Anxiety scores, and change in S-anxiety scores pre- and post-TSST. This negative finding was true even after controlling for baseline AUC hormone, pre-TSST S-anxiety scores, gender, level of education, income, anxiety measures that predicted hormone response with a P-value of <0.1, BDI-II scores, and NEO-PI-R neuroticism and extraversion scores.
Discussion
We found that whites had a significantly greater HPA axis response to psychological stress compared to blacks. These findings were persistent after adjustment for potential social and psychological confounders. Also of note, there was a race difference in HPA axis response even after accounting for any gender difference. We found no differences in subjective anxiety response to the TSST to explain the difference in hormonal response. Additionally, we found no differences in prolactin response between the two racial groups.
Our findings complement previous studies that have suggested racial differences in cortisol secretion. For instance, lower levels of morning cortisol have been described among blacks compared with whites, while accounting for perceived stress (Bennett et al., 2004). There is also evidence that race and ethnicity influences the diurnal variations in cortisol (Cohen et al., 2006;Gallagher-Thompson et al., 2006;McCallum et al., 2006). For instance, one study reported that blacks exhibit a flatter cortisol rhythm at the end of the day relative to whites, independent of socioeconomic status (Cohen et al., 2006). Similarly, another study showed that black females have flatter cortisol slopes during the day compared with their white counterparts (McCallum et al., 2006). In addition to our study, the above studies offer several lines of evidence that there may be racial differences in the HPA axis.
These racial differences in adrenocortical response to psychological stress contrast the absence of such racial variations in cortisol following physical stimuli. Yanovski et al (Yanovski et al., 2000) demonstrated that there are no racial differences in cortisol secretion in response to exercise, despite noting differences in immunoreactive ACTH secretion. Another study similarly demonstrated the lack of association between race and cortisol response to exercise (Giannopoulou et al., 2003). Additionally, the same group demonstrated that while immunoreactive ACTH in response to ovine corticotrophin releasing hormone differed between black and whites in several studies, cortisol responses remained similar (Yanovski et al., 1996a;Yanovski et al., 1995;Yanovski et al., 1993;Yanovski et al., 1996b). The discrepancy between these studies and our own findings suggest that hormonal pathways culminating in cortisol secretion may vary by type of stimulus.
Wilcox et al (Wilcox et al., 2005) also evaluated the influence of race on the cortisol response to a psychological stimulus. In contrast to our findings, they showed that blacks had higher cortisol levels than whites following an interpersonal challenge. However, there were several limitations to their study. For instance, the population was limited to post-menopausal women. Also, several important confounders of the HPA axis response to stress were not accounted for, such as the presence of medical disease, medications affecting cortisol (including antidepressants and hormone replacement therapy), and smoking. Furthermore, the stressor elicited a cortisol response in only 35% of the subjects.
Like ACTH, prolactin is a pituitary hormone that increases in response to stress. However, its regulation is distinct from that of ACTH (Van de Kar and Blair, 1999). Previous research has shown that there is a prolactin response to psychological stress (Kirschbaum et al., 1993;Sobrinho et al., 2003). Recently, our group has recently shown that prolactin response to the TSST does not differ as a function of a family history of alcoholism (Uhart et al., 2006b). To the best of our knowledge, this is the first study to ask whether prolactin response to a psychological stresor differ as a function of race. Since there was no difference in prolactin response as there was in HPA axis response between whites and blacks, it would suggest that racial differences do not extend to all neuroendocrine stress responses. Of note, a recent study found no differences in baseline prolactin levels between whites, blacks, and Asian Americans (Pinheiro et al., 2005).
Our ability to control for several important medical, social and psychological confounders was an important strength of our study. Subjects were carefully screened for any physical and mental health problems; alcohol, smoking and substance dependence; and potentially interfering medications. We found racial differences in cortisol and ACTH response that were independent of socioeconomic status, which has been shown to influences the HPA axis (Brandtstadter et al., 1991;Cohen et al., 2006;Steptoe et al., 2003). We were also able to control for several potential psychological differences, namely anxiety, mood, and personality components, the latter of which we recently found to be associated with cortisol responses to psychological stress (Oswald et al., 2006). We also controlled for gender, another possible determinant of this stress response (Uhart et al., 2006a). The persistence of a 36% difference in cortisol response even after adjustment for social and psychological factors suggest that underlying biological and genetic influences may contribute to the observed racial differences. Interestingly, controlling for social and psychological factors did not dramatically alter the point estimate of this racial difference. Similarly, Cohen et al (Cohen et al., 2006) did not find that behavioral and psychological factors accounted for much of the race effect.
There were, however, some weaknesses to our study. Other potentially important confounders, such as adverse childhood events and social support were unaccounted for. Additionally, while we measured perceived anxiety, we did not directly measure perceived stress. The racial difference in ACTH was observed at only one time point, which was immediately after the TSST. Thus, it would be desirable to substantiate this finding in a larger study. Also, it is possible that the study was underpowered to observe a difference in prolactin response. Perhaps the most significant limitation is the study’s generalizability to real-life psychological stressors and to the general population. Our study population was comprised of only young and healthy individuals. Thus, our findings should be further confirmed utilizing other types of stressors and other study populations.
Our findings provide the foundations for further research on the underlying mechanisms of racial differences in HPA response to psychological stress and their potential implications for chronic diseases. Further studies into the pathophysiological pathways of these racial differences may provide insight into the biological basis of racial disparities in HPA-axis-related diseases prominent in the public health landscape. The generalizability of our findings to other stressors such as inflammation or trauma may provide a basis for pharmacogenomic prediction of effectiveness for corticosteroid-based therapies. We hope that these novel findings will spur future studies that will replicate, generalize, and expound on the neuroendocrinological basis of racial variations in stress-related conditions.
Acknowledgments
This study was supported by NIH grants AA10158 (GSW), 1K23AA016323-01 (RYC), and the Johns Hopkins Hospital General Clinical Research Center. We thank all of our research team members for their efforts, Blair Anton for her help with the literature searches, and Drs. Angeline Chong and Geoffrey Nguyen for editing this manuscript.
Footnotes
Publisher's Disclaimer: This is a PDF file of an unedited manuscript that has been accepted for publication. As a service to our customers we are providing this early version of the manuscript. The manuscript will undergo copyediting, typesetting, and review of the resulting proof before it is published in its final citable form. Please note that during the production process errors may be discovered which could affect the content, and all legal disclaimers that apply to the journal pertain.
References
- Beck AT, Steer RA, Brown G. Beck Depression Inventory-II Manual. San Antonio, Texas: 2007. [Google Scholar]
- Bennett GG, Merritt MM, Wolin KY. Ethnicity, education, and the cortisol response to awakening: a preliminary investigation. Ethn Health. 2004;9:337–347. doi: 10.1080/1355785042000285366. [DOI] [PubMed] [Google Scholar]
- Brandtstadter J, Baltes-Gotz B, Kirschbaum C, Hellhammer D. Developmental and personality correlates of adrenocortical activity as indexed by salivary cortisol: observations in the age range of 35 to 65 years. J Psychosom Res. 1991;35:173–185. doi: 10.1016/0022-3999(91)90072-v. [DOI] [PubMed] [Google Scholar]
- Bucholz KK, Cadoret R, Cloninger CR, Dinwiddie SH, Hesselbrock VM, Nurnberger JI, Jr, Reich T, Schmidt I, Schuckit MA. A new, semi-structured psychiatric interview for use in genetic linkage studies: a report on the reliability of the SSAGA. J Stud Alcohol. 1994;55:149–158. doi: 10.15288/jsa.1994.55.149. [DOI] [PubMed] [Google Scholar]
- Centers for Disease Control. [(Accessed February 18, 2006). 2007]; http://www.cdc.gov/diabetes/pubs/estimates05.htm#prev4.
- Cohen S, Kamarck T, Mermelstein R. A global measure of perceived stress. J Health Soc Behav. 1983;24:385–396. [PubMed] [Google Scholar]
- Cohen S, Schwartz JE, Epel E, Kirschbaum C, Sidney S, Seeman T. Socioeconomic status, race, and diurnal cortisol decline in the Coronary Artery Risk Development in Young Adults (CARDIA) Study. Psychosom Med. 2006;68:41–50. doi: 10.1097/01.psy.0000195967.51768.ea. [DOI] [PubMed] [Google Scholar]
- Costa PT, McCrae RR. Normal personality assessment in clinical practice: the NEO Personality Inventory. Psychol Assess. 1992a:5–13. [Google Scholar]
- Costa PT, McCrae RR. Revised NEO Personality Inventory: Professional Manual. Odessa, FL: 1992b. [Google Scholar]
- Delongis A. The relationship of everyday stress to health and well-being: Inter- and intraindividual approaches. University of California; Berkley: 1985. [Google Scholar]
- Delongis A, Folkman S, Lazarus RS. The Impact of Daily Stress on Health and Mood - Psychological and Social Resources As Mediators. Journal of Personality and Social Psychology. 1988;54:486–495. doi: 10.1037//0022-3514.54.3.486. [DOI] [PubMed] [Google Scholar]
- Department of Health and Human Services. National Health and Nutrition Examination Survey (NHANES), Osteoporosis. 2007. Washington, DC: Centers for Disease Control and Precention, National Center for Halth Statistics; 2002. www.cdc.gov/nchs/data/nhanes/databriefs/osteoporosis.pdf. [Google Scholar]
- Dozois DJA, Dobson KS. Part II: Approaches for specific psychological problems, Depression. In: Antony MM, Barlow DH, editors. Handbook of Assessment and Treatment Planning for Psychological Disorders. Guilford Press; New York: 2004. pp. 259–299. [Google Scholar]
- Ferdinand KC, Saunders E. Hypertension-related morbidity and mortality in African Americans--why we need to do better. J Clin Hypertens (Greenwich) 2006;8:21–30. doi: 10.1111/j.1524-6175.2006.05295.x. [DOI] [PMC free article] [PubMed] [Google Scholar]
- Gallagher-Thompson D, Shurgot GR, Rider K, Gray HL, McKibbin CL, Kraemer HC, Sephton SE, Thompson LW. Ethnicity, stress, and cortisol function in Hispanic and non-Hispanic white women: A preliminary study of family dementia caregivers and noncaregivers. Am J Geriatr Psychiatry. 2006;14:334–342. doi: 10.1097/01.JGP.0000206485.73618.87. [DOI] [PubMed] [Google Scholar]
- Giannopoulou I, Carhart R, Sauro LM, Kanaley JA. Adrenocortical responses to submaximal exercise in postmenopausal black and white women. Metabolism. 2003;52:1643–1647. doi: 10.1016/s0026-0495(03)00312-3. [DOI] [PubMed] [Google Scholar]
- Gold PW, Chrousos GP. Organization of the stress system and its dysregulation in melancholic and atypical depression: high vs low CRH/NE states. Mol Psychiatry. 2002;7:254–275. doi: 10.1038/sj.mp.4001032. [DOI] [PubMed] [Google Scholar]
- Kessler RC, Berglund P, Demler O, Jin R, Merikangas KR, Walters EE. Lifetime prevalence and age-of-onset distributions of DSM-IV disorders in the National Comorbidity Survey Replication. Arch Gen Psychiatry. 2005;62:593–602. doi: 10.1001/archpsyc.62.6.593. [DOI] [PubMed] [Google Scholar]
- Kirschbaum C, Pirke KM, Hellhammer DH. The ‘Trier Social Stress Test’--a tool for investigating psychobiological stress responses in a laboratory setting. Neuropsychobiology. 1993;28:76–81. doi: 10.1159/000119004. [DOI] [PubMed] [Google Scholar]
- Lazarus RS, Folkman S. Manual Hassles and Uplifts Scales. Redwood City, CA: Mind Garden; 1989. [Google Scholar]
- McCallum TJ, Sorocco KH, Fritsch T. Mental health and diurnal salivary cortisol patterns among African American and European American female dementia family caregivers. Am J Geriatr Psychiatry. 2006;14:684–693. doi: 10.1097/01.JGP.0000225109.85406.89. [DOI] [PubMed] [Google Scholar]
- McEwen BS. Protective and damaging effects of stress mediators. N Engl J Med. 1998;338:171–179. doi: 10.1056/NEJM199801153380307. [DOI] [PubMed] [Google Scholar]
- National Heart Lung and Blood Institute, National Institutes of Health. Morbidity and Mortality: 2004 Chartbook on Cardiovascular, Lung, and Blood Diseases. Bethesda, MD: [Accessed Februrary 19, 2007]. 2005. http://www.nhlbi.nih.gov/resources/docs/04a_chtbk.pdf. [Google Scholar]
- Oswald LM, Zandi P, Nestadt G, Potash JB, Kalaydjian AE, Wand GS. Relationship between cortisol responses to stress and personality. Neuropsychopharmacology. 2006;31:1583–1591. doi: 10.1038/sj.npp.1301012. [DOI] [PubMed] [Google Scholar]
- Pinheiro SP, Holmes MD, Pollak MN, Barbieri RL, Hankinson SE. Racial differences in premenopausal endogenous hormones. Cancer Epidemiol Biomarkers Prev. 2005;14:2147–2153. doi: 10.1158/1055-9965.EPI-04-0944. [DOI] [PubMed] [Google Scholar]
- Richardson CG, Ratner PA. A confirmatory factor analysis of the Fagerstrom Test for Nicotine Dependence. Addict Behav. 2005;30:697–709. doi: 10.1016/j.addbeh.2004.08.015. [DOI] [PubMed] [Google Scholar]
- Sapolsky RM. Glucocorticoids, stress, and their adverse neurological effects: relevance to aging. Exp Gerontol. 1999;34:721–732. doi: 10.1016/s0531-5565(99)00047-9. [DOI] [PubMed] [Google Scholar]
- Sarason IG, Johnson JH, Siegel JM. Assessing the impact of life changes: development of the Life Experiences Survey. J Consult Clin Psychol. 1978;46:932–946. doi: 10.1037//0022-006x.46.5.932. [DOI] [PubMed] [Google Scholar]
- Shaw WS, Dimsdale JE, Patterson TL. Stress and life events measures. In: Rush AJ, editor. Handbook of Psychiatric Measures. American Psychiatric Publishing, Inc; 2000. pp. 221–238. [Google Scholar]
- Sobrinho LG, Simoes M, Barbosa L, Raposo JF, Pratas S, Fernandes PL, Santos MA. Cortisol, prolactin, growth hormone and neurovegetative responses to emotions elicited during an hypnoidal state. Psychoneuroendocrinology. 2003;28:1–17. doi: 10.1016/s0306-4530(01)00100-7. [DOI] [PubMed] [Google Scholar]
- Soderstrom MS, Grimm PM. II: Instruments for assessing health and function, 23: Measuring anxiety. In: Frank-Stromberg M, Oslen SJ, editors. Instruments of Clinical Health Care Research. 2007. p. 366. [Google Scholar]
- Spielberger CD. State-Trait Anxiety Inventory (STAI) Manual. Redwood City, CA: 1983. [Google Scholar]
- Steptoe A, Kunz-Ebrecht S, Owen N, Feldman PJ, Willemsen G, Kirschbaum C, Marmot M. Socioeconomic status and stress-related biological responses over the working day. Psychosom Med. 2003;65:461–470. doi: 10.1097/01.psy.0000035717.78650.a1. [DOI] [PubMed] [Google Scholar]
- Tsigos C, Chrousos GP. Hypothalamic-pituitary-adrenal axis, neuroendocrine factors and stress. J Psychosom Res. 2002;53:865–871. doi: 10.1016/s0022-3999(02)00429-4. [DOI] [PubMed] [Google Scholar]
- Uhart M, Chong RY, Oswald L, Lin PI, Wand GS. Gender differences in hypothalamic-pituitary-adrenal (HPA) axis reactivity. Psychoneuroendocrinology. 2006a;31:642–652. doi: 10.1016/j.psyneuen.2006.02.003. [DOI] [PubMed] [Google Scholar]
- Uhart M, McCaul ME, Oswald LM, Choi L, Wand GS. GABRA6 gene polymorphism and an attenuated stress response. Mol Psychiatry. 2004;9:998–1006. doi: 10.1038/sj.mp.4001535. [DOI] [PubMed] [Google Scholar]
- Uhart M, Oswald L, McCaul ME, Chong R, Wand GS. Hormonal responses to psychological stress and family history of alcoholism. Neuropsychopharmacology. 2006b;31:2255–2263. doi: 10.1038/sj.npp.1301063. [DOI] [PubMed] [Google Scholar]
- Van de Kar LD, Blair ML. Forebrain pathways mediating stress-induced hormone secretion. Front Neuroendocrinol. 1999;20:1–48. doi: 10.1006/frne.1998.0172. [DOI] [PubMed] [Google Scholar]
- Wilcox S, Bopp M, Wilson DK, Fulk LJ, Hand GA. Race differences in cardiovascular and cortisol responses to an interpersonal challenge in women who are family caregivers. Ethn Dis. 2005;15:17–24. [PubMed] [Google Scholar]
- Workman EA. Chapter 16: The measurement of stress and its effects Handbook of psychiatric measures. CRC Press. 1998:295–308. [Google Scholar]
- Yanovski JA, Yanovski SZ, Boyle AJ, Gold PW, Sovik KN, Sebring NG, Drinkard B. Hypothalamic-pituitary-adrenal axis activity during exercise in African American and Caucasian women. J Clin Endocrinol Metab. 2000;85:2660–2663. doi: 10.1210/jcem.85.8.6708. [DOI] [PubMed] [Google Scholar]
- Yanovski JA, Yanovski SZ, Cutler GB, Jr, Chrousos GP, Filmer KM. Differences in the hypothalamic-pituitary-adrenal axis of black girls and white girls. J Pediatr. 1996a;129:130–135. doi: 10.1016/s0022-3476(96)70199-3. [DOI] [PubMed] [Google Scholar]
- Yanovski JA, Yanovski SZ, Friedman TC, Loh YP, Jayasvasti V, Cutler GB, Jr, Chrousos GP. Etiology of the differences in corticotropin-releasing hormone-induced adrenocorticotropin secretion of black and white women. J Clin Endocrinol Metab. 1996b;81:3307–3311. doi: 10.1210/jcem.81.9.8784088. [DOI] [PubMed] [Google Scholar]
- Yanovski JA, Yanovski SZ, Gold PW, Chrousos GP. Differences in the hypothalamic-pituitary-adrenal axis of black and white women. J Clin Endocrinol Metab. 1993;77:536–541. doi: 10.1210/jcem.77.2.8393890. [DOI] [PubMed] [Google Scholar]
- Yanovski JA, Yanovski SZ, Harrington L, Gold PW, Chrousos GP. Differences in the hypothalamic-pituitary-adrenal axis of black and white men. Horm Res. 1995;44:208–212. doi: 10.1159/000184627. [DOI] [PubMed] [Google Scholar]