

Abstract
Recently, large-scale benign copy-number variations (CNVs)—encompassing over 12% of the genome and containing genes considered to be dosage tolerant for human development—were uncovered in the human population. Here we present a family with a novel autosomal-dominantly inherited syndrome characterized by microtia, eye coloboma, and imperforation of the nasolacrimal duct. This phenotype is linked to a cytogenetically visible alteration at 4pter consisting of five copies of a copy-number-variable region, encompassing a low-copy repeat (LCR)-rich sequence. We demonstrate that the ∼750 kb amplicon occurs in exact tandem copies. This is the first example of an amplified CNV associated with a Mendelian disorder, a discovery that implies that genome screens for genetic disorders should include the analysis of so-called benign CNVs and LCRs.
Main Text
We examined a large family with autosomal-dominant inheritance of microtia and nasolacrimal-duct imperforation associated with variable degrees of eye coloboma (Figure 1). High-resolution cytogenetic analysis was performed on nine family members (II:3, II:4, II:8, II:5, III:3, III:4, III:5, III:6, III:7) and revealed an aberrant karyotype 46, XY, add(4)(pter) segregating with the phenotype.
Figure 1.
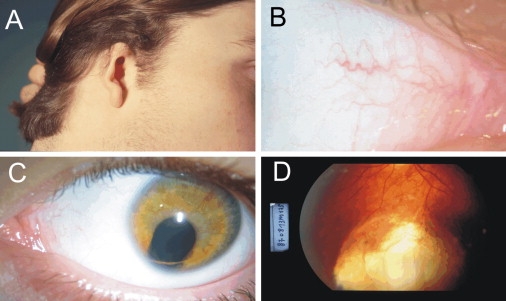
Phenotype of the Patients
(A) Right microtia, (B) imperforated nasolacrimal duct, (C) left-eye coloboma of the iris, and (D) chorioretinal coloboma.
Two-point linkage analysis (Fastlink package)1,2 with a series of polymorphic markers derived from 4pter resulted in a LOD score > 2.4 for markers D4S2923, D4S1582, and D4S2946, with a highest LOD score of 3.03 at ϑ = 0 for D4S2923 (Figure 2). Inferring the genotype of patient II:5 for D4S2923 raises the maximum LOD score to 3.2. None of the informative markers were duplicated or deleted. With the visible alteration used as a rare marker, the maximum possible LOD score of 3.6 was obtained. In addition, full genome analysis using the 250K Nsp1 SNP arrays (Affymetrix, Santa Clara, California) of the affected and nonaffected family members was performed. Parametric linkage (penetrance 99% and phenocopy rate 1%) was performed with Genehunter and Dchip softwares. Only the 4p16 locus had a LOD score > 3. The highest LOD score of 3.1–3.8 was obtained for a 12.8 Mb region corresponding to that from the marker analysis (8.2–21.0 Mb) (Figure 3). Material was not available from II:9 member of the family.
Figure 2.
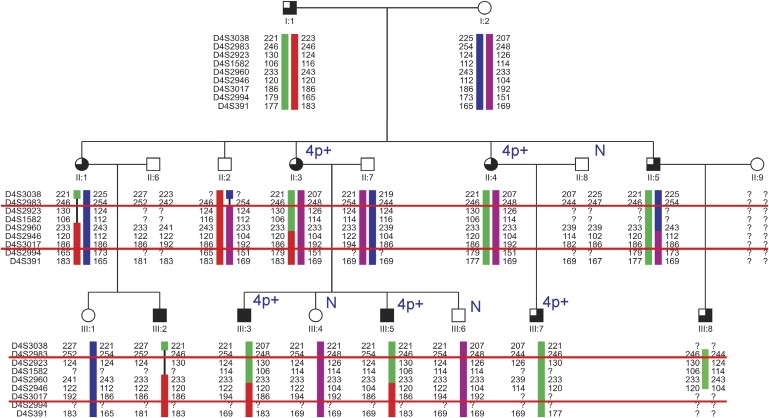
Linkage of the Phenotype with 4p15-4p16.1
Primer sequences for linkage analysis were as published (GDB Human Genome Database). The region between the red lines is linked with the phenotype. Patients with eye coloboma are indicated by a filled upper-left square, patients with absent canaliculi are indicated by a filled lower-left square, and patients with microtia are indicated by filled upper- and lower-right squares. In those family members karyotyped, it is indicated whether only normal chromosomes 4 were identified (N) or an abnormal chromosome 4 was detected (4p+). No material was available from the II:9 family member.
Figure 3.
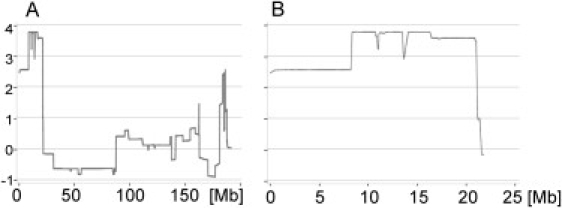
The LOD Score for Chromosome 4 Calculated from the 250K SNP Array Analysis of the Affected and Unaffected Family Members
On the x axis is shown the position on chromosome 4 in megabases (Mb); on the y axis is shown the corresponding LOD score.
(A) The LOD score for the entire chromosome 4.
(B) Detailed view on the region from 1–25 Mb showing the maximum LOD score of 3.1–3.79 for the region from 8.2 to 21.0 Mb.
Multicolor fluorescent in situ hybridization (MFISH; Metasystems) using 24 whole-chromosome painting probes and FISH using a chromosome 4-specific paint (Vysis, Downers Grove, Illinois) showed that the entire additional material was derived from 4p, exclusively (Figures 4B). Subsequent chromosome 4 multicolor banding3 revealed an increased signal, suggesting that the apparent rearrangement was caused by a duplication or amplification within 4p15–4p16 (Figure 4C). In order to fine-map this region, we performed array comparative genomic hybridization (CGH) with 1 Mb resolution4,5 and subsequently a contiguous 4p-specific tiling-path array.6 While the result from the 1 Mb array was normal, four out of six contiguous clones on the chromosome 4p tiling-path array presented with ratios slightly above the set threshold (four times the standard deviation) (Figure 4D). FISH analysis with all six clones showed stronger signals at one of the p arms of chromosome 4 in the affected patients, whereas signal intensities were equal in both chromosomes in the nonaffected family members. Furthermore, all but one clone (RP11-637J21) hybridized at multiple genomic loci (Figure 5A).
Figure 4.
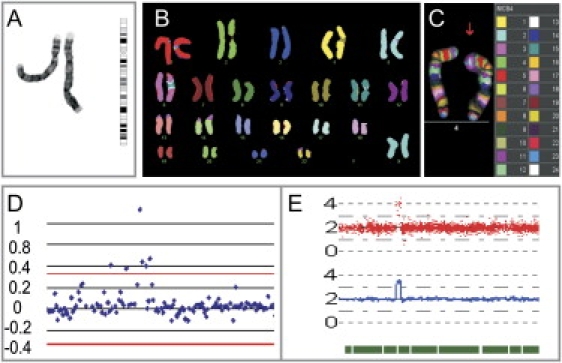
Identification of the Aberration on Chromosome 4
(A) Partial karyotype of the patient showing the G-banded normal and aberrant chromosome 4. On the right, an ideogram of a normal chromosome 4 is presented.
(B) MFISH analysis showing that only genetic material from chromosome 4 is present in the 4p+.
(C) Multicolor-banding FISH shows that the chromosome 4p cytogenetic anomaly is caused by the 4p15-16 region, and the pink band is larger on the altered chromosome than on normal one.
(D) Tiling-path array of chromosome 4pter demonstrates the amplification. The red line indicates the 4 × the standard deviation (SD) threshold.
(E) Copy-number analysis for Genechip (CNAG) view of copy-number analysis of chromosome 4 by 250K SNP array (Genome Laboratory, Tokyo University). Red spots represent log2 ratios of the signal intensities between the sample and the references for each SNP. The blue line shows the averaged log2 ratios and the green bar the heterozygous SNPs.
Figure 5.
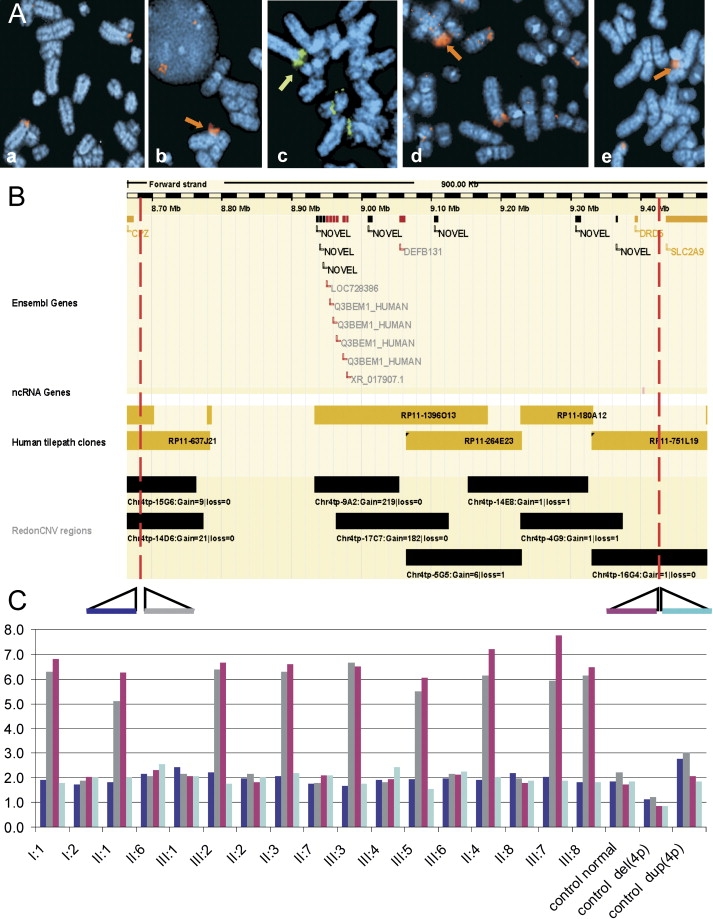
Delineation of the Breakpoints of the Amplicon
(A) FISH confirmation of the array CGH data and delineation of the CNV. FISH using (Aa) RP11-689P11 (not amplified), (Ab) RP11-637J21 and (Ae) RP11-751L19 (amplified at 4p16), and (Ac) RP11-264E23 and (Ad) RP11-180A12 (amplified at 4p and multiple loci scattered across the genome) is shown.
(B) Ensembl view (Ensembl release 45, June 2007) for chr 4p16 (from 8.67 Mb to 9.57 Mb) showing the Ensembl genes, nc RNA genes, the tiling-path clones, and Redon CNV regions.
(C) Q-PCR result showing the copy numbers of the family members and of the controls for the different primer pairs, estimated with the dCt method and p53 as a reference gene (primers 5′-CCCAAGCAATGGATGATTTGA-3′ and 5′-GAGCTTCATCTGGACCTGGGT-3′). The relative location of the primers to the amplified region is shown with colored bars. Dark blue is for the primer located at 8.6672 Mb, gray is for the one at 8.7802 Mb, purple is for the one at 9.4241 Mb, and light blue is for the one at 9.4242 Mb. The numbers indicating the family members are the same as in Figure 2. The colors in the graphic correspond to the different amplicons. The duplication control is a patient with t(4,8) with breakpoint at the ORGC region.
To delineate the size and determine the number of copies present in the amplified region, we performed a series of quantitative PCR (Q-PCR) experiments (Applied Biosystems). The number of alleles present was quantified with the comparative threshold cycle (dCt) method with p53 as reference gene.7 The distal breakpoint was found to be located between 8.670 Mb and 8.684 Mb, and the proximal breakpoint was found between 9.424 Mb and 9.426 Mb. The dCt values for the primer pairs within the amplified region corresponded to a 3-fold difference between the affected family members and the normal controls. On the basis of the Q-PCR profiles, we concluded that the amplified region is present in six copies in all affected family members. Moreover, the same copy number was reported by all seven primer pairs used (Table 1) (Figure 5C).
Table 1.
Primers Used for Q-PCR
| Primer Forward | Primer Reverse | Position of the Amplicon on Chr 4 (bp) | Number of Copies |
|---|---|---|---|
| AGGCAATCATGAAGTGGATGC | GGTAGGACACCACCAGGTCG | 8,659,910 | 2 |
| GTAGCCTCACTGCCCCATACA | ATGGTGGACAGTTAACCCCAAA | 8,667,208 | 2 |
| CGCTAAATGCGAGTCCATGA | TGTCCACACTTCGCTGCTTAA | 8,669,413 | 2 |
| AAGGCCAGGCAAGCAGTAAG | AGCGCGGTTTCTTCATCGT | 8,670,551 | 2 |
| GGCACAACAGCGCTTGGTa | GCTGTGAGATGTTCCCCAAACb | 8,673,720 | 6 |
| 8,679,358 | |||
| 8,684,996 | |||
| CCTCAAGTCTTACACTGGCACAAa | CCCCAAACACTCCAGATCATTC | 8,673,704 | 6 |
| 8,679,342 | |||
| 8,684,980 | |||
| CTCCCAAAGCAAAGCTTGT | CCACCCATTGGTCAGAGAAC | 8,780,496 | 6 |
| TTGGCCTGGGAATTGGAA | AAGTGGTTTGCCAAGGACAAA | 9,413,780 | 6 |
| CCCTGGGTATCATATCCTGTTGTC | GAGCAACACTAACATTCCCATGAC | 9,419,991 | 6 |
| CTTGTTCACTCCCATGTCTTCAG | ATCAAACTGCGAAGAGGGAAA | 9,424,070 | 6 |
| TCACTGGAGATGCAGCTCACATb | GCCTTGTGAAGGGA ATGAATG | 9,424,148 | 6 |
| TGCCAGAAAAGTGGAACCCTAA | TTGCACATCTCCCATGATAGACTCT | 9,424,299 | 2 |
| GCCCCACAGATACAACTTGTCAA | AAGGGCACAAGGCAAATGAG | 9,426,001 | 2 |
| GGAGCTGGACTAGAGTTTGGTCAA | CAAGCAATTCCCAGGACAAAG | 9,429,390 | 2 |
| TCTGCCCAGGGTTGCTAGTT | CCAGCTGCTAGTTCTGGCTAAGT | 9,433,782 | 2 |
The amplicon is in an LCR region; therefore, the primers bind to three loci.
These primers were used for breakpoint-spanning PCR.
To determine the orientation of the additional sequences in the affected family members, we performed a series of PCRs with various combinations of primers at both sides of the breakpoint (for the sequence of the primers, see Table 1) (Figure 6A). By use of this strategy, a product was only obtained when the forward primer from the distal side and the reverse primer from the proximal side were combined, showing that at least two fragments are in tandem. No amplification occurred between the other two combinations of primers. We did obtain a fragment for the affected family members studied, whereas no amplification occurred in the nonaffected family members or in controls (Figure 6B). The product of the breakpoint-spanning PCR was sequenced. We found a unique breakpoint for the proximal side at 9.42 Mb and a breakpoint in a low-copy repeat (LCR) region for the distal side located at 8.673 Mb and at 8.679 Mb. Furthermore, we identified at the junction a three-nucleotide sequence overlap (Figure 6C). To confirm these results, we also performed Southern-blot analysis (Figure 6D). After digestion of the genomic DNA with BglII and Stu I enzymes (Roche Applied Science), the fragments were hybridized against a PCR-generated probe from the amplified region. In the affected family members, a single novel fragment, corresponding in size with tandem copies of the region, was observed with 2-fold-higher intensities compared to the wild-type. In the nonaffected family members and the normal controls, only the wild-type fragment was observed. In summary, affected family members carry on one chromosome 4p five tandem copies of an identical ∼750 kb DNA fragment.
Figure 6.
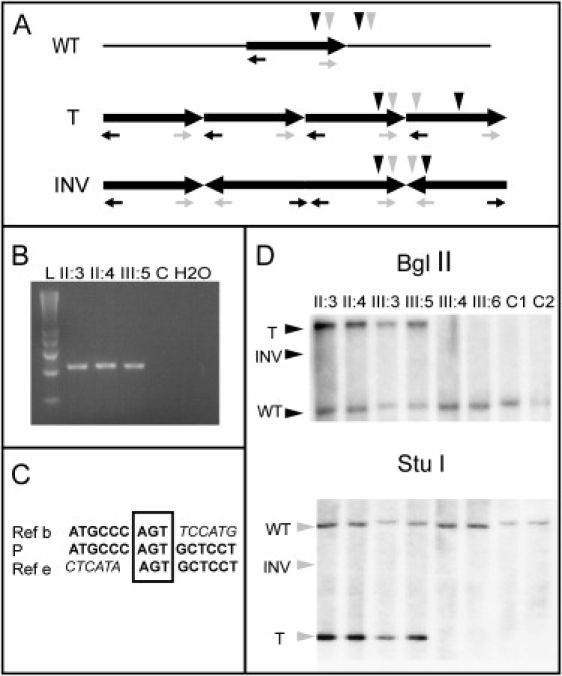
Analysis of the Orientation of the Fragments
(A) Schematic view of the different possible alleles: wild-type (“WT”), tandem (“T”), and inverted (“INV”). The black and gray horizontal arrows indicate the reverse and the forward primer from the distal and proximal side of the amplified region, respectively. PCR with different combination of primers was performed: forward distal and reverse proximal, only the forward proximal and only the reverse distal primers. The vertical black and gray arrows show relative position of the restriction sites for BglII and StuI, respectively.
(B) PCR product generated from the first combination of primers, present in the patients and not present in the control. “L” indicates ladder.
(C) Sequence fragment showing the breakpoint. “Ref b” indicates reference sequence from the beginning of the amplified region, “P” (patient) indicates sequence derived from the breakpoint spanning PCR, and “Ref e” indicates reference sequence from the end of the region. The 3 nucleotide sequence homology is indicated in the box.
(D) Southern-blot analysis. Genomic DNA was digested with BglII and StuI enzymes, and the fragments were detected with a PCR-generated probe (primers 5′-CTAACATACCTGCTCTCATC-3′ and 5′-CTCTGGGAGTTCAGATCATT-3′). The horizontal arrows indicate the three possible alleles: wild-type (“WT”), tandem (“T”), and inverted (“INV”). For both enzymes, a presence of the wild-type and the tandem allele in the patients and absence of an inverted allele is shown. The unaffected family members and the controls have only the wild-type allele.
Sequence analysis revealed that this region encompasses LCRs known to be copy number variable in the normal population and harboring multiple paralogous sites in the genome. Gains and losses of all annotated genes in the region were described not only in 270 HapMap individuals, but also in other populations screened for copy-number variations (CNVs)8–13 (Figure 5B). However, no individual carrying this specific 750 kb amplicon has been reported in any of these studies. To exclude the possibility that this specific 750 kb amplicon might be present in the Belgium population, we screened 200 control individuals. No individual carrying this specific amplicon could be detected.
Among the genes located in the amplified interval are olfactory receptor genes, the beta-defensin genes and the Deubiquitinating enzyme 3 and 4 (DUB) genes. More than 30 genomic locations are known for the olfactory receptor gene cluster (ORGC), the beta-defensins are present on chromosomes 4, 8, and 11, and the DUB genes are present on chromosomes 4, 7, and 8.14,15 The dopamine receptor D5 gene (DRD5) is the only single-locus gene located in the amplified region. Nevertheless, all these genes were found to be copy number variable in the normal population. The amplification of these genes cannot explain the observed phenotype, unless the presence of six copies dramatically alters their functional properties. Alternatively, the amplification can generate a long-range effect on gene expression level.16 However, given that microtia and lacrimal-duct anomalies have never been observed in patients with partial 4p16 deletions, duplications, or translocations,17,18 this amplification is unlikely to involve an altered expression level of a nearby gene. The amplification might rather cause structural modifications leading to ectopic expression.11 Another possibility is that two rare events coincided and that this amplification is accompanied by another gain-of-function mutation cosegregating with this amplicon.
A CNV can be simple in structure, such as a tandem duplication or a deletion, or it may involve complex gains or losses of homologous sequences at low-copy repeats in multiple sites of the genome.12,13 Recently, it has been shown that benign, simple CNVs may carry risks for complex disease traits.13,18–21 Copy-number variation of complex CNVs including the LCRs is (usually) not taken into consideration when screening for disease phenotypes by use of array CGH. This has two reasons: (1) Because these regions are copy number variable in the normal population, changes in copy numbers at these sites are not considered pathogenic; (2) it is technically difficult if not impossible to determine copy-number changes at these loci because the presence of multiple paralogous sites in the genome obscures their detection, and even when detected, the location of the copy-number change cannot be traced. For this reason, many current commercial array platforms are devoid of these complex regions. It is the familial occurrence and linkage pattern of the phenotype described in this study that directed us to investigate this specific LCR in detail. The association of this amplification with a Mendelian inherited trait suggests, however, that these regions should be taken into consideration when studying disease phenotypes.
Although amplifications that cause cytogenetically recognizable chromosome aberrations are well known in cancer cytogenetics, only a few examples of inheritable amplifications of euchromatic regions exist.22 Amplicon structure in these cases has, because of technical difficulties, never been investigated at a molecular level. Equally, the structure of the recently uncovered copy-number variability of low copy repeats has not yet been investigated at a molecular level. The combination of the techniques used in this study, however, allowed the detection of five tandem copies of the described amplicon in the affected family members. Such an amplification cannot be explained by a mere nonallelic homologous-recombination event, the main mechanism generating duplications in inherited disorders,23 nor by the breakage-fusion-bridge cycles, which generally explain amplifications in cancers.24,25 Recently, adaptive amplification has been uncovered as a novel stress-induced mutation mechanism in Escherichia coli.26 These amplicons have many similarities with those seen in our family: They are large (with respect to the E. coli genome), are clonally stable (no copy-number variability within a clone), and are organized in tandem. How these amplicons arose remains unclear, but two mechanisms have been proposed. First, following an initial duplication that may arise through nonhomologous end joining27,28 or template switching within replication forks,29 subsequent rounds of unequal crossing over among the repeated sequence may lead to an increase in copy number. Arguing against this model is that this specific amplicon could not be detected as a common variant in the population. Another possibility is that the amplification arises via rolling-circle amplification. In this second model, a circle is formed by annealing broken double-stranded ends (DSEs). When the circle is closed by ligation, a replication fork can pass repeatedly, thus producing numerous tandem copies of the circularized sequence. Breakage of the circle restores the DSE, which will be reintegrated by nonhomologous recombination.30–32 This hypothesis can explain the finding of identically sized fragments and three-base sequence microhomology at the breakpoint; the latter is indicative of nonhomologous end joining.
In conclusion, this unique novel syndrome reported here is to our knowledge the first Mendelian inherited genetic disorder associated with the amplification of a CNV. This finding may well represent the first example of a group of inherited disorders caused by the amplification of large genomic regions known to be copy number variable and underscores the need to include these benign CNVs in genome-wide analyzes when screening for copy-number imbalances in genetic disorders.
Acknowledgments
We would like to thank Philippa Carr for help with the hybridizations on the 1 Mb array; Prof. Philip J. Hastings from Baylor College of Medicine, Texas, for his comments on the mechanism of the amplification; John Engelen for providing a 4pter painting probe; Ivo Salden for his help with marker analysis; Bernard Thienpont for interesting personal communications; the MicroArray Facility, Flanders Interuniversity Institute for Biotechnology (VIB), and the Sanger Institute Microarray Facility for their help in the spotting of the arrays; and the Mapping Core and Map Finishing groups of the Wellcome Trust Sanger Institute for the initial clone supply and verification. This work was made possible by grant G.0200.03 from the Fonds Wetenschappelijk Onderzoek (FWO) to J.R.V., K.D., and J.P.F.; grants OT/O2/40, GOA/2006/12 to J.R.V., K.D., J.P.F, and G.M.; Centre of Excellence SymBioSys (EF/05/007) from the Research Council K.U.Leuven to J.R.V., K.D., J.P.F., G.M., I.B., Y.M., and S.V.V.; and the Interuniversity Attraction Poles and network 6/05 Concerted Research Actions (A.R.C.) from the Belgian government to J.R.V., K.D., and J.P.F. This work was also made possible by Convention No. 02/07/276 of the Belgian French Community Ministry and the Fonds National de la Recherche Scientifique (FNRS) to M.V., a “Maître de recherches du FNRS.” I.B. is supported by grant OE/07/24 from the Catholic University of Leuven. H.F., N.P.C., and D.V. are supported by the Wellcome Trust Institute.
Web Resources
The URLs for data presented herein are as follows:
Affymetric SNP arrays, http://www.affymetrix.com/support/technical/sample_data/500k_data.affx
Dchip software, http://www.dchip.org
Ensembl genome browser, http://www.ensembl.org/
GDB Human Genome Database, http://gdbwww.gdb.org/
Genehunter software, http://linkage.rockefeller.edu/soft/gh/
Genome Laboratory (Tokyo University), http://www.genome.umin.jp/
References
- 1.Schaffer A.A., Gupta S.K., Shriram K., Cottingham R.W., Jr. Avoiding recomputation in linkage analysis. Hum. Hered. 1994;44:225–237. doi: 10.1159/000154222. [DOI] [PubMed] [Google Scholar]
- 2.Cottingham R.W., Jr., Idury R.M., Schaffer A.A. Faster sequential genetic linkage computations. Am. J. Hum. Genet. 1993;53:252–263. [PMC free article] [PubMed] [Google Scholar]
- 3.Liehr T., Weise A., Heller A., Starke H., Mrasek K., Kuechler A., Weier H.U., Claussen U. Multicolor chromosome banding (MCB) with YAC/BAC-based probes and region-specific microdissection DNA libraries. Cytogenet. Genome Res. 2002;97:43–50. doi: 10.1159/000064043. [DOI] [PubMed] [Google Scholar]
- 4.Fiegler H., Carr P., Douglas E.J., Burford D.C., Hunt S., Scott C.E., Smith J., Vetrie D., Gorman P., Tomlinson I.P. DNA microarrays for comparative genomic hybridization based on DOP-PCR amplification of BAC and PAC clones. Genes Chromosomes Cancer. 2003;36:361–374. doi: 10.1002/gcc.10155. [DOI] [PubMed] [Google Scholar]
- 5.Vermeesch J.R., Melotte C., Froyen G., Van Vooren S., Dutta B., Maas N., Vermeulen S., Menten B., Speleman F., De Moor B. Molecular karyotyping: Array CGH quality criteria for constitutional genetic diagnosis. J. Histochem. Cytochem. 2005;53:413–422. doi: 10.1369/jhc.4A6436.2005. [DOI] [PubMed] [Google Scholar]
- 6.Van Buggenhout G., Melotte C., Dutta B., Froyen G., Van Hummelen P., Marynen P., Matthijs G., de Ravel T., Devriendt K., Fryns J.P. Mild Wolf-Hirschhorn syndrome: Micro-array CGH analysis of atypical 4p16.3 deletions enables refinement of the genotype-phenotype map. J. Med. Genet. 2004;41:691–698. doi: 10.1136/jmg.2003.016865. [DOI] [PMC free article] [PubMed] [Google Scholar]
- 7.Livak K.J., Schmittgen T.D. Analysis of relative gene expression data using real-time quantitative PCR and the 2(-Delta Delta C(T)) method. Methods. 2001;25:402–408. doi: 10.1006/meth.2001.1262. [DOI] [PubMed] [Google Scholar]
- 8.Iafrate A.J., Feuk L., Rivera M.N., Listewnik M.L., Donahoe P.K., Qi Y., Scherer S.W., Lee C. Detection of large-scale variation in the human genome. Nat. Genet. 2004;36:949–951. doi: 10.1038/ng1416. [DOI] [PubMed] [Google Scholar]
- 9.Sebat J., Lakshmi B., Troge J., Alexander J., Young J., Lundin P., Maner S., Massa H., Walker M., Chi M. Large-scale copy number polymorphism in the human genome. Science. 2004;305:525–528. doi: 10.1126/science.1098918. [DOI] [PubMed] [Google Scholar]
- 10.Conrad D.F., Andrews T.D., Carter N.P., Hurles M.E., Pritchard J.K. A high-resolution survey of deletion polymorphism in the human genome. Nat. Genet. 2006;38:75–81. doi: 10.1038/ng1697. [DOI] [PubMed] [Google Scholar]
- 11.Feuk L., Carson A.R., Scherer S.W. Structural variation in the human genome. Nat. Rev. Genet. 2006;7:85–97. doi: 10.1038/nrg1767. [DOI] [PubMed] [Google Scholar]
- 12.Sharp A.J., Locke D.P., McGrath S.D., Cheng Z., Bailey J.A., Vallente R.U., Pertz L.M., Clark R.A., Schwartz S., Segraves R. Segmental duplications and copy-number variation in the human genome. Am. J. Hum. Genet. 2005;77:78–88. doi: 10.1086/431652. [DOI] [PMC free article] [PubMed] [Google Scholar]
- 13.Redon R., Ishikawa S., Fitch K.R., Feuk L., Perry G.H., Andrews T.D., Fiegler H., Shapero M.H., Carson A.R., Chen W. Global variation in copy number in the human genome. Nature. 2006;444:444–454. doi: 10.1038/nature05329. [DOI] [PMC free article] [PubMed] [Google Scholar]
- 14.Hollox E.J., Armour J.A., Barber J.C. Extensive normal copy number variation of a beta-defensin antimicrobial-gene cluster. Am. J. Hum. Genet. 2003;73:591–600. doi: 10.1086/378157. [DOI] [PMC free article] [PubMed] [Google Scholar]
- 15.Yue Y., Haaf T. 7E olfactory receptor gene clusters and evolutionary chromosome rearrangements. Cytogenet. Genome Res. 2006;112:6–10. doi: 10.1159/000087507. [DOI] [PubMed] [Google Scholar]
- 16.Kleinjan D.A., Seawright A., Mella S., Carr C.B., Tyas D.A., Simpson T.I., Mason J.O., Price D.J., van Heyningen V. Long-range downstream enhancers are essential for Pax6 expression. Dev. Biol. 2006;299:563–581. doi: 10.1016/j.ydbio.2006.08.060. [DOI] [PMC free article] [PubMed] [Google Scholar]
- 17.Schinzel A. Walter de Gruyter; Berlin: 2001. Catalogue of Unbalanced Chromosome Aberrations in Man. [Google Scholar]
- 18.Rodriguez L., Zollino M., Mansilla E., Martinez-Fernandez M.L., Perez P., Murdolo M., Martinez-Frias M.L. The first 4p euchromatic variant in a healthy carrier having an unusual reproductive history. Am. J. Med. Genet. A. 2007;143A:995–998. doi: 10.1002/ajmg.a.31681. [DOI] [PubMed] [Google Scholar]
- 19.Gonzalez E., Kulkarni H., Bolivar H., Mangano A., Sanchez R., Catano G., Nibbs R.J., Freedman B.I., Quinones M.P., Bamshad M.J. The influence of CCL3L1 gene-containing segmental duplications on HIV-1/AIDS susceptibility. Science. 2005;307:1434–1440. doi: 10.1126/science.1101160. [DOI] [PubMed] [Google Scholar]
- 20.Sebat J., Lakshmi B., Malhotra D., Troge J., Lese-Martin C., Walsh T., Yamrom B., Yoon S., Krasnitz A., Kendall J. Strong Association of De Novo Copy Number Mutations with Autism. Science. 2007;316:445–449. doi: 10.1126/science.1138659. [DOI] [PMC free article] [PubMed] [Google Scholar]
- 21.Fellermann K., Stange D.E., Schaeffeler E., Schmalzl H., Wehkamp J., Bevins C.L., Reinisch W., Teml A., Schwab M., Lichter P. A chromosome 8 gene-cluster polymorphism with low human beta-defensin 2 gene copy number predisposes to Crohn disease of the colon. Am. J. Hum. Genet. 2006;79:439–448. doi: 10.1086/505915. [DOI] [PMC free article] [PubMed] [Google Scholar]
- 22.Barber J.C. Directly transmitted unbalanced chromosome abnormalities and euchromatic variants. J. Med. Genet. 2005;42:609–629. doi: 10.1136/jmg.2004.026955. [DOI] [PMC free article] [PubMed] [Google Scholar]
- 23.Stankiewicz P., Lupski J.R. Genome architecture, rearrangements and genomic disorders. Trends Genet. 2002;18:74–82. doi: 10.1016/s0168-9525(02)02592-1. [DOI] [PubMed] [Google Scholar]
- 24.McClintock B. The stability of broken ends of chromosomes in Zea mays. Genetics. 1941;26:234–282. doi: 10.1093/genetics/26.2.234. [DOI] [PMC free article] [PubMed] [Google Scholar]
- 25.Ballif B.C., Yu W., Shaw C.A., Kashork C.D., Shaffer L.G. Monosomy 1p36 breakpoint junctions suggest pre-meiotic breakage-fusion-bridge cycles are involved in generating terminal deletions. Hum. Mol. Genet. 2003;12:2153–2165. doi: 10.1093/hmg/ddg231. [DOI] [PubMed] [Google Scholar]
- 26.Hastings P.J., Slack A., Petrosino J.F., Rosenberg S.M. Adaptive amplification and point mutation are independent mechanisms: Evidence for various stress-inducible mutation mechanisms. PLoS Biol. 2004;2:e399. doi: 10.1371/journal.pbio.0020399. [DOI] [PMC free article] [PubMed] [Google Scholar]
- 27.Burma S., Chen B.P., Chen D.J. Role of non-homologous end joining (NHEJ) in maintaining genomic integrity. DNA Repair (Amst.) 2006;5:1042–1048. doi: 10.1016/j.dnarep.2006.05.026. [DOI] [PubMed] [Google Scholar]
- 28.Inoue K., Khajavi M., Ohyama T., Hirabayashi S., Wilson J., Reggin J.D., Mancias P., Butler I.J., Wilkinson M.F., Wegner M. Molecular mechanism for distinct neurological phenotypes conveyed by allelic truncating mutations. Nat. Genet. 2004;36:361–369. doi: 10.1038/ng1322. [DOI] [PubMed] [Google Scholar]
- 29.Bzymek M., Lovett S.T. Instability of repetitive DNA sequences: the role of replication in multiple mechanisms. Proc. Natl. Acad. Sci. USA. 2001;98:8319–8325. doi: 10.1073/pnas.111008398. [DOI] [PMC free article] [PubMed] [Google Scholar]
- 30.Young M., Cullum J. A plausible mechanism for large-scale chromosomal DNA amplification in streptomycetes. FEBS Lett. 1987;212:10–14. doi: 10.1016/0014-5793(87)81547-8. [DOI] [PubMed] [Google Scholar]
- 31.Petit M.A., Mesas J.M., Noirot P., Morel-Deville F., Ehrlich S.D. Induction of DNA amplification in the Bacillus subtilis chromosome. EMBO J. 1992;11:1317–1326. doi: 10.1002/j.1460-2075.1992.tb05176.x. [DOI] [PMC free article] [PubMed] [Google Scholar]
- 32.Romero D., Palacios R. Gene amplification and genomic plasticity in prokaryotes. Annu. Rev. Genet. 1997;31:91–111. doi: 10.1146/annurev.genet.31.1.91. [DOI] [PubMed] [Google Scholar]