

Abstract
Autism is a genetically complex neurodevelopmental syndrome in which language deficits are a core feature. We describe results from two complimentary approaches used to identify risk variants on chromosome 7 that likely contribute to the etiology of autism. A two-stage association study tested 2758 SNPs across a 10 Mb 7q35 language-related autism QTL in AGRE (Autism Genetic Resource Exchange) trios1,2 and found significant association with Contactin Associated Protein-Like 2 (CNTNAP2), a strong a priori candidate. Male-only containing families were identified as primarily responsible for this association signal, consistent with the strong male affection bias in ASD and other language-based disorders. Gene-expression analyses in developing human brain further identified CNTNAP2 as enriched in circuits important for language development. Together, these results provide convergent evidence for involvement of CNTNAP2, a Neurexin family member, in autism, and demonstrate a connection between genetic risk for autism and specific brain structures.
Introduction
Autism (MIM 209850) is a common and heterogeneous neurodevelopmental disorder, characterized by language impairments, social and communicative deficits, and repetitive behaviors.3 Although heritability estimates for autism spectrum disorder (ASD) range between 70% and 90%,4 the variable phenotype and complex genetic architecture has challenged efforts to identify ASD-susceptibility genes. Thus far, regions on chromosomes 7q and 17q have the strongest statistical support for an involvement in the etiology of ASD from independent studies, but risk alleles within these regions remain to be unambiguously identified.1,5–10 Recent studies have also demonstrated a role of submicroscopic deletions and duplications in ASD etiology, which appears to have a greater importance in simplex than multiplex autism.11,12
We have undertaken a comprehensive approach to identify specific genes contributing both to the qualitative diagnosis of ASD as well as quantitative components of the phenotype.1,2,13 Language problems are one of the essential features of autism,14 and substantial language delay, defined as a lag in the age of the first spoken word or the first spoken phrase, is seen in approximately half of children with autism and is observed in their unaffected siblings at increased rates.15 In the only quantitative linkage scan for a language endophenotype in autism, we identified a quantitative trait locus (QTL) related to language delay (“age at first word;” WORD) across a 10 cM region at 7q35.1 Fine mapping of this region in 291 families showed evidence of suggestive linkage to the qualitative diagnosis of autism16 and provided support for the 7q35 language QTL,2 but also revealed substantial genetic heterogeneity.2
Here we present results from a high-density SNP-based study of the 15 Mb 7q34–36 region encompassing the 10 Mb 7q35 QTL.1,2 Polymorphisms across this interval, at an average intermarker distance of 5.6 Kb, were tested for association to age at first word. In Stage 1, 172 parent-child trios from the AGRE resource were genotyped on 2758 SNPs across the 15 Mb region containing approximately 200 known genes.17,18 These analyses identified four genes for follow up (Figure 1), including Contactin Associated Protein-like 2 (CNTNAP2), a member of the Neurexin family.19 Two separate lines of evidence made CNTNAP2 a strong a priori candidate within this region. First, neurexins are known to interact functionally with genes previously identified as mutated in ASD.20,21 Second, mutations in CNTNAP2 itself were recently identified in an Amish family with seizures, language regression, and pervasive developmental disorder.22 In Stage 2, we tested 304 independent parent-child trios for association to the four genes highlighted in Stage 1; these analyses confirmed association between age at first word and CNTNAP2.
Figure 1.
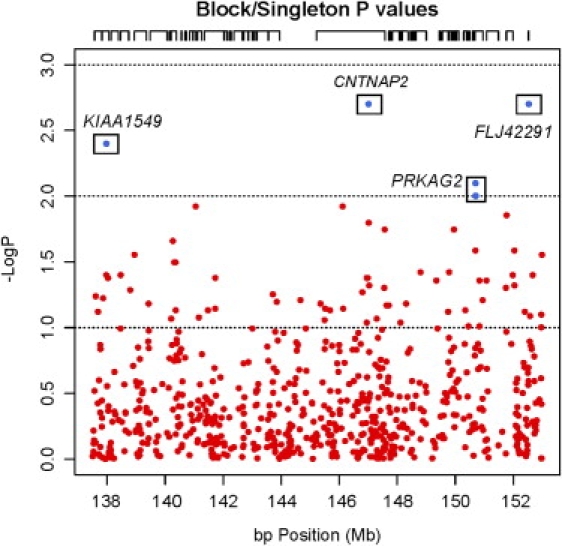
Dense SNP Analysis of the 7q35 Autism-Related Language QTL Region Highlights Four Variants for Stage 2 Follow-Up
The negative log of the significance level of each block or single-SNP transmission bias is plotted according to base-pair position. Nominally significant SNPs (p < 0.01, pLOD > 2) that were followed up in Stage 2 are boxed. Tics above the graph demarcate gene content.
In independent but complementary work, we isolated CNTNAP2 in whole-transcriptome microarray experiments designed to characterize gene expression in language-related brain structures in the developing human cortex. Subsequent in situ hybridizations in separate human fetal brains determined that a CNTNAP2 transcript was strikingly restricted to developing frontotemporal-subcortical circuits known to be critical for human executive function. More specifically, this circuitry is thought to subserve joint attention, an essential precursor to verbal communication that is disrupted in ASD.23–25 Together, these data provide strong statistical evidence for the involvement of common variation within CNTNAP2 in language acquisition in autism and provide a framework to link this variation to the patterning of neural circuits required for verbal communication in human.
Subjects and Methods
Study Sample
Families analyzed in this study were selected from the AGRE resource.26 AGRE has human subjects' approval and our use of the AGRE repository was further approved by UCLA. The recruitment and diagnostic protocol has been described previously,1,9,16,26 and additional information is available on the AGRE website. Families were excluded from the current study if a nonidiopathic autism label (i.e., fragile-X, abnormal brain-imaging results, abnormal karyotype) was recorded in a proband.26 The majority (79%) of the samples are self-identified as white, while 7% identified themselves as being of a different race (i.e., black, Asian, Pacific Islander, etc.) or of mixed ancestry.
Assessment
The Autism Diagnostic Interview (Revised) (ADI-R)27 is a semistructured interview, based on the ICD-10 and DSM-IV criteria for autism diagnosis, given to the caregivers of individuals that may be affected.27 For all subjects, a trained tester administered the ADI-R in the family home per standard protocols.16,27 For the association analysis, we analyzed a quantitative trait from the ADIR-R: the age at which the subjects spoke their first word (WORD). The trait is familial and was used to identify the previously reported QTL region on chromosome 7q35.1 Although WORD is an amnestic language measure, it is significantly negatively correlated with the Peabody Picture Vocabulary Test Scores in this sample, which is a contemporary measure of receptive language.2
For Stage 1, data from 172 trios had the quantitative trait age at first word (WORD1,2) and were included in the quantitative association analysis. For Stage 2, an independent set of 304 parent-child AGRE trios with the WORD phenotype were included in the quantitative association analysis. In a typically developing child, the first word occurs before 12 months of age. In the Stage 1 sample, the average age at first word in the offspring was 30.49 months (n = 172; range = 6 to 85 months). Although male offspring had an average WORD (mean = 31.07; n = 146; range = 6 to 85 months) that was slightly higher than that for female offspring (mean = 27.23; n = 26; range = 8 to 60), this was not significantly different (p > 0.3). In Stage 2, the average WORD was 32.66 months (n = 304, range = 5 to 108 months). As in Stage 1, males (mean = 33.3, n = 243, range = 5 to 108 months) and females (mean = 30.15, n = 61; range = 7 to 84 months) were not significantly different (p = 0.26) for WORD. The ratio of males to females in this sample was 4.74 for Stage 1 and 3.98 for Stage 2, consistent with other reports of an increased prevalence of the disorder in boys.5,10,28
Genotyping
For Stage 1, DNA samples obtained from cell lines housed at the NIMH Cell Repository (Piscataway, NJ) were genotyped by Perlegen (Mountain View, CA). For Stage 2, samples were genotyped either at the Southern California Genotyping Center (SCGC), an on-site installation of the Illumina platform at UCLA (Illumina, Inc., San Diego, CA29), or by Taqman assay completed in one of our laboratories (D.H.G.) and scanned on an ABI7900 fluorescent plate reader (Applied Biosystems, Foster City, CA). Details of the Illumina genotyping platform have been discussed in detail elsewhere.30–32
For Stage 1, based on information from samples previously genotyped by Perlegen Sciences, 6242 SNPs with a call rate greater than 80% and a minor allele frequency (MAF) greater than 10% were identified across the linkage region. An adaptation of the Lee-Kang algorithm33 was then used to identify a subset of 2892 SNPs that would cover the region with an average density of 1 SNP every 5.3 kb. From this, a total of 2758 SNPs across an estimated 200 genes were successfully genotyped for Stage 1 at Perlegen Sciences by hybridization onto custom-designed Affymetrix SNP arrays by methods similar to those described elsewhere17 (see Table S1 available online for marker details and descriptive statistics). All mapping and distance information is based on the National Center for Biotechnology Institute Build 35 of the human genome. The average heterozygosity of markers used in this study was 35%, the minor allele frequency (MAF) was 27%, and the average call rate was 95%. The average number of Mendelian errors over the whole sample was 0.002 (total number of errors/possible errors). Individual markers were combined into 403 haplotype blocks based on the four-gamete method34 (see below).
For Stage 2, blocks (n = 3, covered by a total of six tagging SNPs) and unlinked SNPs (n = 2) identified in Stage 1 were genotyped in 304 separate families. These eight SNPs within four genes, KIAA1549, CNTNAP2, FLJ42291, and PRKAG2, were submitted to Illumina for evaluation. SNPs with poor designability scores (e.g., rs6965505 from FLJ42291) or missing calls were genotyped in one of our laboratories (D.H.G.). As shown in Figure 2, the four SNPs in CNTNAP2 block 254 identified in Stage 1 were in high LD (r2 values for rs2710102 (tag), rs759178, rs1922892, and rs2538991 ranged from .98 to 1); therefore, only rs2710102 was typed in Stage 2.
Figure 2.
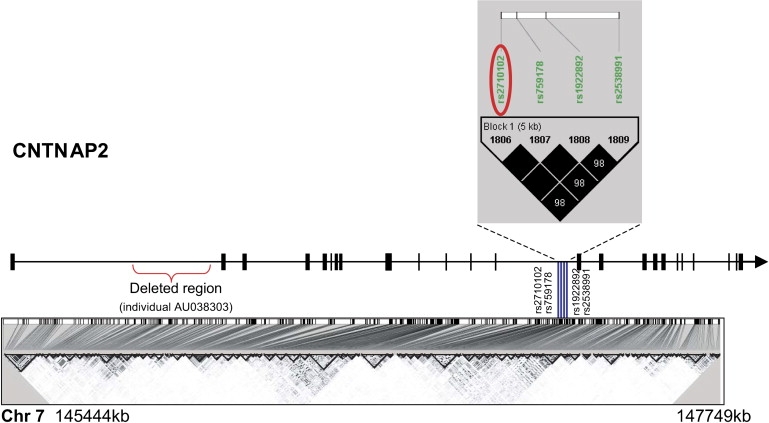
Relative Location of Associated SNPs within CNTNAP2
Gene structure is depicted from 5′ to 3′ with exons represented by small blocks or lines along the gene, and the black arrowhead indicates gene direction. The SNPs that comprised the nominally significant (p < 0.01) block 254 from Stage 1 are represented by blue vertical lines over the bottom LD plot. The tag SNP, rs2710102, confirmed in the male-only trios (n = 187) in Stage 2 is circled in red. The LD plot was generated with the Haploview program.
QTL Region Coverage and Comparison to HapMap
The study presented herein was designed prior to the availability of HapMap2.35 Although the HapMap does not provide complete information, particularly with respect to rare alleles, it is the most comprehensive catalog of human variation available over the genome and provides a clear standard by which to gauge coverage of known variation over an interval of interest. Genotype data from CEPH families were downloaded from the HapMap Project, release #21, between 137480543 and 152996597 base pairs on chromosome 7. Haploview (version 4.0RC1)36 was used to calculate minor allele frequency (MAF), heterozygosity, and pair-wise LD for SNPs separated by ≤100 kb. SNPs with MAF < 0.05 were removed from analysis of HapMap data.
With those SNPs that were common to both our generated data and those genotyped by the HapMap Project (n = 1724) as tags, 62% of SNPs in HapMap (total number of HapMap SNPs in region = 11405) were covered by proxy at an average r2 = 0.8. Thus, the majority of variation captured by HapMap was assessed by proxy in the current study. Because there were an additional 386 SNPs included in our generated data but not present in HapMap, this is likely an underestimate of the actual variation captured across the interval.
Statistical Analysis
Haploview36 was used to identify Mendelian errors, estimate allele frequencies, test for Hardy-Weinberg equilibrium, estimate linkage disequilibrium (LD) parameters, and identify haplotype blocks with their respective tags (described below). From the 2758 original markers typed, we excluded 648 SNPs that did not meet at least one of the following criteria: Hardy-Weinberg cutoff of 0.05, 90% minimum genotype, maximum of 10 Mendelian errors, and a MAF of 5%. Quality-control parameters for the 2758 SNPs are reported in Table S1. LD was characterized by calculation of the squared correlation coefficient,37 r2, a conventional measure of association equal to the square of the correlation coefficient between the alleles at two loci.38,39 This measure allows the prediction of alleles at one SNP from the alleles at a second SNP.40 Although markers were not removed from analysis in Stage 1 because of high LD, it was considered in the selection of haplotype-block tags, described below, which was performed with the Tagger option in Haploview.
To provide sufficient power to detect variants associated with only modest effects, we used a standard two-stage design.41,42 Our haplotype-block strategy with independent samples limited the number of tests conducted by grouping related SNPs and testing the set for association. In Stage 1, we defined blocks in Haploview by using the “four-gamete rule” option.34 This approach for haplotype block construction does not require subjective thresholds of linkage disequilibrium measures or a minimum number of common haplotypes in a region; rather, recombination events are identified and blocks are defined as a set of nonrecombinant continuous SNPs.34 More specifically, in Haploview, the haplotypes (i.e., gametes) and population frequencies for each pair of markers are computed and a recombination event is considered to have taken place when all four possible haplotypes have frequencies of at least 0.01. Blocks are defined by contiguous markers where only three gametes exist. With this approach, 403 blocks composed of 1863 SNPs were obtained. An additional 257 SNPs were not included in these blocks and were tested individually. The Tagger function in Haploview was used to select tags for each of the 403 blocks, with an r2 threshold of .85; thus, each selected tag had a correlation of at least .85 with the SNPs it represented. All of the tags covering the 403 blocks, as well as the 257 independent SNPs not included in them, were subjected to a quantitative regression-based association test with the Whole Haplotype Analysis Package (WHAP) Software. WHAP uses a regression analysis method for testing SNP associations with either qualitative or quantitative traits in samples of unrelated individuals and/or parent-offspring trios. We applied a conditional model where the genotype is conditioned on the quantitative trait and the mean and variance of the trait were fixed (10.32 and 6.05, respectively, estimated from 214 unaffected children with typical language development). Evidence for association with WORD was assessed by generating empiric p values by permuting the genotypes within the trios 500 times in Stage 1 and 100,000 times in Stage 2.
Considering the possibility that heterogeneity at this language-related QTL region could be due to proband sex, we divided the Stage 2 sample into male-only and female-containing families (as described previously43) and tested these subgroups for association with WORD.
Representational Oligonucleotide Microarray Analysis
Recently, de novo microdeletions or duplications have been implicated in ASD etiology;11,12 therefore, we examined this trend in our sample at our specific language locus by using representational oligonucleotide microarray analysis (ROMA).
ROMA was performed in 184 AGRE probands (including 38 probands from the association analysis) with genomic representations made with BglII as described previously,44 hybridized onto 85K arrays, which represent the genome at a density of an oligonucleotide per average gene (every 50 kb on average45), followed by 390K arrays for validation (6–7 kb average spacing). Arrays were manufactured per our specifications, and hybridizations were performed in the NimbleGen Iceland facility, LindGen EHF.
Validation of findings from 85K ROMA scan was done with a higher complexity representation called a “rubble-rep” and a 390K probe array (with an average spacing of one probe every 8 kb in the genome). A rubble-rep is performed by cleaving the genome with Dpn II and ligating the adaptors, then further depleting the Dpn II representation by cleavage with Alu I, followed by amplification.
Microarray Gene-Expression Analysis
Human brain material was obtained from the University of Maryland Brain and Tissue Bank under an approved UCLA IRB protocol. RNA was extracted from left or right frontal lobes, superior temporal gyrus, or the remaining whole hemisphere (minus STG) from eight human fetal brains, gestational age 17–22 weeks (two female, five male, one unknown). RNA quality was assessed via spectrophotometry with the nanodrop spectrophotometer (A260/280 > 1.8) and Agilent Bio-Analyzer (28 s:18 s > 2). Labeling, hybridization, and scanning were then carried out as per manufacturer's instructions. Single-channel Affymetrix expression values were calculated and arrays normalized with the RMA package in R.46 dChip47 was then used to identify genes that showed fold-change > 1.3, absolute difference between means > 100, and p < 0.01. For two-color Agilent arrays, differential expression (DE) was said to occur when genes showed at least a 1.5× difference between groups, had an average signal 2× background, and p < 0.01 after correction for multiple comparisons with the software package Limma.48
In Situ Hybridization
Additional human brains obtained as above from the University of Maryland Brain and Tissue Bank under an approved UCLA IRB protocol were used for in situ hybridizations. Experiments were performed with CNTNAP2 gene-specific probes applying previously published methods.49 All hybridizations were performed on sections from multiple additional brains (five female, one unknown) with two distinct CNTNAP2-specific riboprobes, one consisting of a large 4 kb fragment spanning 5′UTR, coding region, and 3′UTR (bps 550–4300 of NM_014141; pBSA2) and a second 600 bp probe corresponding to the 3′ end of the protein-coding region (bps 3550–4100 of NM_014141; pBSA13). Results with each of the two probes were indistinguishable. Sense control showed no signal (data not shown).
Results
Stage 1: Association Analysis of the 7q35 Region
In Stage 1, 2758 single-nucleotide polymorphisms with an average intermarker distance of 5.6 kb were genotyped in 172 parent/child trios from the Autism Genetic Resource Exchange (AGRE). Quantitative single- or multimarker family-based association analyses were performed with the age at first word (WORD) trait, which is familial and used previously to identify the 7q35 language QTL region in multiplex autism families.1
To avoid premature exclusion of genes in the first comprehensive assessment of this region, we took a liberal approach in the initial screen and used a significance threshold of p < 0.01 to select blocks and independent SNPs for Stage 2 follow-up (refer to Figure 1). Four Stage 1 genes, KIAA1549, CNTNAP2, PRKAG2, and FLJ42291, were tested in Stage 2.
Stage 2: Independent Sample Analysis Implicates CNTNAP2
The first stage association analysis of 172 trios narrowed the number of genes for the second stage investigation from approximately 200 to 4: KIAA1549, CNTNAP2, PRKAG2, and FLJ42291, each of which was represented by blocks and/or independent SNPs. Several independent lines of evidence made CNTNAP2, a Neurexin family member, a strong a priori candidate. First, mutations in Neuroligin genes, known to interact with β-Neurexins, have been identified in ASD.20,21 Second, the disruption of CNTNAP2 in a family segregating severe intellectual disability and repetitive behaviors has been reported.50 Third and most recently, mutations in CNTNAP2 itself segregate with a recessive seizure disorder associated with ASD and language delay.22 Of the variants characterized in Stage 2, only that within CNTNAP2 (block 254, tagged by rs2710102; Figure 2) showed any relationship to WORD (p = 0.028; Table 1).
Table 1.
Association Results for a Block-Based Analysis of the 7q35–36 Language QTL Region
| Gene | Block # | SNP Tags | Position | Stage 1 pa,b | Stage 2 pa,c |
||
|---|---|---|---|---|---|---|---|
| all | mo | fc | |||||
| KIAA1549 | 9 | rs896193 | 137975311 | 0.004 | 0.12 | 0.29 | 0.34 |
| 9 | rs10435435 | 137977766 | |||||
| 9 | rs6467813 | 137989463 | |||||
| CNTNAP2 | 254 | rs2710102 | 146966131 | 0.002 | 0.028 | 0.005d | 0.87 |
| PRKAG2 | 355 | rs2302532 | 150699953 | 0.008 | 0.17 | 0.033 | 0.66 |
| 355 | rs7788234 | 150706305 | |||||
| PRKAG2 | rs17173197 | 150706568 | 0.01 | 0.51 | 0.25 | 0.56 | |
| FLJ42291 | rs6965505 | 152537834 | 0.002 | 0.77 | 0.30 | 0.42 | |
Blocks and independent SNPs were identified in Stage 1 (p < 0.01) and tested in an independent sample in Stage 2 by age at first word.
p values for blocks were obtained by running the corresponding tags as a group in Whap. p values for independent SNPs (rs17173197, rs6965505) were obtained by running each marker individually. Only results with p values less than 0.01 in Stage 1 (shown here) were tested in Stage 2.
Empirical p values for Stage 1 were obtained in Whap with 500 permutations. Stage 1 included 172 trios.
Empirical p values for Stage 2 were obtained in Whap with 100,000 permutations. Stage 2 included 304 trios: 187 male-only trios and 117 female-containing trios.
The significance of stratifying the sample by sex was estimated empirically by choosing 500 sets of 187 families at random; the association analysis was then performed on each of these sets. The empirical p value for the male-specific effect was <0.02.
Because of the overrepresentation of males in samples with ASD and those with language delay,51 as well as evidence for sex-specific effects on 7q,52 we hypothesized that stratifying by sex may reduce genetic heterogeneity at this locus. The association between rs2710102 and WORD appeared to be driven by the male-only trios (p = 0.005; Table 1). However, to provide an empirical estimate of significance for the sex stratification, we followed the previously described procedure to assess empiric significance by permutation43 and randomly selected samples of 187 trios from the Stage 2 data set and ran the association analysis; we repeated this procedure 500 times. Only 11 of the total 500 trials had a significance value less than 0.005 (from Table 1); thus, the empiric p value for the male-only association was <0.02. These results demonstrated that sex was an important factor in the association between CNTNAP2 and WORD.
Microdeletion Identified by ROMA
By using ROMA, we identified a microdeletion within CNTNAP2 shown in Figure 3. This variant was present in a proband and his father, but not in the proband's affected sibling or in 1000 control chromosomes screened separately.
Figure 3.
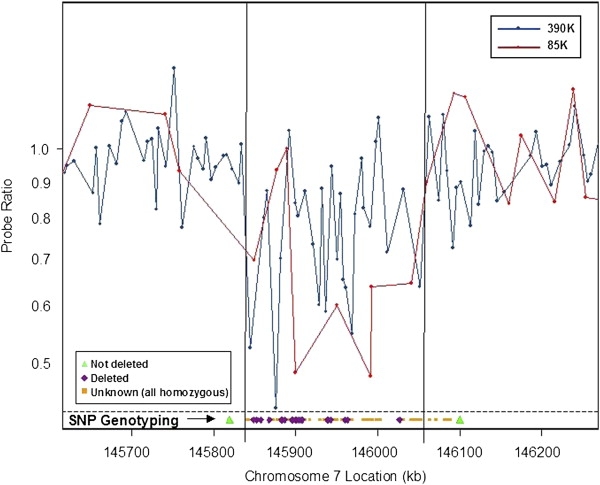
Representational Oligonucleotide Microarray Analysis and Assessment of Mendelian Errors in SNPs Identify a Rare CNTNAP2 Deletion
The two vertical lines in the graph show the endpoints of the deletion estimated from ROMA data by a Hidden Markov Model-based predictor. SNP genotyping data are superimposed on the graph at the bottom. The two green triangles represent SNPs that were informative and showed no Mendelian errors, indicating that the deleted region is somewhere between these two points. Purple diamonds denote SNPs that showed Mendelian errors consistent with a deletion. Orange squares represent SNPs that were uninformative. Chromosome 7 locations are from the UCSC Genome Browser May 2004 assembly.
CNTNAP2 Expression during Fetal Brain Development
In an independent line of investigation, we performed genome-wide microarray studies of regional gene expression in eight human fetal brains to identify genes enriched in human language-related association cortex.53 Standard genome-wide false discovery thresholds in each of two separate microarray platforms identified a common set of 12 genes differentially expressed between superior temporal gyrus and the remaining cerebral hemisphere (hypergeometric probability of overlap; p < 3.3 × 10⁻¹³). One of these differentially expressed genes was CNTNAP2 (Table 2).
Table 2.
Microarray Expression for CNTNAP2 in Superior Temporal Gyrus versus the Rest of the Cerebral Hemisphere
| Probe | Platform | STG Mean | HEM Mean | Fold Change | Difference of Means | t | p |
|---|---|---|---|---|---|---|---|
| A_23_P84399 | Agilent | 2727.50 | 6457.50 | −2.37 | 3730 | −12.80 | .003 |
| 219301_s_at | Affymetrix | 140.30 | 242.84 | −1.73 | 103 | −4.53 | .0005 |
STG, superior temporal gyrus; HEM, cerebral hemisphere.
CNTNAP2 expression was further investigated by in situ hybridization to provide independent confirmation of the array data in additional brains and also give a detailed assessment of regional distribution. These experiments revealed that CNTNAP2 was highly restricted to frontal and anterior temporal lobes, striatum, and dorsal thalamus (Figure 4). This unusually restricted pattern of expression for CNTNAP2 recapitulates the well-established cortico-striato-thalamic circuitry known to modulate human cognitive function. These results are striking given that these heavily interconnected structures are known to contribute to complex human behaviors including speech and language,54 reward, frontal executive function,55 as well as joint attention, a core deficit in ASD.56,57
Figure 4.
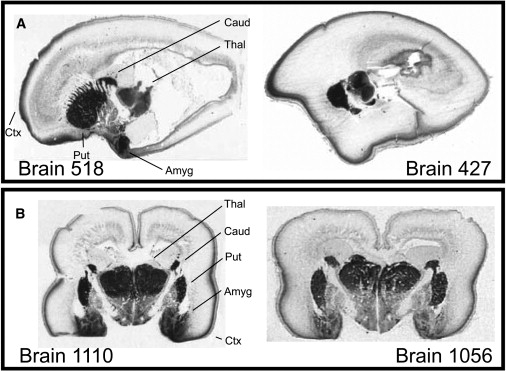
CNTNAP2 Expression in Human Fetal Brain Demarcates Anterior Frontal and Temporal Perisylvian Regions, Striatum, and Thalamus
(A) Autoradiograms of midline sagittal sections obtained from an 18-week and a 20-week fetal brain show striking enrichment of CNTNAP2 in frontal gray matter, corresponding roughly to a region between the orbital gyrus and superior frontal cortical anlagen. Strong labeling is also observed in basal ganglia, thalamus, and amygdala.
(B) Autoradiograms of coronal sections from two 19-week fetal brains demonstrate high levels of CNTNAP2 in amygdala, caudate, cortical plate, dorsal thalamus, and putamen. Abbreviations: Amyg, amygdala; Caud, caudate; Ctx, cortex; Put, putamen; and Thal, thalamus.
Discussion
This study provides evidence in support of common genetic variation in CNTNAP2 modulating language onset in males and underlying ASD susceptibility. Our two-stage analysis identified an association between variation at rs2710102 and age at first word in ASD samples from male-only families. These SNP association results do not imply that variation at rs2710102 is causally related to ASD but rather that variation here is likely to be in linkage disequilibrium with an as yet untested, functional variant. Identifying the underlying causal variant(s) in CNTNAP2 will be highly informative although this is also likely to be complicated given the absence of nearby polymorphisms within the coding region and the size of the genic region.
It is of particular interest that the association between rs2710102 and age at first word appeared to be most pronounced among affected males. Despite the absence of significant differences in WORD between affected males and females,1,2 the increased prevalence of ASD in males compared to females5,10,28 along with the preponderance of males in language-delayed samples,51 made it reasonable to expect that the underlying genetic modulators for ASD may differ as a function of sex. In support of this notion, results from an independent qualitative linkage study show that a separate linkage peak on chromosome 7q was largely due to male-male affected sibpairs.43,52
The association between rs2710102 in CNTNAP2 with age at first word, coupled with its well-defined developmental expression, are especially interesting in light of two independent lines of supporting evidence. The first is the recent identification of a rare recessive mutation in CNTNAP2 that segregates with seizures, developmental language delay, and autism in an extended Amish kindred.22 All patients had seizures with onset between 14 and 20 months of age, and these were followed by the abrupt decline of learning ability and social skills, as well as language regression and aberrant social behavior, and nearly 2/3 were diagnosed with PDD-NOS, an autism spectrum condition. It is notable that pathological examination of resected tissue from several of the reported Amish cases revealed widespread abnormalities of neuronal migration including the anterior temporal lobe and amygdala, whereas imaging data revealed abnormalities in the frontal and temporal lobes, as well as basal ganglia. Seizure foci were most pronounced in the anterior temporal and frontal lobes, a pattern that is explained by the focal expression pattern of CNTNAP2 during fetal brain development shown here. It is well established that a significant proportion of patients with autism suffer from seizures,58 typically arising well after the age of first diagnosis. These observations suggest that the common CNTNAP2 risk allele identified here contributes to ASD and related conditions, concomitantly increasing the risk for language delay, most likely as a consequence of the disruption of a critical neurodevelopment process, such as neuronal migration, and may cause cortical dysplasia that carries the potential for wide-ranging phenotypic effects, including seizures, regression, and ASD.
The second alternative line of supporting evidence for the involvement of CNTNAP2 in ASD etiology consists of the findings described in two separate studies appearing in this issue of AJHG.59,60 Arking and colleagues performed linkage and association whole-genome scans by using the qualitative diagnosis of autism in a total of 72 multiplex families from the AGRE cohort; 34 and 36 of which were in Stages 1 and 2, respectively, of the present study. With a stringent qualitative diagnosis of autism, a genome-wide significant linkage signal was detected in the 7q35 region; subsequently, they identified and confirmed an associated variant at the 5′ end of CNTNAP2.59 Although our previous linkage reports1,2 as well as the work by Arking et al. support the potential involvement of multiple genes in the 7q35 region, it remains striking that, in the end, the most important findings from the two independent laboratories converged on common variants from only one gene. Interestingly, Bakkaloglu and colleagues provide support for the involvement of rare CNTNAP2 variants with ASD.60 Based on the identification of a chromosomal break that disrupted CNTNAP2 in a patient with autistic disorder, the authors sequenced a large cohort of patients (10 of which were included in the present report) and controls; they found several likely functional rare variants in patients with autism that were not present in controls. Although there is a modest sample overlap among these three studies (described in detail59 and see Figure S1), the results remained consistent when these families were excluded (data not shown). Thus, together, these original studies provide evidence that both rare and common variants in CNTNAP2 may contribute to the development of ASD and its behavioral endophenotypes. In the future as more data are gathered, it will be important to relate specific forms of variation, rare and common, to specific aspects of the phenotype in patients, ranging from language and social function to brain structure and epilepsy.
Because it is increasingly apparent that de novo microdeletions or duplications can be important in ASD etiology,11,12 we examined this phenomenon in our sample at our specific language locus. By using ROMA, we identified a microdeletion within CNTNAP2 (Figure 3). This variant was present in a proband and his father, but not in 1000 control chromosomes screened separately. Although this large intronic deletion was not observed in the other autistic sibling of the index family (AU0383), it is reasonable that regulatory elements within the deleted region may impact gene function. In a recent 10K SNP genome scan, similar transmissions were observed for large deletions in other regions highly likely to be critical.61 Thus, the lack of segregation of this deleted variant with ASD suggested that this observation may either be spurious or contribute to ASD via complex mechanisms. More broadly, these data support the notion that large CNVs at the CNTNAP2 locus are not a common cause of autism or a major contributor to the language QTL studied here. As is currently the case for most complex genetic diseases, the field is in the early phases of study, and thus the overall allelic architecture of ASD remains to be determined: specifically, how much of its overall genetic risk will be explained by common versus rare variants.
The broad chromosome 7q2–35 region is the only region linked to ASD at genome-wide significance in a meta-analysis of ASD genome scans, and it has reached nominal significance levels in nearly all of the individual genome scans performed to date.62,63 Given the extensive heterogeneity of genetically complex diseases such as ASD, it is reasonable to assume that the identification of relatively strong and reproducible linkage peaks may reflect the presence of multiple susceptibility genes within that region.64 It is important to note that other studies have provided evidence for linkage to the qualitative phenotype of ASD at more proximal regions on chromosome 7q2–34. These and other data, together with our own report, support the possibility that additional ASD-susceptibility genes may lie on chromosome 7q and in other regions, such as chromosome 3q with evidence for linkage to language delay in ASD.2,52
Here we present evidence for the contribution of variation within CNTNAP2 to variability in age at first word in males. Moreover, our demonstration of the developmental expression of CNTNAP2 being confined to brain circuitry known to be disrupted in ASD23,25 provides, to our knowledge for the first time, a link between genetic risk for language dysfunction in autism and specific brain regions known to underlie core processes impaired in this disorder.
Supplemental Data
One table and one figure can be found with this article online at http://www.ajhg.org/cgi/content/full/82/1/150/DC1/.
Supplemental Data
Excel file (838 kb).
Web Resources
The URLs for data presented herein are as follows:
Autism Genetic Research Exchange, http://agre.org/
Cure Autism Now, http://canfoundation.org/
Ensembl Genome Browser, http://www.ensembl.org/
Illumina, Inc., http://www.illumina.com/
International HapMap Project, http://www.hapmap.org/
Kanehisa Laboratories, http://www.kegg.org/
National Center for Biotechnology Information, http://www.ncbi.nih.gov/Genomes/
Online Mendelian Inheritance in Man (OMIM), http://www.ncbi.nlm.nih.gov/Omim
Perlegen Sciences, Inc., http://www.perlegen.com/
UCSC Genome Browser, http://www.genome.ucsc.edu/
Whole Haplotype Analysis Package, http://pngu.mgh.harvard.edu/purcell/whap/
Acknowledgments
We are grateful to the AGRE families who participated in this study and made the resource possible and to the AGRE Consortium (see below) for their oversight of the resource. We also thank Kelly Fraser and David Cox of Perlegen Sciences for their help with Stage 1 genotyping and Kaela B. Chiu for helpful discussions. This project was supported by NIMH grant R01 MH64547 (to D.H.G.), R01 MH076431 (to J.S.), a NARSAD Young Investigator award (to M.A.), a MIND Institute Fellowship (to J.A.D.), an NRSA from NINDS (to J.A.D.), a Tourette Syndrome Association Fellowship (to B.S.A.), the UCLA Center for Autism Research and Treatment (NIMH, to D.H.G.), the Cure Autism Now foundation (to AGRE, D.H.G., and J.S.), The Simons Foundation (to J.S.), and cofunding from the National Alliance for Autism Research and the Southwestern Autism Research and Resource Center (to J.S.). The authors declare that they have no competing financial interests.
AGRE Consortium Scientific Steering Committee: D.H.G., M.D., Ph.D. (UCLA, Los Angeles, CA); Maja Bucan, Ph.D. (University of Pennsylvania, Philadelphia, PA); W. Ted Brown, M.D., Ph.D., F.A.C.M.G. (N.Y.S. Institute for Basic Research in Developmental Disabilities, Staten Island, NY); R.M.C., Ph.D. (UCLA School of Medicine, Los Angeles, CA); John N. Constantino, M.D. (Washington University School of Medicine, St. Louis, MO); T. Conrad Gilliam, Ph.D. (University of Chicago, Chicago, IL); Martha Herbert, M.D., Ph.D. (Harvard Medical School, Boston, MA); Clara Lajonchere, Ph.D. (Cure Autism Now, Los Angeles, CA); D.H.L., Ph.D. (Emory University, Atlanta, GA); C.L.M., Ph.D. (Emory University, Atlanta, GA); Janet Miller, J.D., Ph.D. (Cure Autism Now, Los Angeles, CA); S.F.N., M.D. (UCLA School of Medicine, Los Angeles, CA); Gerard D. Schellenberg, Ph.D. (University of Washington, Seattle, WA); Carol A. Samango-Sprouse, Ed.D. (George Washington University, Washington, DC); Sarah Spence, M.D., Ph.D. (UCLA, Los Angeles, CA); Rudolph E. Tanzi, Ph.D. (Massachusetts General Hospital, Boston, MA).
References
- 1.Alarcón M., Cantor R.M., Liu J., Gilliam T.C., Geschwind D.H., AGRE Consortium Evidence for a language quantitative trait locus on chromosome 7q in multiplex autism families. Am. J. Hum. Genet. 2002;70:60–71. doi: 10.1086/338241. [DOI] [PMC free article] [PubMed] [Google Scholar]
- 2.Alarcón M., Yonan A.L., Gilliam T.C., Cantor R.M., Geschwind D.H. Quantitative genome scan and ordered-subsets analysis of autism endophenotypes support language QTLs. Mol. Psychiatry. 2005;10:747–757. doi: 10.1038/sj.mp.4001666. [DOI] [PubMed] [Google Scholar]
- 3.Fombonne E. Epidemiology of autistic disorder and other pervasive developmental disorders. J. Clin. Psychiatry. 2005;66(Suppl 10):3–8. [PubMed] [Google Scholar]
- 4.Folstein S.E., Rosen-Sheidley B. Genetics of autism: complex aetiology for a heterogeneous disorder. Nat. Rev. Genet. 2001;2:943–955. doi: 10.1038/35103559. [DOI] [PubMed] [Google Scholar]
- 5.IMGSAC (International Molecular Genetic Study of Autism Consortium) A full genome screen for autism with evidence for linkage to a region on chromosome 7q. Hum. Mol. Genet. 1998;7:571–578. doi: 10.1093/hmg/7.3.571. [DOI] [PubMed] [Google Scholar]
- 6.CLSA Incorporating language phenotypes strengthens evidence of linkage to autism. Am. J. Med. Genet. 2001;105:539–547. [PubMed] [Google Scholar]
- 7.IMGSAC A genomewide screen for autism: strong evidence for linkage to chromosomes 2q, 7q, and 16p. Am. J. Hum. Genet. 2001;69:570–581. doi: 10.1086/323264. [DOI] [PMC free article] [PubMed] [Google Scholar]
- 8.Ashley-Koch A., Wolpert C.M., Menold M.M., Zaeem L., Basu S., Donnelly S.L., Ravan S.A., Powell C.M., Qumsiyeh M.B., Aylsworth A.S. Genetic studies of autistic disorder and chromosome 7. Genomics. 1999;61:227–236. doi: 10.1006/geno.1999.5968. [DOI] [PubMed] [Google Scholar]
- 9.Cantor R.M., Kono N., Duvall J.A., Alvarez-Retuerto A., Stone J.L., Alarcón M., Nelson S.F., Geschwind D.H. Replication of autism linkage: fine-mapping peak at 17q21. Am. J. Hum. Genet. 2005;76:1050–1056. doi: 10.1086/430278. [DOI] [PMC free article] [PubMed] [Google Scholar]
- 10.Philippe A., Martinez M., Guilloud-Bataille M., Gillberg C., Rastam M., Sponheim E., Coleman M., Zapella M., Aschauer H., Van Maldergem L. Genome-wide scan for autism susceptibility genes. Paris Autism Research International Sibpair Study. Hum. Mol. Genet. 1999;8:805–812. doi: 10.1093/hmg/8.5.805. [DOI] [PubMed] [Google Scholar]
- 11.Jacquemont M., Sanlaville D., Redon R., Raoul O., Cormier-Daire V., Lyonnet S., Amiel J., Le Merrer M., Heron D., de Blois M.C. Array-based comparative genomic hybridisation identifies high frequency of cryptic chromosomal rearrangements in patients with syndromic autism spectrum disorders. J. Med. Genet. 2006;43:843–849. doi: 10.1136/jmg.2006.043166. [DOI] [PMC free article] [PubMed] [Google Scholar]
- 12.Sebat J., Lakshmi B., Malhotra D., Troge J., Lese-Martin C., Walsh T., Yamrom B., Yoon S., Krasnitz A., Kendall J. Strong association of de novo copy number mutations with autism. Science. 2007;316:445–449. doi: 10.1126/science.1138659. [DOI] [PMC free article] [PubMed] [Google Scholar]
- 13.Duvall J.A., Lu A., Cantor R.M., Todd R.D., Constantino J.N., Geschwind D.H. A quantitative trait locus analysis of social responsiveness in multiplex autism families. Am. J. Psychiatry. 2007;164:656–662. doi: 10.1176/ajp.2007.164.4.656. [DOI] [PubMed] [Google Scholar]
- 14.Dawson G., Webb S., Schellenberg G.D., Dager S., Friedman S., Aylward E., Richards T. Defining the broader phenotype of autism: genetic, brain, and behavioral perspectives. Dev. Psychopathol. 2002;14:581–611. doi: 10.1017/s0954579402003103. [DOI] [PubMed] [Google Scholar]
- 15.Piven J., Palmer P. Cognitive deficits in parents from multiple-incidence autism families. J. Child Psychol. Psychiatry. 1997;38:1011–1021. doi: 10.1111/j.1469-7610.1997.tb01618.x. [DOI] [PubMed] [Google Scholar]
- 16.Yonan A.L., Alarcón M., Cheng R., Magnusson P.K., Spence S.J., Palmer A.A., Grunn A., Juo S.H., Terwilliger J.D., Liu J. A genomewide screen of 345 families for autism-susceptibility loci. Am. J. Hum. Genet. 2003;73:886–897. doi: 10.1086/378778. [DOI] [PMC free article] [PubMed] [Google Scholar]
- 17.Patil N., Berno A.J., Hinds D.A., Barrett W.A., Doshi J.M., Hacker C.R., Kautzer C.R., Lee D.H., Marjoribanks C., McDonough D.P. Blocks of limited haplotype diversity revealed by high-resolution scanning of human chromosome 21. Science. 2001;294:1719–1723. doi: 10.1126/science.1065573. [DOI] [PubMed] [Google Scholar]
- 18.Hinds D.A., Stuve L.L., Nilsen G.B., Halperin E., Eskin E., Ballinger D.G., Frazer K.A., Cox D.R. Whole-genome patterns of common DNA variation in three human populations. Science. 2005;307:1072–1079. doi: 10.1126/science.1105436. [DOI] [PubMed] [Google Scholar]
- 19.Baumgartner S., Littleton J.T., Broadie K., Bhat M.A., Harbecke R., Lengyel J.A., Chiquet-Ehrismann R., Prokop A., Bellen H.J. A Drosophila neurexin is required for septate junction and blood-nerve barrier formation and function. Cell. 1996;87:1059–1068. doi: 10.1016/s0092-8674(00)81800-0. [DOI] [PubMed] [Google Scholar]
- 20.Comoletti D., De Jaco A., Jennings L.L., Flynn R.E., Gaietta G., Tsigelny I., Ellisman M.H., Taylor P. The arg451cys-neuroligin-3 mutation associated with autism reveals a defect in protein processing. J. Neurosci. 2004;24:4889–4893. doi: 10.1523/JNEUROSCI.0468-04.2004. [DOI] [PMC free article] [PubMed] [Google Scholar]
- 21.Jamain S., Quach H., Betancur C., Rastam M., Colineaux C., Gillberg I.C., Soderstrom H., Giros B., Leboyer M., Gillberg C. Mutations of the X-linked genes encoding neuroligins NLGN3 and NLGN4 are associated with autism. Nat. Genet. 2003;34:27–29. doi: 10.1038/ng1136. [DOI] [PMC free article] [PubMed] [Google Scholar]
- 22.Strauss K.A., Puffenberger E.G., Huentelman M.J., Gottlieb S., Dobrin S.E., Parod J.M., Stephan D.A., Morton D.H. Recessive symptomatic focal epilepsy and mutant contactin-associated protein-like 2. N. Engl. J. Med. 2006;354:1370–1377. doi: 10.1056/NEJMoa052773. [DOI] [PubMed] [Google Scholar]
- 23.Mundy P. Annotation: the neural basis of social impairments in autism: the role of the dorsal medial-frontal cortex and anterior cingulate system. J. Child Psychol. Psychiatry. 2003;44:793–809. doi: 10.1111/1469-7610.00165. [DOI] [PubMed] [Google Scholar]
- 24.Paterson S.J., Heim S., Thomas Friedman J., Choudhury N., Benasich A.A. Development of structure and function in the infant brain: implications for cognition, language and social behaviour. Neurosci. Biobehav. Rev. 2006;30:1087–1105. doi: 10.1016/j.neubiorev.2006.05.001. [DOI] [PMC free article] [PubMed] [Google Scholar]
- 25.Courchesne E., Pierce K. Why the frontal cortex in autism might be talking only to itself: local over-connectivity but long-distance disconnection. Curr. Opin. Neurobiol. 2005;15:225–230. doi: 10.1016/j.conb.2005.03.001. [DOI] [PubMed] [Google Scholar]
- 26.Geschwind D.H., Sowinski J., Lord C., Iversen P., Shestack J., Jones P., Ducat L., Spence S.J., AGRE Steering Committee The autism genetic resource exchange: a resource for the study of autism and related neuropsychiatric conditions. Am. J. Hum. Genet. 2001;69:463–466. doi: 10.1086/321292. [DOI] [PMC free article] [PubMed] [Google Scholar]
- 27.Lord C., Rutter M., Le Couteur A. Autism Diagnostic Interview—Revised: a revised version of a diagnostic interview for caregivers of individuals with possible pervasive developmental disorders. J. Autism Dev. Disord. 1994;24:659–685. doi: 10.1007/BF02172145. [DOI] [PubMed] [Google Scholar]
- 28.CLSA An autosomal genomic screen for autism. Am. J. Med. Genet. 1999;88:609–615. doi: 10.1002/(sici)1096-8628(19991215)88:6<609::aid-ajmg7>3.3.co;2-c. [DOI] [PubMed] [Google Scholar]
- 29.Shen R., Fan J.B., Campbell D., Chang W., Chen J., Doucet D., Yeakley J., Bibikova M., Wickham Garcia E., McBride C. High-throughput SNP genotyping on universal bead arrays. Mutat. Res. 2005;573:70–82. doi: 10.1016/j.mrfmmm.2004.07.022. [DOI] [PubMed] [Google Scholar]
- 30.Gunderson K.L., Kruglyak S., Graige M.S., Garcia F., Kermani B.G., Zhao C., Che D., Dickinson T., Wickham E., Bierle J. Decoding randomly ordered DNA arrays. Genome Res. 2004;14:870–877. doi: 10.1101/gr.2255804. [DOI] [PMC free article] [PubMed] [Google Scholar]
- 31.Oliphant A., Barker D.L., Stuelpnagel J.R., Chee M.S. BeadArray technology: enabling an accurate, cost-effective approach to high-throughput genotyping. Biotechniques. 2002;(Suppl.):56–58. [PubMed] [Google Scholar]
- 32.Walt D.R. Molecular biology: bead-based fiber-optic arrays. Science. 2000;287:451–452. doi: 10.1126/science.287.5452.451. [DOI] [PubMed] [Google Scholar]
- 33.Lee S., Kang C. CHOISS for selection of single nucleotide polymorphism markers on interval regularity. Bioinformatics. 2004;20:581–582. doi: 10.1093/bioinformatics/btg458. [DOI] [PubMed] [Google Scholar]
- 34.Wang N., Akey J.M., Zhang K., Chakraborty R., Jin L. Distribution of recombination crossovers and the origin of haplotype blocks: the interplay of population history, recombination, and mutation. Am. J. Hum. Genet. 2002;71:1227–1234. doi: 10.1086/344398. [DOI] [PMC free article] [PubMed] [Google Scholar]
- 35.The International HapMap Consortium A haplotype map of the human genome. Nature. 2005;437:1299–1320. doi: 10.1038/nature04226. [DOI] [PMC free article] [PubMed] [Google Scholar]
- 36.Barrett J.C., Fry B., Maller J., Daly M.J. Haploview: analysis and visualization of LD and haplotype maps. Bioinformatics. 2005;21:263–265. doi: 10.1093/bioinformatics/bth457. [DOI] [PubMed] [Google Scholar]
- 37.Weir B.S. Sinauer Associates; Sunderland, MA.: 1996. Genetic Data Analysis II: Methods for Discrete Population Genetic Data. [Google Scholar]
- 38.Hill W.G., Robertson A. Linkage disequilibrium in finite populations. Theor. Appl. Genet. 1968;38:226–231. doi: 10.1007/BF01245622. [DOI] [PubMed] [Google Scholar]
- 39.Song Y.S., Song J.S. Analytic computation of the expectation of the linkage disequilibrium coefficient r2. Theor. Popul. Biol. 2007;71:49–60. doi: 10.1016/j.tpb.2006.09.001. [DOI] [PubMed] [Google Scholar]
- 40.Boyles A.L., Scott W.K., Martin E.R., Schmidt S., Li Y.-J., Ashley-Koch A., Bass M.P., Schmidt M., Pericak-Vance M.A., Speer M.C., Hauser E.R. Linkage disequilibrium inflates type I error rates in multipoint linkage analysis when parental genotypes are missing. Hum. Hered. 2005;59:220–227. doi: 10.1159/000087122. [DOI] [PMC free article] [PubMed] [Google Scholar]
- 41.Satagopan J.M., Venkatraman E.S., Begg C.B. Two-stage designs for gene-disease association studies with sample size constraints. Biometrics. 2004;60:589–597. doi: 10.1111/j.0006-341X.2004.00207.x. [DOI] [PMC free article] [PubMed] [Google Scholar]
- 42.Skol A.D., Scott L.J., Abecasis G.R., Boehnke M. Joint analysis is more efficient than replication-based analysis for two-stage genome-wide association studies. Nat. Genet. 2006;38:209–213. doi: 10.1038/ng1706. [DOI] [PubMed] [Google Scholar]
- 43.Stone J.L., Merriman B., Cantor R.M., Yonan A.L., Gilliam T.C., Geschwind D.H., Nelson S.F. Evidence for sex-specific risk alleles in autism spectrum disorder. Am. J. Hum. Genet. 2004;75:1117–1123. doi: 10.1086/426034. [DOI] [PMC free article] [PubMed] [Google Scholar]
- 44.Lupski J.R., Stankiewicz P. Genomic disorders: molecular mechanisms for rearrangements and conveyed phenotypes. PLoS Genet. 2005;1:e49. doi: 10.1371/journal.pgen.0010049. [DOI] [PMC free article] [PubMed] [Google Scholar]
- 45.Sebat J., Lakshmi B., Troge J., Alexander J., Young J., Lundin P., Månér S., Massa H., Walker M., Chi M. Large-scale copy number polymorphism in the human genome. Science. 2004;305:525–528. doi: 10.1126/science.1098918. [DOI] [PubMed] [Google Scholar]
- 46.Irizarry R.A., Hobbs B., Collin F., Beazer-Barclay Y.D., Antonellis K.J., Scherf U., Speed T.P. Exploration, normalization, and summaries of high density oligonucleotide array probe level data. Biostatistics. 2003;4:249–264. doi: 10.1093/biostatistics/4.2.249. [DOI] [PubMed] [Google Scholar]
- 47.Li C., Wong W.H. Model-based analysis of oligonucleotide arrays: model validation, design issues and standard error application. Genome Biol. 2001;2 doi: 10.1186/gb-2001-2-8-research0032. 0032.1–0032.11. [DOI] [PMC free article] [PubMed] [Google Scholar]
- 48.Smyth G.K. Linear models and empirical Bayes methods for assessing differential expression in microarray experiments. Stat. Appl. Genet. Mol. Biol. 2004;3:3. doi: 10.2202/1544-6115.1027. [DOI] [PubMed] [Google Scholar]
- 49.Abu-Khalil A., Fu L., Grove E.A., Zecevic N., Geschwind D.H. Wnt genes define distinct boundaries in the developing human brain: Implications for human forebrain patterning. J. Comp. Neurol. 2004;474:276–288. doi: 10.1002/cne.20112. [DOI] [PubMed] [Google Scholar]
- 50.Verkerk A.J., Mathews C.A., Joosse M., Eussen B.H., Heutink P., Oostra B.A. CNTNAP2 is disrupted in a family with Gilles de la Tourette syndrome and obsessive compulsive disorder. Genomics. 2003;82:1–9. doi: 10.1016/s0888-7543(03)00097-1. [DOI] [PubMed] [Google Scholar]
- 51.Viding E., Spinath F.M., Price T.S., Bishop D.V.M., Dale P.S., Plomin R. Genetic and environmental influence on language impairment in 4-year-old same-sex and opposite-sex twins. J. Child Psychol. Psychiatry. 2004;45:315–325. doi: 10.1111/j.1469-7610.2004.00223.x. [DOI] [PubMed] [Google Scholar]
- 52.Lamb J.A., Barnby G., Bonora E., Sykes N., Bacchelli E., Blasi F., Maestrini E., Broxholme J., Tzenova J., Weeks D. Analysis of IMGSAC autism susceptibility loci: evidence for sex limited and parent of origin specific effects. J. Med. Genet. 2005;42:132–137. doi: 10.1136/jmg.2004.025668. [DOI] [PMC free article] [PubMed] [Google Scholar]
- 53.Abrahams B.S., Tentler D., Perederiy J.V., Oldham M.C., Coppola G., Geschwind D.H. Genome-wide analyses of human perisylvian cerebral cortical patterning. Proc. Natl. Acad. Sci. USA. 2007;104:17849–17854. doi: 10.1073/pnas.0706128104. [DOI] [PMC free article] [PubMed] [Google Scholar]
- 54.Lieberman P. On the nature and evolution of the neural bases of human language. Am. J. Phys. Anthropol. 2002;(Suppl 35):36–62. doi: 10.1002/ajpa.10171. [DOI] [PubMed] [Google Scholar]
- 55.Vargha-Khadem F., Gadian D., Copp A., Mishkin M. FOXP2 and the neuroanatomy of speech and language. Nat. Rev. Neurosci. 2005;6:131–138. doi: 10.1038/nrn1605. [DOI] [PubMed] [Google Scholar]
- 56.Loveland K.A., Landry S.H. Joint attention and language in autism and developmental language delay. J. Autism Dev. Disord. 1986;16:335–349. doi: 10.1007/BF01531663. [DOI] [PubMed] [Google Scholar]
- 57.Mundy P., Sigman M., Kasari C. A longitudinal study of joint attention and language development in autistic children. J. Autism Dev. Disord. 1990;20:115–128. doi: 10.1007/BF02206861. [DOI] [PubMed] [Google Scholar]
- 58.Polleux F., Lauder J.M. Toward a developmental neurobiology of autism. Ment. Retard. Dev. Disabil. Res. Rev. 2004;10:303–317. doi: 10.1002/mrdd.20044. [DOI] [PubMed] [Google Scholar]
- 59.Arking D.E., Cutler D.J., Brune C.W., Teslovich T.M., West K., Ikeda M., Rea A., Guy M., Lin S., Cook E.H., Chakravarti A. A common genetic variant in the neurexin superfamily member CNTNAP2 increases familial risk of autism. Am. J. Hum. Genet. 2008;82:160–164. doi: 10.1016/j.ajhg.2007.09.015. this issue. [DOI] [PMC free article] [PubMed] [Google Scholar]
- 60.Bakkaloglu B., O'Roak B.J., Louvi A., Gupta A.R., Abelson J.F., Morgan T.M., Chawarska K., Klin A., Ercan-Sencicek A.G., Stillman A.A. Molecular cytogenetic analysis and resequencing of Contactin Associated Protein-Like 2 in autism spectrum disorders. Am. J. Hum. Genet. 2008;82:165–173. doi: 10.1016/j.ajhg.2007.09.017. this issue. [DOI] [PMC free article] [PubMed] [Google Scholar]
- 61.The Autism Genome Project Consortium Mapping autism risk loci using genetic linkage and chromosomal rearrangements. Nat. Genet. 2007;39:319–328. doi: 10.1038/ng1985. [DOI] [PMC free article] [PubMed] [Google Scholar]
- 62.Badner J.A., Gershon E.S. Regional meta-analysis of published data supports linkage of autism with markers on chromosome 7. Mol. Psychiatry. 2002;7:56–66. doi: 10.1038/sj.mp.4000922. [DOI] [PubMed] [Google Scholar]
- 63.Veenstra-VanderWeele J., Christian S.L., Cook J.E.H. Autism as a paradigmatic complex genetic disorder. Annu. Rev. Genomics Hum. Genet. 2004;5:379–405. doi: 10.1146/annurev.genom.5.061903.180050. [DOI] [PubMed] [Google Scholar]
- 64.Scherer S.W., Green E.D. Human chromosome 7 circa 2004: a model for structural and functional studies of the human genome. Hum. Mol. Genet. 2004;13(Suppl 2):R303–R313. doi: 10.1093/hmg/ddh231. [DOI] [PubMed] [Google Scholar]
Associated Data
This section collects any data citations, data availability statements, or supplementary materials included in this article.
Supplementary Materials
Excel file (838 kb).