

Abstract
Progress in the mapping of population genetic substructure provides a core source of data for the reconstruction of the demographic history of our species and for the discovery of common signals relevant to disease research: These two aspects of enquiry overlap in their empirical data content and are especially informative at continental and subcontinental levels. In the present study of the variation of the Y chromosome pool of ethnic Russians, we show that the patrilineages within the pre-Ivan the Terrible historic borders of Russia have two main distinct sources. One of these antedates the linguistic split between West and East Slavonic-speaking people and is common for the two groups; the other is genetically highlighted by the pre-eminence of haplogroup (hg) N3 and is most parsimoniously explained by extensive assimilation of (or language change in) northeastern indigenous Finno-Ugric tribes. Although hg N3 is common for both East European and Siberian Y chromosomes, other typically Siberian or Mongolian hgs (Q and C) have negligible influence within the studied Russian Y chromosome pool. The distribution of all frequent Y chromosome haplogroups (which account for 95% of the Y chromosomal spectrum in Russians) follows a similar north-south clinal pattern among autosomal markers, apparent from synthetic maps. Multidimensional scaling (MDS) plots comparing intra ethnic and interethnic variation of Y chromosome in Europe show that although well detectable, intraethnic variation signals do not cross interethnic borders, except between Poles, Ukrainians, and central-southern Russians, thereby revealing their overwhelmingly shared patrilineal ancestry.
Main Text
The haploid Y chromosome is one of the most variable genetic systems in humans, and its phylogeny1,2 and phylogeography are increasingly better understood, thereby allowing inferences to be made about its variation in space and time, as well as synthesis of the emerging picture with those arising from matrilineal mtDNA phylogeny and autosomal portion of the human genome.3 Yet the genetic sampling of Europe has so far been heavily focused on the western parts of the subcontinent, and often only a few sampling spots for an ethnic group is considered to represent the variation in multimillion population of a large territory.
The first broad studies of the variation of the patrilineal genetic system in Europe4,5 immediately revealed its marked phylogeographic differentiation. These two pioneering papers and subsequent studies6–10 have shown that western Europeans carry predominantly haplogroup R1b, whereas eastern Europeans have high frequency of R1a lineages, that southern Slavs are characterized by high frequency of I1b, whereas Scandinavia is enriched with I1a, and that haplogroups J2 and E3b are confined mainly to southern Europe. In more general terms, it has been concluded that geography, rather than language, explains the observed clinal distribution of NRY variation in Europe.5
Ethnicity typically emphasizes linguistic, cultural, and often religious, as well as political, aspects ascribed to human groups11 and might be differently interpreted in various research fields and scholarly traditions. Here, the term is used in a more stringent meaning, combining linguistic identity with historical background of the population, including its territorial identity and biogeographic ancestry.
Studies dedicated to Y chromosomal intraethnic variation in Europe and its neighborhood are so far limited. Kayser et al.12 analyzed Polish and German populations and found that genetic boundaries coincide with the political boundary between Poles and Germans. Cinnioğlu et al.13 studied patterns in the geographic distribution of the Y chromosome haplogroups within Turkey. Malyarchuk et al.14 investigated differences among southern and central Russian populations, whereas Karlsson et al.,15 Luca et al.,16 and Kasperaviciute et al.17 examined variation within Sweden, Czech Republic, and Lithuania, respectively. Unfortunately, some other large subcontinental areas in Europe are not studied yet in respect to intraethnic (defined primarily by language and political-border criteria) variation of their Y chromosome pools.
East Europe, in particular its southern steppe belt but also the more northern forest zone, have been, throughout millennia, a crossroad for many populations claiming their origin from a vast area stretching from central Europe to the borders of China. Although much of East Europe was inhabited by anatomically modern humans long before the Last Glacial Maximum approximately 20,000 years ago,18,19 and the Neolithic offers increasingly rich archaeological evidence for human habitation, there is no direct evidence for the linguistic affiliation of the first pastoral nomads in the East European steppe belt (possibly Indo-Iranian speakers) or the northern forest zone (possibly ancestors of the Finno-Ugric-speaking people). There is virtually no knowledge about the genetics of these prehistoric populations. However, the evidence from cranial morphology suggests that typically East Eurasian, the so-called “mongoloid type,” started to appear at the borders of Europe only much later, partly because of expansion of the Turkic-speaking people who replaced Indo-Iranians in East Europe at the beginning of the Common Era (CE).
Although the exact place of the Slavonic homeland is still debated, it is generally accepted that the southeastward and northeastward expansion of the Slavonic-speaking tribes from Central Europe started in approximately 7th–9th centuries CE. Eastward, this process has probably included extensive, long-lasting processes of assimilation of and admixture with populations living in East Europe—Baltic speakers in the west and Finnic speakers in the central-eastern and northern areas—whereas most of the North Pontic area was presumably inhabited by Indo-Iranian and Turkic-speaking tribes (as well as by other groups, bearing in mind the legacy of Magyars).
Here, we focus on the intraethnic variation among Russians, the largest in present-day monoethnic population, living in an area covering more than a third of continental Europe. Russian “ethnicity,” understood as indicated above, was finally formed approximately in the 14th-16th centuries within the central-eastern and northern parts of the eastern Europe, whereas the south and the west of this large area became homelands of linguistically closely related Ukrainians and Belorussians. The Grand Duchy of Moscow included many of the Russian princedoms (Figure 1) and formed a core of the historical Russian area.
Figure 1.
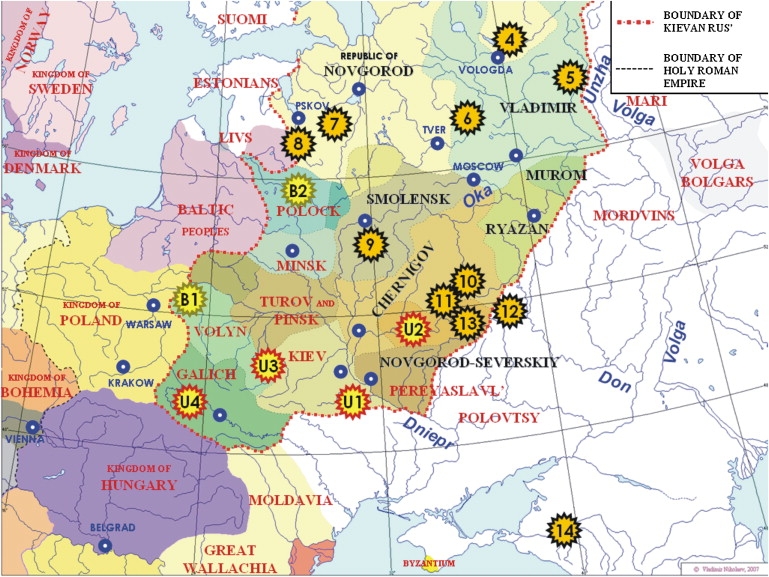
East Europe in the 12th Century
Black labels mark Russian princedoms which transformed later into the Grand Duchy of Moscow. The map is used by permission of Vladimir Nikolaev (www.ostu.ru/personal/nikolaev). Asterisks designate locations of the present-day populations studied here. Black asterisks mark Russian populations, whereas red and green asterisks mark Ukrainian and Belorussian populations (used for comparative analysis), respectively. Numbers in black asterisks refer to Table 1, except for three northern Russian populations (1–3), established after 12th century and not placed on this map.
The genetic sampling in this study is restricted to the Russian subpopulations from the historical Russian area, defined here as the territory before the extensive expansion phase since Ivan the Terrible in the mid-16th century and beyond. Most of the present-day ethnic Russians—approximately 100 millions—live currently in the borders of this historic area according to the 2002 year census, and the present sampling (14 regions, 1228 Y chromosomes) is the first that covers this wide area nearly uniformly.
Our Y chromosome phylogenetic analysis is designed for studying intraethnic variation of the paternal lineages among Russians and for revealing their putative admixture with non-Russian populations during the history of the Slavic presence in East Europe. With the help of published data, we briefly discuss the hierarchy of NRY variation more broadly in West Eurasia within and between ethnic boundaries.
We collected 1228 DNA samples from 14 regional Russian populations. All sampled individuals identified their four grandparents as ethnic Russians, with their mother tongue being Russian. The rural areas and small towns were chosen for sampling so that the influence of more recent migrations could be minimized. Only individuals with all four grandparents born in the local area were sampled. Sampled persons were unrelated at least up to the third degree of relation (cousins were not sampled, second cousins only when not related by direct paternal or maternal lines). Informed consent was obtained in all cases. All populations were collected under the same sampling strategy described above, with the exception of the Vologda samples collected from the recruits. For each sampled population, latitude and longitude information together with its provincial (“oblast”) and district (“raion”) affiliation is given in Table 1.
Table 1.
Localization of the Studied Russian Populations
| Geographic Position | Population Number | Population name | N | Oblast (Province) | Raion (District) | Longitude | Latitude | Responsible Researcher(s) |
|---|---|---|---|---|---|---|---|---|
| Northern | 1 | Mezen | 54 | Arkhangel | Leshukonsky (Mezen river) | 45.74 | 64.9 | Balanovska, Evseeva |
| Northern | 2 | Pinega | 114 | Arkhangel | Pinezhsky (upper Pinega river) | 46.53 | 63.45 | Balanovska, Balanovsky |
| Northern | 3 | Krasnoborsk | 91 | Arkhangel | Krasnoborsky and Lensky | 45.94 | 61.56 | Balanovska, Evseeva |
| Northern | 4 | Vologda | 121 | Vologda | Different districts | 39.9 | 59.23 | Boldyreva |
| Central | 5 | Unzha | 52 | Kostroma | Manturovsky and Mezhevskoy (Unzha river) | 44.77 | 58.34 | Balanovska, Balanovsky |
| Central | 6 | Kashin | 73 | Tver | Kashinsky | 37.61 | 57.36 | Balanovska, Balanovsky |
| Central | 7 | Porhov | 57 | Pskov | Porhovsky and Dedovichsky | 29.56 | 57.77 | Balanovska, Balanovsky |
| Central | 8 | Ostrov | 75 | Pskov | Ostrovsky | 28.32 | 57.35 | Balanovska, Balanovsky |
| Central | 9 | Roslavl | 107 | Smolensk | Roslavlsky and Ershichsky | 32.87 | 53.95 | Balanovska, Balanovsky |
| Southern | 10 | Livni | 110 | Orel | Livnensky | 37.59 | 52.4 | Balanovska, Churnosov |
| Southern | 11 | Pristen | 45 | Kursk | Pristensky | 36.71 | 51.23 | Balanovska, Churnosov |
| Southern | 12 | Repievka | 96 | Voronezh | Repievsky | 38.65 | 51.08 | Balanovska, Churnosov |
| Southern | 13 | Belgorod | 143 | Belgorod | Yakovlevsky, Prohorovsky and Krasnensky | 36.48 | 50.78 | Balanovska, Churnosov |
| Southern | 14 | Kuban Cossacs | 90 | Adygey | Maykopsky | 40.17 | 44.51 | Balanovska, Pocheshkova |
Fourteen studied populations cover relatively uniformly the central and southern part of the European Russia and the Russian North. Kuban Cossacs, formed in the 18th century in the North Caucasus, is the only group outside this area. Figure 2 shows locations of the sampled populations and a spatial interpolation confidence zone (this zone is outlined by a gray line on maps in Figures 3 and 4). The collected samples were genotyped for 32 informative Y chromosome biallelic markers (see footnote of Table 2 for details).
Figure 2.
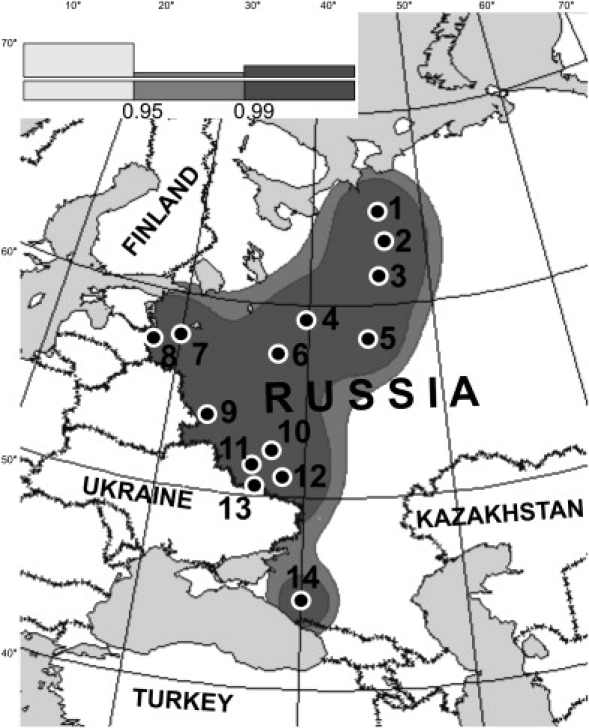
Location of the Studied Populations
The reliability map inventing areas where concentration of the studied Russian populations is high enough to support correct cartographic interpolation was constructed by software described in 29. Areas that surrounded the studied populations were estimated as more reliable, considering cumulative distance to all studied locations. Dark gray and gray zones correspond to 99% and 95% confidence space, respectively. The area with 95% probability of correct cartographic interpolation is marked by the gray line in maps at Figures 3 and 4. Numbers of populations refer to Table 1.
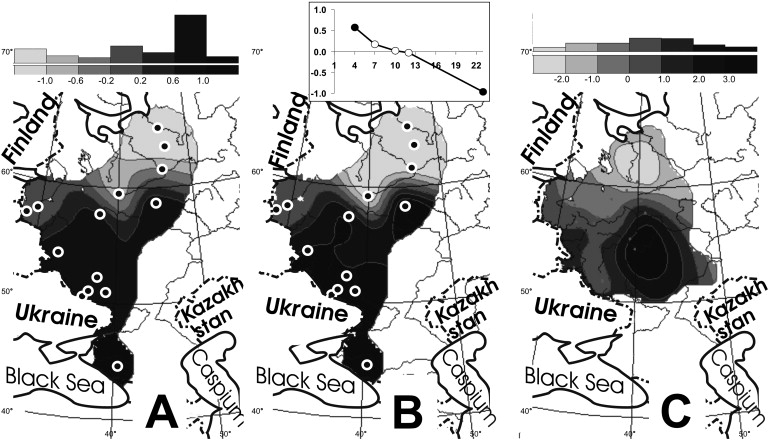
Figure 3.
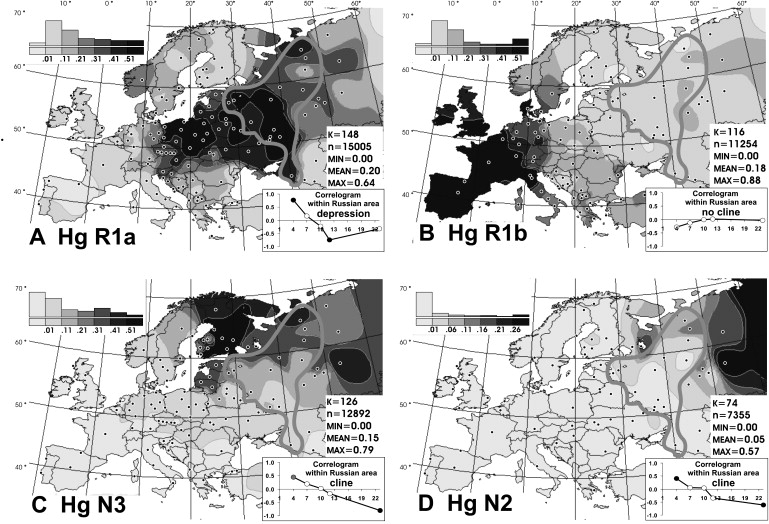
Distribution of Y Chromosomal Haplogroups R1a, R1b, N3, and N2 in Europe
Panels are described as follows: (A), frequency distribution map of haplogroup R1a; (B), frequency distribution map of haplogroup R1b; (C), frequency distribution map of haplogroup N3; and (D), frequency distribution map of haplogroup N2. The correlogram on each map indicates results of the spatial-autocorrelation analysis of the given haplogroup distribution within the studied Russian area. The Moran's I coefficient was calculated in the PASSAGE program40 with binary weight matrix with five distance classes. Absciss shows the distance (in hundreds of kilometers); the longest-distance classes is wider because of less number of distant populations. Nonsignificant values are shown as empty circles; significant values are shown as black (p > 0.01) and gray (p > 0.05) circles.
Maps were created with haplogroup frequency data from this study and literature4–7,9,10,12,13,15–17,20,21,33,37,39,41–55 in the GGMAG program package as described in 56 and 57. Because of different phylogenetic resolution levels of data from literature, not all of them were included for creating all eight maps. If source identified R1a1 and R1(xR1a1) haplogroups, they were taken for the mapmaking as R1a and R1b, respectively. Gray lines mark the studied Russian area.
Population grouping. Most of populations with sample size less than 40 were omitted or pooled. Data on the same group from the different sources with the sample sizes greater than 40 were pooled when exact localities were not specified in all sources. The map scales are different for frequent (R1a, R1b, and N3, 10% scale step) and less frequent haplogroups (the other five, 5% step); for all maps, the first interval indicates virtual absence (less than 1%). The bar graph above the scale shows the portion of the total area covered by the respective scale interval. Abbreviations in the statistical legend indicate the following: K, number of the studied populations; n, number of samples in K populations; and MIN, MEAN, and MAX, the minimal, mean and maximum frequencies on the map.
Figure 4.
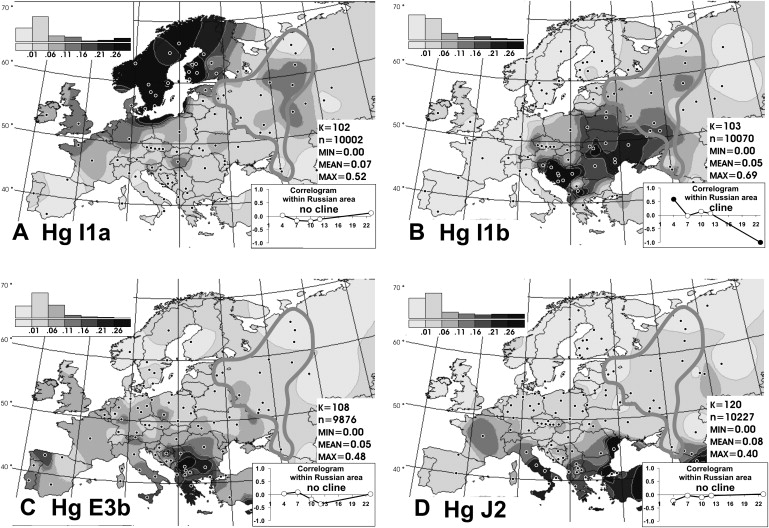
Distribution of Y Chromosomal Haplogroups I1a, I1b, J2, and E3b in Europe
(A) Frequency distribution map of haplogroup I1a.
(B) Frequency distribution map of haplogroup I1b.
(C) Frequency distribution map of haplogroup E3b.
(D) Frequency distribution map of haplogroup J2.
Table 2.
Frequencies of the Y Chromosomal Haplogroups in Russian Populations
| C |
E3b1 |
E3b3 |
F∗c |
G1∗d |
G2 |
I∗e |
I1a |
I1b |
I1c |
J1 |
J2 |
K∗f |
K2 |
N∗g |
N2 |
N3 |
Q |
R1a |
R1b2 |
R1b3 |
R2 |
||
|---|---|---|---|---|---|---|---|---|---|---|---|---|---|---|---|---|---|---|---|---|---|---|---|
| Population Number and Namea | Nb | M130 | M78 | M123 | M89 | M285 | P15 | M170 | M253 | P37 | M223 | M267 | M172 | M9 | M70 | M231 | P43 | TAT | M242 | SRY1532 | M73 | M269 | M124 |
| 1 Mezen | 54 | 0 | 0 | 0 | 1.9 | 0 | 0 | 0 | 0 | 0 | 0 | 0 | 0 | 0 | 0 | 0 | 7.4 | 46.3 | 0 | 44.4 | 0 | 0 | 0 |
| 2 Pinega | 114 | 0 | 0 | 0 | 0 | 0 | 0 | 0 | 0.9 | 4.4 | 0 | 0.9 | 0 | 0 | 0 | 0 | 15.8 | 23.7 | 0.9 | 39.5 | 0 | 14 | 0 |
| 3 Krasnoborsk | 91 | 0 | 0 | 0 | 1.1 | 0 | 2.2 | 3.3 | 12.1 | 9.9 | 0 | 0 | 5.5 | 0 | 0 | 0 | 3.3 | 36.3 | 0 | 19.8 | 0 | 6.6 | 0 |
| 4 Vologda | 121 | 0 | 0.8 | 0 | 0 | 1.7 | 0.8 | 0 | 11.6 | 8.3 | 1.7 | 0 | 0.8 | 0 | 0 | 0 | 3.3 | 35.5 | 1.7 | 33.1 | 0 | 0.8 | 0 |
| NORTHERN TOTAL | 380 | 0 | 0.2 | 0 | 0.8 | 0.4 | 0.8 | 0.8 | 6.2 | 5.7 | 0.4 | 0.2 | 1.6 | 0 | 0 | 0 | 7.5 | 35.5 | 0.7 | 34.2 | 0 | 5.4 | 0 |
| 5 Unzha | 52 | 0 | 5.8 | 0 | 1.9 | 0 | 0 | 0 | 11.5 | 11.5 | 3.8 | 3.8 | 3.8 | 0 | 0 | 0 | 0 | 13.5 | 0 | 32.7 | 1.9 | 9.6 | 0 |
| 6 Kashin | 73 | 0 | 4.1 | 0 | 1.4 | 0 | 0 | 0 | 2.7 | 8.2 | 4.1 | 0 | 4.1 | 0 | 0 | 0 | 0 | 11 | 1.4 | 56.2 | 0 | 6.8 | 0 |
| 7 Porhov | 57 | 0 | 1.8 | 1.8 | 0 | 0 | 0 | 1.8 | 3.5 | 10.5 | 0 | 0 | 0 | 3.5 | 0 | 1.8 | 1.8 | 15.8 | 0 | 52.6 | 0 | 5.3 | 0 |
| 8 Ostrov | 75 | 0 | 4 | 0 | 0 | 0 | 0 | 1.3 | 6.7 | 9.3 | 0 | 1.3 | 1.3 | 0 | 0 | 0 | 0 | 28 | 0 | 45.3 | 0 | 2.7 | 0 |
| 9 Roslavl | 107 | 0.9 | 7.5 | 0 | 0.9 | 0 | 0 | 0 | 1.9 | 10.3 | 0 | 0 | 2.8 | 1.9 | 2.8 | 0 | 0.9 | 13.1 | 0 | 45.8 | 0 | 11.2 | 0 |
| CENTRAL TOTAL | 364 | 0.2 | 4.6 | 0.4 | 0.8 | 0 | 0 | 0.6 | 5.3 | 10 | 1.6 | 1 | 2.4 | 1.1 | 0.6 | 0.4 | 0.5 | 16.3 | 0.3 | 46.5 | 0.4 | 7.1 | 0 |
| 10 Livni | 110 | 0 | 0.9 | 0 | 0 | 0 | 0 | 0 | 8.2 | 13.6 | 0.9 | 0 | 0.9 | 0 | 2.7 | 0 | 0.9 | 4.5 | 0.9 | 62.7 | 0 | 3.6 | 0 |
| 11 Pristen | 45 | 0 | 2.2 | 0 | 0 | 0 | 0 | 0 | 4.4 | 17.8 | 0 | 0 | 2.2 | 0 | 2.2 | 0 | 0 | 13.3 | 0 | 55.6 | 0 | 2.2 | 0 |
| 12 Repievka | 96 | 0 | 1 | 0 | 1 | 0 | 2.1 | 1 | 3.1 | 16.7 | 0 | 2.1 | 1 | 0 | 0 | 0 | 0 | 6.3 | 0 | 59.4 | 0 | 5.2 | 1 |
| 13 Belgorod | 143 | 0.7 | 0.7 | 0 | 0 | 0 | 0.7 | 0 | 3.5 | 12.6 | 0.7 | 0 | 4.2 | 0.7 | 1.4 | 0 | 0.7 | 11.9 | 0 | 59.4 | 0 | 2.8 | 0 |
| 14 Kuban Cossacs | 90 | 0 | 3.3 | 0 | 0 | 0 | 1.1 | 1.1 | 4.4 | 16.5 | 2.2 | 0 | 4.4 | 0 | 1.1 | 0 | 1.1 | 6.6 | 1.1 | 47.3 | 0 | 8.8 | 0 |
| SOUTHERN TOTAL | 484 | 0.2 | 1.8 | 0 | 0.3 | 0 | 1 | 0.5 | 3.9 | 15.9 | 0.7 | 0.5 | 3 | 0.2 | 1.2 | 0 | 0.5 | 9.5 | 0.3 | 55.4 | 0 | 4.8 | 0.3 |
Populations numbers are as shown in Table 1 and in Figure 1. Column headers include haplogroup designation and the last downstream marker (according to YCC1).
The full set of 1228 samples was hierarchically genotyped by 32 biallelic markers, including 12f2 deletion,58 YAP insertion,59 and 30 SNP markers. Markers M9, SRY1532, TAT, 92R7, P43, M269, M170, M89, P37, M253, M35, M78, M172, M173, and M231 were typed by RFLP assays as described previously.7,21–23,44,60–65 Markers M26 (typed for P37 derived state samples from populations of Pinega, Unzha, Roslavl, Belgorod, Ostrov, Porhov, and Cossacs, all showing ancestral state of M26), M70, M123, M73, M124, M128, M130, M201, M207, and M223 were typed by direct sequencing with primers described in;65 M242, M267, and M285 were sequenced according to,13 P15 was sequenced according to,66 and P20 was sequenced with primers from.1
Paragroup F∗ refers to samples with M89-derived state, ancestral state for M9, M201, M170, and 12f2.
Paragroup G1∗ refers to samples with M285 derived state, ancestral state for P20.
Paragroup I∗ refers to samples with M170 derived state, ancestral state for M253, P37, and M223.
Paragroup K∗ refers to samples with M9 derived state, ancestral state for M70, 92R7, and M231.
Paragroup N∗ refers to samples with M231 derived state, ancestral state for TAT, P43, and M128.
The 1228 Russian Y chromosomes analyzed, all except 20 (1.6%) fall into seven major haplogroups (E, G, I, J, K2, N, and R1) characteristic to West Eurasian populations (Table 2). Eleven samples could be classified up to the root level of haplogroups F and K, and nine samples (0.7%) fell into haplogroups C, Q, and R2 that are specific to East and South Asian populations. At a higher level of molecular resolution, only eight subclades of these major West Eurasian Y chromosome haplogroups are presented with their average frequency greater than 1%, including R1a, N3, I1b, R1b, I1a, J2, N2, and E3b. Taken together, they account for 95% of the total Russian Y chromosomal pool. These eight haplogroups were chosen for cartographical- and spatial-autocorrelation analyses (Figures 3, 4, and 5), whereas statistical analysis (Figure 6) is based on all 22 haplogroups identified in Russians. Figure 7 is based on eight haplogroups, and comparative MDS, GST, and AMOVA analyses are based on six haplogroups (Figure 8, Table 3) because of the lack of high-resolution data in the literature.
Figure 5.
Synthetic Maps of the Russian Gene Pool
The synthetic maps25 were constructed from the correlation matrix as described in 26. Maps A and B are based on frequencies of eight haplogroups in 14 Russian populations; data are from Table 2.
(A) The first synthetic map of the Y chromosomal variation. The interpolated frequency distribution maps of individual haplogroups were created, and then the principal components (synthetic maps) were calculated from these interpolated distributions.
(B) The map of the first principal component of the Y chromosomal variation. The principal components were calculated from the raw data in Statistica 6.0 software, and then the values were interpolated so that the map was obtained. Comparing maps A and B allowed an estimation of possible artifacts caused in the map A by the initial interpolation.
(C) The first synthetic map of the classical markers variation. The map is based on frequencies of 35 alleles of 13 loci, studied on average in 39 Russian populations; data came from the Russian Gene Pool databank (see Web Resources).
Figure 6.
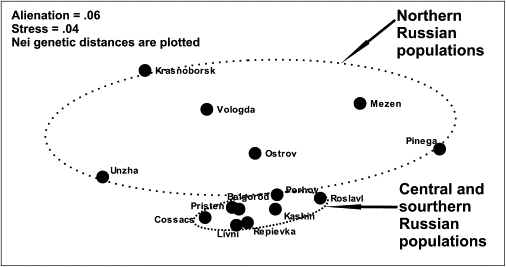
MDS Plot Depicting Genetic, Y Chromosomal, Relationships between 14 Russian Populations
Figure 7.
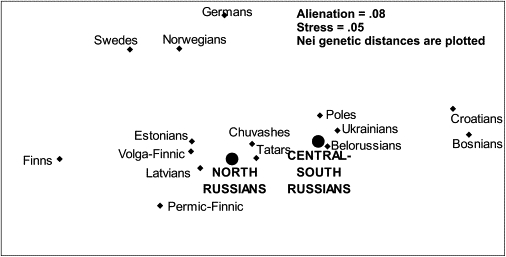
MDS Plot Revealing Different Patrilineal Affinities of Northern and Central-Southern Russians
Figure 8.
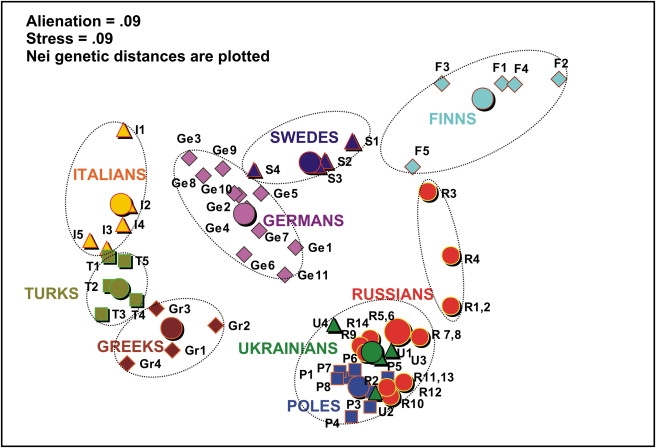
MDS Plot of the Y Chromosomal Variation, Grouping Regional Subpopulations and Averaged Ethnical Populations of Europe
The aggregate set of populations (specified in the Table 3) was used, except for Croatians (isolated island populations) and Belorussians (data of lower phylogenetic resolution). Regional subpopulations of different ethnic affiliation are marked by signs of different color and shape (small circles, triangles, and cubes) and designated by abbreviations (populations names are those published in the original papers, indicated in the Table 3). Average values for ethnic populations are marked by large circles and bold names. The analysis was performed in Statistica 6.0 program. Axes were omitted from the plot.
Greeks: Gr1, central (Agrinion, Ioannina, Kardhitsa, and Patrai); Gr2, northern (Larisa, Serrai, Thessaloniki); Gr3, isles (Khios, Mitilini); and Gr4, Crete (Iraklion, Khania, Lasithi, Rethimnon).
Italians: I1, northern (Val di Non, Verona, Garfagnana, and Genoa); I2, central (L'Aquila, Pescara, and Avezzano); I3, southern (Benevento, Foggia, and North Gargano); I4, south-eastern (Altamura, Brindisi, Casarano, and Matera); and I5, southwestern (Cilento, Paola, and Reggio Calabria).
Germans: G1, Berlin; G2, Cologne; G3, Freiburg; G4, Greifswald; G5, Hamburg; G6, Leipzig; G7, Magdeburg; G8, Mainz; G9, Muenster; G10, Munich; and G11, Rostock.
Poles: P1, Bydgoszcz; P2, Gdansk; P3, Krakow; P4, Lublin; P5, Suwalki; P6, Szczecin; P7, Warsaw; and P8, Wroclaw.
Ukrainians: U1, Dnepr; U2, eastern; U3, Podol; and U4, western (Lvov and Ivano-Frankovsk).
Finns: F1, Northern Ostrobothnia; F2, Northern Savo; F3, southern (Southwest Finland, Hame, and Satakunta); F4, Karelia (Northern Karelia and Southern Karelia); and F5, Ostrobotnia (South Ostrobotnia and Swedish-speaking Ostrobotnia).
Swedes: S1, Vasterbotten; S2, Blekinge and Gotland; S3, Uppsala and Varmland; and S4, Skaraborg, Ostergotland, and Jonkoping.
Russians: Populations numbers as shown in Tables 1 and 2 and Figure 2. Populations with sample sizes less than 70 were pooled (population 1 with 2, 5 with 6, 7 with 8, and 11 with 13) and marked on the plot as R1,2; R5,6; R7,8; and R11,13, respectively.
Turks: Similarly, population 1 was pooled with 2; 5 with 6; and 7 with 8, and pooled populations were marked on the plot as T1,2; T5,6; and T7,8, respectively.
Table 3.
Level of the Intraethnic Variation for Some Ethnic Groups in Europe
| Raw Y Chromosomal Dataseta |
Aggregate Y Chromosomal Dataseta |
Classical Markers Dataset |
||||||||||||||
|---|---|---|---|---|---|---|---|---|---|---|---|---|---|---|---|---|
| Ethnic Group | NPOPb | Nc | NHGd | Average Distancee | GSTe | NPOP | N | NHG | Average Distance | GST | AMOVAe | Reference | NPOP | NALd | GST | Reference |
| Finns | 9 | 60 | 16 | 14.5 | 8.7 | 5 | 107 | 6 | 12.7 | 8.2 | – | 39 | 15 | 26 | 1 | 67 |
| Croatians | 6 | 91 | 9 | 14.5 | 6.8 | 5 | 100 | 8 | 17.9 | 8 | – | 20,49 | ||||
| Russians | 14 | 88 | 23 | 13.7 | 5.2 | 10 | 123 | 8 | 14.2 | 5.2 | – | This study | 35 | 44 | 2 | 67 |
| Italians | 17 | 31 | 9 | 21.3 | 7.4 | 5 | 105 | 8 | 12.8 | 3.9 | – | 46 | 23 | 37 | 1.7 | 67 |
| Swedes | 7 | 44 | 13 | 11.1 | 2.9 | 4 | 76 | 12 | 13 | 2.7 | – | 15 | 22 | 36 | 0.3 | 67 |
| Germans | 11 | 110 | 11 | 6.6 | 2.1 | 11 | 110 | 9 | 6.6 | 2.1 | – | 12 | 23 | 47 | 0.4 | 67 |
| Greeks | 13 | 28 | 9 | 23.6 | 4.9 | 4 | 91 | 8 | 9.5 | 1.4 | – | 46 | 20 | 31 | 0.9 | 67 |
| Turks | 9 | 57 | 52 | 25.4f | 2.3 | 5 | 87 | 26 | 16.5f | 1.3 | – | 13 | – | – | – | – |
| Poles | 8 | 114 | 11 | 1.7 | 1.1 | 8 | 114 | 7 | 1.7 | 1.1 | – | 12 | 16 | 26 | 0.3 | 67 |
| Belorussians | 8 | 68 | 6 | 2.9 | 1.7 | 6 | 90 | 6 | 1.6 | 1.1 | – | This study and20 | – | – | – | – |
| Ukrainians | 6 | 68 | 19 | 8.2 | 2.9 | 4 | 102 | 10 | 2.4 | 0.9 | – | This study | – | – | – | – |
| Interethnic Variation (among groups) | – | – | – | – | – | 10 | – | 6 | – | 14.9 | 16.6 | This study | – | – | – | – |
| Intraethnic Variation (within groups) | – | – | – | – | – | 6 | – | 6 | – | 2.9 | 2.7 | This study | – | – | – | – |
| Intrapopulation (within populations) | – | – | – | – | – | 61 | – | 6 | – | 82.2 | 80.7 | This study | – | – | – | – |
For Y chromosome variation, two datasets were analyzed: (1) raw dataset (as published by the authors) and (2) aggregate dataset (some populations were pooled to reach sample size above 70; rare haplogroups were omitted). Only groups for which aggregate dataset could be obtained for four or more populations were included in this analysis.
Number of studies subpopulations.
Average sample size per subpopulation.
Number of haplogroups (for classical markers, the number of alleles).
Interpopulation variation of the Y chromosome was calculated as (first measure) average Nei genetic distances between each population pair and (second measure) as GST value (according to 68 and 69). Interpopulation variation of the classical markers was calculated as the GST value. Hierarchical analysis was performed with GST and also with AMOVA in the Arlequin 2.0 software. Values of Nei genetic distances and GST are given multiplied by 100. GST on aggregate Y chromosomal dataset, GST on classical markers data, and AMOVA values are shaded in gray.
Although in most cases, both measures group populations in a similar manner, the considerably higher average distance among Turks is caused by deeper phylogenetic resolution in the original paper. When 26 haplogroups were pooled into eight, the average distance among Turks decreased from 16.5 to 3.5; GST depends less than average distance on number of identifying haplogroups, decreasing from 1.3 to 0.8.
Every second Russian Y chromosome belongs to haplogroup R1a. Figure 3A shows distribution of this haplogroup in the studied historic Russian area (indicated by the gray line) within a general European context. With the exclusion of Central and South Asian populations, the map demonstrates that within the boundaries of Europe, R1a is characteristic for Balto-Slavonic populations, with two exceptions: southern Slavs20 and northern Russians (Figure 3A). R1a frequency decreases in northeastern Russian populations down to 20%–30%, in contrast to central-southern Russia, where its frequency is twice as high (Table 2). To investigate statistical significance of this cline, we performed the spatial-autocorrelation analysis (correlogram on the Figure 3A). With increasing distance class, autocorrelation value changes from significantly positive to significantly negative values, confirming that variation of R1a within historical Russian area is generally clinal, but the value becomes nonsignificant and close to zero in the longest-distance class (a “depression”), indicating that influence of this cline is restricted to a part of the studied area. The map on Figure 3A shows that the northward decreasing cline is interrupted in the two, northernmost and southernmost, populations (both are recognized as specific subethnic groups of Russians, namely Cossacs and Pomors); when these two marginal populations were omitted the correlogram reveals the cline in the remaining core area (data not shown).
Typically for East European populations, the frequency of its sister group R1b in Russians is much lower (Table 2). Despite the clear west-to-east clinal trend in the whole Europe (4 and 5 and Figure 3B), inside the historical Russian area, its distribution is somewhat mosaic (map on the Figure 3B). Spatial-autocorrelation analysis (Figure 3B) confirmed the absence of clinal variation of R1b within the historical Russian area.
The second frequent among Russians is haplogroup N3 (Figure 3C), which is a typical haplogroup for Altaic and Finno-Ugric populations of Siberia and northeastern Europe.21–23 Figure 3C illustrates the fact that within the Russian area, the frequency of N3 decreases significantly from north (>35%) to south (<10%). Thus, N3 follows a trend, opposite to that observed for R1a. Similarly, haplogroup N2 reveals a northeast-to-southwest declining frequency pattern (Figure 3D). This sister group to N3 is widespread in west Siberia23,24 and is present also in Volga-Uralic region populations with frequency at approximately 20%.6,21 Northern Russians possess this haplogroup at variable frequencies (14%, 7%, and 3% in the three northern populations), whereas it is virtually absent elsewhere among Russians. Correlograms on Figures 3C and 3D strongly support clinal variation of haplogroups N2 and N3 in Russian populations.
The third most frequent haplogroup in Russians is I1b, and its variation is also clinal (Figure 4B). The map on Figure 4B demonstrates that distribution of I1b inside the historic Russian area follows the “out-of-Balkans” decreasing trend:7 In southwestern Russians, its frequency is approximately 15%, in the center, it is approximately 10%, and it is down to less than 5% in the northeast. Intriguingly, its sister haplogroup I1a, exhibiting its highest frequency in Scandinavia (Figure 4A), shows the opposite trend to I1b by being more frequent among the easternmost Russian populations (Table 2) and equally so in Volga-Finnic Mordvin.7 This spread pattern overlaps with ancient routes from Scandinavia to the Volga Basin.
The remaining two haplogroups, J2 and E3b, exhibit spotty frequencies in Russians, expected for low-frequency haplogroups (Figures 4C and 4D; Table 2). The haplogroups might have arrived to Russia alongside I1b from the Balkans, in which the two are frequent.10
In summary, we detected considerable intraethnic differences in NRY haplogroup frequencies inside historic Russia. Four haplogroups (R1a, N3, N2, and I1b) exhibit clinal southwest-northeast variation patterns, whereas some other major haplogroups (I1a and R1b) demonstrate focal or mosaic distribution and are therefore less informative for revealing population relationships within the historical Russian area.
By combining maps of the frequent haplogroups, we created the first synthetic map of the regional Russian genetic variation. This map reveals simple and gradual north-to-south variation scenario in the Russian Y chromosome pool (Figure 5A). The first synthetic map correlates with haplogroups N3, I1b, and N2 (correlation coefficient is higher than 0.8), as well as with haplogroups E3b and R1a (correlation coefficient is higher than 0.4).
The synthetic maps approach (based on a correlation matrix among interpolated frequencies) for generalization of genetic data25,26 has been criticized27 because interpolated surfaces are more “smooth” than real distributions and therefore might easily correlate with each other, thus resulting in false correlations. So that these artifacts could be avoided, it is important27 to calculate principal components (PC) first from the raw data and to perform the interpolation in the second order. In our case, every population has been studied for all markers, and we were able to perform analysis in both the common way (interpolating and then calculating PC) and the way recommended by Sokal et al. in their critical paper27 (calculating PC and then interpolation). Obtained maps (Figures 5A and 5B) appeared to be almost identical—correlation coefficient between them is equal to 0.997. This finding shows that synthetic maps of Russian Y chromosomal data are not severely affected by such artifacts; similarly, we have revealed strong correlations between the two synthetic maps in cases of Adyges (unpublished data) and Russian28 surnames data. Because uniform coverage of the area might be important, we employed the “reliability maps” (Figure 2) that restrict calculation for areas well covered by the initial dataset.29
Although the patrilineally inherited haploid Y chromosome makes up only a small part of the human genome, it is worthwhile to stress here that the predominantly north-to-south clinal variation is in almost perfect agreement with the variation of autosomal markers, examined in the same area of historic Russia (Figure 5C). The correlation coefficient between synthetic maps of Y chromosomal and autosomal variation is equal to 0.71 (p > 0.95). Such congruence between Y chromosomal and classical markers suggests that latitudinal variation is the main pattern in the Russian gene pool, irrespective of the type of genetic system used.
The multidimensional-scaling plot (Figure 6) distinguishes central-southern Russian populations (genetically similar to each other) from northern Russian populations. Although northern populations are dispersed on the plot, AMOVA analysis supports such a distinguishing: If we define groups as shown in the Figure 6, then variation among groups (5.8%) is six times greater then within groups (1.5% only). There is a remarkable agreement between the multidimensional-scaling plot and the synthetic map of the Y chromosomal variation: All populations with negative values at the synthetic map (Figure 5A) are northern ones, whereas most of populations with positive values (except for Unzha population) form the central-southern cluster in the MDS plot (Figure 6).
Northern Russian populations show much greater NRY variation than those from the central-southern territories of the historic Russia (Figure 6). Meanwhile, the northern part of Russia is considerably less densely populated compared to the central and particularly to the southern areas. The effective population size in northern Russian populations is an order of magnitude less than that in the south.30,31 Therefore, genetic drift in northern populations could tentatively explain the observation.
However, comparing Russians with neighboring populations (Figure 7) reveals a second factor that affects the Russian genetic variation—assimilation of the substratum populations. Whereas the NRY variation of the central-southern Russian populations groups tightly together with other Slavonic-speaking populations (Figure 7), the northern Russians lie in the vicinity of the various Finnic-speaking groups.
This allows the inference that the variation among northern Russians is not caused by genetic drift alone, in which case northern Russians would have found their place around the main Russian cluster without a pronounced shift to one pole, but is more parsimoniously explained by a combination of significant admixture and perhaps by some degree of drift. It might be more appropriate even to suggest language shift in some ancestral populations, rather than an admixture scenario. It is common linguistic knowledge32 that in the northern Russian dialect, Finno-Ugric substratum is well pronounced. This substrate is present, although less so, in central dialect and only marginally detectable in southern dialect.
This scenario of admixture (or language change) in northern Russians is genetically highlighted by high frequencies of haplogroups N2 and N3. Within Europe, haplogroup N3 is frequent among Finnic-speaking groups (40% on average); its average frequency in Slavonic populations (except Russians) is 5% only, whereas its frequency in northern Russians is 35% (Table 2). Presence of haplogroup N2 in northernmost Russians might be best explained by gene flow from the Volga-Finnic people, among whom N2 is frequent and forms even a distinct European subcluster,21 whereas a few N2 chromosomes sampled in southern Russian populations (Table 4) fall to the Asian subcluster. Particular attention to the Russian North in the present study is also justified because the previous study on Russian Y chromosomal diversity underlined an absence of N2 haplogroup likely to be explained by constrained sampling.14,33
Table 4.
STR Haplotypes of the Russian N2 Lineages
| Sample Numbera | STR-Clusterb | DYS 19 | DYS 385a | DYS 385b | DYS 389I | DYS 389II | DYS 390 | DYS 391 | DYS 392 | DYS 393 | DYS 437 | DYS 438 | DYS 439 | DYS 448 | DYS 456 | DYS 458 | DYS 635 | H4 |
|---|---|---|---|---|---|---|---|---|---|---|---|---|---|---|---|---|---|---|
| Pinega 1 | N2-E | 13 | 11 | 12 | 13 | 31 | 23 | 10 | 12 | 13 | 14 | 10 | 10 | 18 | 15 | 17 | 24 | 12 |
| Pinega 2 | N2-E | 13 | 11 | 12 | 13 | 32 | 23 | 10 | 12 | 12 | 14 | 10 | 10 | 18 | 15 | 16 | 25 | 12 |
| Pinega 3 | N2-E | 13 | 11 | 12 | 13 | 31 | 24 | 10 | 12 | 13 | 14 | 10 | 10 | 18 | 15 | 18 | 24 | 12 |
| Pinega 4 | N2-E | 13 | 11 | 12 | 13 | 32 | 23 | 10 | 12 | 12 | 14 | 10 | 10 | 18 | 15 | 16 | 24 | 12 |
| Pinega 5 | N2-E | 13 | 11 | 12 | 13 | 32 | 23 | 10 | 12 | 12 | 14 | 10 | 10 | 18 | 15 | 16 | 24 | 12 |
| Pinega 6 | N2-E | 13 | 11 | 12 | 13 | 32 | 23 | 10 | 12 | 12 | 14 | 10 | 10 | 18 | 15 | 16 | 25 | 12 |
| Pinega 7 | N2-E | 13 | 11 | 12 | 13 | 32 | 23 | 10 | 12 | 12 | 14 | 10 | 10 | 18 | 15 | 16 | 25 | 12 |
| Pinega 8 | N2-E | 13 | 11 | 12 | 13 | 32 | 23 | 10 | 12 | 12 | 14 | 10 | 10 | 18 | 15 | 16 | 25 | 12 |
| Pinega 9 | N2-E | 13 | 11 | 12 | 13 | 31 | 24 | 10 | 12 | 13 | 14 | 10 | 10 | 18 | 15 | 17 | 24 | 12 |
| Pinega 10 | N2-E | 13 | 11 | 12 | 13 | 31 | 23 | 10 | 12 | 12 | 14 | 10 | 10 | 18 | 15 | 15 | 25 | 12 |
| Pinega 11 | N2-E | 13 | 11 | 12 | 13 | 32 | 23 | 10 | 12 | 12 | 14 | 10 | 10 | 18 | 15 | 16 | 25 | 12 |
| Pinega 12 | N2-E | 13 | 11 | 12 | 13 | 32 | 23 | 10 | 12 | 12 | 14 | 10 | 10 | 18 | 15 | 16 | 25 | 12 |
| Pinega 13 | N2-E | 13 | 11 | 12 | 13 | 34 | 23 | 10 | 12 | 12 | 14 | 10 | 10 | 18 | 15 | 16 | 25 | 12 |
| Pinega 14 | N2-E | 13 | 11 | 12 | 13 | 31 | 24 | 10 | 12 | 13 | 14 | 10 | 10 | 18 | 15 | 17 | 24 | 12 |
| Pinega 15 | N2-E | 13 | 11 | 12 | 13 | 32 | 23 | 10 | 12 | 12 | 14 | 10 | 10 | 18 | 15 | 16 | 25 | 12 |
| Mezen 1 | N2-E | 14 | 12 | 13 | 13 | 30 | 23 | 10 | 12 | 13 | 14 | 10 | 10 | 18 | 15 | 15 | 23 | 13 |
| Mezen 2 | N2-E | 13 | 12 | 12 | 13 | 31 | 23 | 10 | 12 | 13 | 14 | 10 | 10 | 19 | 15 | 16 | 24 | 12 |
| Mezen 3 | N2-E | 13 | 11 | 12 | 13 | 31 | 23 | 10 | 12 | 13 | 14 | 10 | 10 | 18 | 15 | 16 | 24 | 12 |
| Mezen 4 | N2-E | 13 | 11 | 12 | 13 | 31 | 23 | 11 | 12 | 13 | 14 | 10 | 10 | 18 | 15 | 16 | 22 | 12 |
| Krasnoborsk 1 | N2-E | 13 | 11 | 12 | 13 | 32 | 23 | 10 | 12 | 12 | 14 | 10 | 10 | 18 | 15 | 16 | 25 | 12 |
| Krasnoborsk 2 | N2-E | 13 | 11 | 12 | 13 | 32 | 23 | 10 | 12 | 12 | 14 | 10 | 10 | 18 | 15 | 16 | 25 | 12 |
| Krasnoborsk 3 | N2-E | 13 | 12 | 13 | 13 | 30 | 23 | 10 | 12 | 13 | 14 | 10 | 10 | 18 | 15 | 15 | 25 | 12 |
| Vologda 1 | N2-E | 14 | 11 | 12 | 13 | 31 | 23 | 10 | 12 | 12 | 14 | 10 | 10 | 18 | 15 | 16 | 23 | 12 |
| Vologda 2 | N2-E | 13 | 11 | 12 | 13 | 31 | 23 | 11 | 12 | 12 | 14 | 10 | 10 | 18 | 15 | 15 | 23 | 12 |
| Belgorod 1 | N2-A | 14 | 12 | 13 | 13 | 29 | 23 | 10 | 14 | 13 | 14 | 10 | 10 | 18 | 15 | 16 | 24 | 12 |
| Cossacs 1 | N2-A | 14 | 11 | 12 | 14 | 30 | 24 | 10 | 14 | 13 | 14 | 10 | 10 | 19 | 15 | 17 | 24 | 12 |
| Livni 1 | N2-A | 14 | 12 | 13 | 13 | 28 | 23 | 10 | 14 | 13 | 14 | 10 | 10 | 18 | 15 | 16 | 25 | 12 |
| Porhov 1 | N2-A | 14 | 12 | 14 | 13 | 29 | 24 | 10 | 14 | 13 | 14 | 10 | 10 | 18 | 15 | 16 | 24 | 12 |
For samples of N2 haplogroup, 17 STRs were studied with a Y-filer Kit (Applied Biosystems). PCR products were analyzed on ABI 3100Avant genetic analyzer (Applied Biosystems) in the mode of standard fragment analysis protocol. GeneScan 500LIZ size standard (Applied Biosystems) was added to each sample for size scaling, and program GeneMapper 4.0 was employed for allele scoring. Alleles were designated by repeat numbers.
The STR haplotypes were attributed to European or Asian cluster of N2 haplogroup as described in.21
The presence of hg N21–23 (shared by many East European and Northeast Asian populations) in Russians is in contrast with the very limited and spotty presence of other typically East Asian NRY variants, such as Q and C in the Russian Y chromosomal pool (Table 2). In this sense, our results, encompassing the historical Russian area, are in a good agreement with the earlier results on central-southern Russians.14 More generally, it appears that there has been only limited general east-to-west flow of Y chromosomes alongside the steppe belt over long prehistoric and historic times, possibly even since the peopling of the temperate zone of Eurasia by anatomically modern humans. That leaves hg N which probably reached East Europe already around the beginning of Holocene39 the only prominent Y chromosomal “common denominator” for the North-East Asian and East European paternal heritage.21 There is no obvious matrilineal (mtDNA) counterpart to the patrilineal hg N.
From the south, the East European steppe belt is flanked by the Caspian and Black Seas and by the Caucasus. Recent detailed comparison of mtDNA hg H lineages in Europe34,35 and in the Caucasus and the Near and Middle East36 revealed significant difference between the East European (Ukraine and Russia) and Caucasus mtDNA variation patterns. Very low frequency of NRY hgs G and J among ethnic Russians (Table 2), otherwise characteristic and highly frequent among the Caucasus people, in which the two haplogroups make up approximately a half of Y chromosomes (37 and our unpublished data), strongly suggests that patrilineal gene flow from the Caucasus not only to the historic Russian areas but also to the gene pool of the nearby Kuban Cossacs has been equally limited.
Not surprisingly, Belorussians and Ukrainians who, together with Russians, form the eastern branch of Slavic language speakers show also the closest similarity with the central-southern Russian paternal heritage (Figures 7 and 8), whereas the NRY variation among Poles lies, in the MSD plot, in their immediate vicinity. This closeness in the patterns of variation of the respective Y chromosomes allows speculation that unlike in the (later colonized) Russian North, the eastward wave of Slavs from their putative homeland to the present day Central Russia approximately 1000 years ago (Figure 1), did not involve extensive assimilation of local populations, at least with populations, markedly different in their paternal lineage variation. But the result can be interpreted also differently—it lends credence to those theories, which suggest that early Common Era Zarubintsy and Chernyakhov cultures, extending from the upper-central basins of Prut to Don, used already Slavonic languages—i.e., Slavic-speaking tribes were present in a considerable part of the later southern-central part of the historic Russia considerably earlier than better-documented Slavic migrations in approximately the 6th–9th centuries. It could then explain why there is a remarkable patrilineal continuity within West and East Slavonic-language speaking populations, although there are still signs of some admixture of the central-southern Russians with Finnic-speaking (or Baltic-speaking) populations, testified by NRY hg N. There is also an alternative explanation: Time depth of R1a (e.g.,4) might well be considerably older than separation of Indo-Iranian and Slavonic languages (and their speakers) from common Indo-European source,38 and the shared Y chromosomal ancestry might therefore antedate their linguistic differentiation.
Somewhat geographically more distant southern Slavs and Germanic speakers (Figure 7) differ already considerably from Russians in frequencies of practically all Y chromosome haplogroups, particularly I1b, R1b, lack of R1a, and N.
Despite that somewhat limited number of comparable studies is available in literature, we wish to emphasize some general aspects of the intrapopulation versus interpopulation variation of Y chromosomes in the European context.
Table 3 summarizes data on Y chromosomal intraethnic variation among Russians and compares them with other ethnicities of Europe. The highest variation among subpopulations is found for Finns, Croatians, Russians, and Italians (GST value between 0.04 and 0.08); Swedes and Germans demonstrate moderate variation; other ethnic groups (Greeks, Turks, Poles, Belorussians, and Ukrainians) exhibit similar and lower level of regional variation (GST value approximately 0.01). Results of the AMOVA and GST analysis (Table 3) reveal in Europe the presence of prominent interethnic differences that are more evident than the commonly more pronounced intraethnic genetic variation: The variation among ethnic groups (16.6 AMOVA; 14.9 GST) is markedly greater than that within groups (2.7 AMOVA; 2.9 GST). One might suppose that Y chromosomal variation in Europe is deeply structured by ethnic (mainly linguistic) boundaries, although differences among populations within an ethnic group could be also significant, as it was shown for Russians (Figure 5) and for Finns.39
Illustrating the results of GST/AMOVA analyses, a MDS plot (Figure 8) reveals a surprisingly consistent pattern: In all cases, subpopulations within an ethnic group cluster together, revealing only minor overlaps between the defined by language ethnic clusters.
Yet, there is one significant exception: The three Slavic-speaking populations in this plot—Poles, Russians, and Ukrainians—cluster together, strongly supporting their common genetic (Y chromosomal) origin, consistent with their linguistic proximity. Noteworthy is the fact that the northern Russian subpopulations (R1–R4 in Figure 8) lie apart from, or are placed at the edge of, this cluster. It has been emphasized earlier that Y chromosomal diversity in Europe is influenced primarily by geography, rather than by language.5 Unexpectedly, East and West Slavonic populations exhibit predominantly common Y chromosomal pool (Figures 3A and 8), although their geographic area spans from the center of Europe to its eastern border—a span approximately half the distance from Atlantic to the Urals. In that way, the genetic homogeneity covers a half of the continental Europe within one language group—a finding that is opposite to the scenario of predominating geography. Although results presented here are not sufficient to question the generalization done by Rosser et al.,5 we wish to indicate that more locally, intraethnic variation does overlap between geographically distant but linguistically close populations as exemplified here by the three largest Slavonic-speaking groups.
The extensive analysis of the Russian pool of paternal lineages presented here establishes the following general features: (1) insignificance of the oriental gene flow, highlighted by the lack of typical East and Central Asian haplogroups; (2) well-pronounced north-to-south gradients of specific haplogroups within historical Russian area; (3) split of its overall diversity into the northern and central-southern populations; (4) close proximity of the northern populations to the northeastern and eastern non-Slavic populations, suggesting extensive assimilation or even direct language change; (5) lower Y chromosomal variation all over the central-southern historic Russia versus high variation among northern Russians; (6) close proximity, reaching virtual overlap in a MDS plot, in the Y chromosomal variation between central-southern Russians with Ukrainians, Belorussians, and Poles; and (7) this significant intraethnic differentiation of North Russian populations is the only found exception to the rule; in the wider European context, the interethnic (mainly linguistic) differences strongly predominate.
We conclude that the Y chromosome pool of Russians in their historic settlement area is predominantly a composite of their proto-Slavic heritage and, in particular in the Russian North, of extensive admixture with Finno-Ugric speakers. This bipartite scenario for the main sources of the origin of the present-day ethnic Russians is supported by analysis presented here of classical markers and can be used as a working hypothesis for better understanding of genetic diversity and demographic history of Eurasian populations. Its patrilineal aspect can be further refined by a detailed study of STR variation within phylogenetically defined biallelic haplogroups, although for more profound progress, new informative SNPs should be identified, in particular bearing in mind that so far only a minor fraction of the Y chromosome has been explored for markers potentially informative for phylogeographic studies.3
Acknowledgments
We thank people from the rural Russian areas who provided their DNA for the present analysis. This work was supported by the Russian Foundation of Basic Research (grants 04-04-49664 and 07-04-00340 to O.B. and 07-06-00086 to A.P.), Russian Fund of Humanities (grants 07-01-12114 and 07-06-00448 to E.B.) and by Estonian Science Foundation grant No. 6040 (to Kristiina Tambets) and grant SF 0182474As03 (to R.V.).
Web Resources
The URLs for data presented herein are as follows:
GeoSynchrony, www.ostu.ru/personal/nikolaev
Passage Software, www.passagesoftware.net
The Russian Gene Pool Databank, www.genofond.ru
References
- 1.Y Chromosome Consortium A nomenclature system for the tree of human Y-chromosomal binary haplogroups. Genome Res. 2002;12:339–348. doi: 10.1101/gr.217602. [DOI] [PMC free article] [PubMed] [Google Scholar]
- 2.Jobling M.A., Tyler-Smith C. The human Y chromosome: An evolutionary marker comes of age. Nat. Rev. Genet. 2003;4:598–612. doi: 10.1038/nrg1124. [DOI] [PubMed] [Google Scholar]
- 3.Underhill P.A., Kivisild T. Use of Y chromosome and mitochondrial DNA population structure in tracing human migrations. Annu. Rev. Genet. 2007;41:539–564. doi: 10.1146/annurev.genet.41.110306.130407. [DOI] [PubMed] [Google Scholar]
- 4.Semino O., Passarino G., Oefner P.J., Lin A.A., Arbuzova S., Beckman L.E., De Benedictis G., Francalacci P., Kouvatsi A., Limborska S. The genetic legacy of Paleolithic Homo sapiens sapiens in extant Europeans: A Y chromosome perspective. Science. 2000;290:1155–1159. doi: 10.1126/science.290.5494.1155. [DOI] [PubMed] [Google Scholar]
- 5.Rosser Z.H., Zerjal T., Hurles M.E., Adojaan M., Alavantic D., Amorim A., Amos W., Armenteros M., Arroyo E., Barbujani G. Y-chromosomal diversity in Europe is clinal and influenced primarily by geography, rather than by language. Am. J. Hum. Genet. 2000;67:1526–1543. doi: 10.1086/316890. [DOI] [PMC free article] [PubMed] [Google Scholar]
- 6.Tambets K., Rootsi S., Kivisild T., Help H., Serk P., Loogväli E.-L., Tolk H.-V., Reidla M., Metspalu E., Pliss L. The western and eastern roots of the Saami - the story of genetic “outliers” told by mtDNA and Y-chromosome. Am. J. Hum. Genet. 2004;74:661–682. doi: 10.1086/383203. [DOI] [PMC free article] [PubMed] [Google Scholar]
- 7.Rootsi S., Magri C., Kivisild T., Benuzzi G., Help H., Bermisheva M., Kutuev I., Barać L., Peričić M., Balanovsky O. Phylogeography of Y-chromosome haplogroup I reveals distinct domains of prehistoric gene flow in Europe. Am. J. Hum. Genet. 2004;75:128–137. doi: 10.1086/422196. [DOI] [PMC free article] [PubMed] [Google Scholar]
- 8.Semino O., Magri C., Benuzzi G., Lin A.A., Al-Zahery N., Battaglia V., Maccioni L., Triantaphyllidis C., Shen P., Oefner P.J. Origin, diffusion, and differentiation of Y-chromosome haplogroups E and J: Inferences on the neolithization of Europe and later migratory events in the Mediterranean area. Am. J. Hum. Genet. 2004;74:1023–1034. doi: 10.1086/386295. [DOI] [PMC free article] [PubMed] [Google Scholar]
- 9.Di Giacomo F., Luca F., Popa L.O., Akar N., Anagnou N., Banyko J., Brdicka R., Barbujani G., Papola F., Ciavarella G. Y chromosomal haplogroup J as a signature of the post-neolithic colonization of Europe. Hum. Genet. 2004;115:357–371. doi: 10.1007/s00439-004-1168-9. [DOI] [PubMed] [Google Scholar]
- 10.Peričić M., Lauc L.B., Klaric I.M., Rootsi S., Janicievic B., Rudan I., Terciz R., Rudan P. High-resolution phylogenetic analysis of southeastern Europe traces major episodes of paternal gene flow among slavic populations. Mol. Biol. Evol. 2005;10:1964–1975. doi: 10.1093/molbev/msi185. [DOI] [PubMed] [Google Scholar]
- 11.Race E., Genetics Working Group The use of racial, ethnic, and ancestral categories in human genetics research. Am. J. Hum. Genet. 2005;77:519–532. doi: 10.1086/491747. [DOI] [PMC free article] [PubMed] [Google Scholar]
- 12.Kayser M., Lao O., Anslinger K., Augustin C., Bargel G., Edelmann J., Elias S., Heinrich M., Henke J., Henke L. Significant genetic differentiation between Poland and Germany follows present-day political borders, as revealed by Y-chromosome analysis. Hum. Genet. 2005;117:428–443. doi: 10.1007/s00439-005-1333-9. [DOI] [PubMed] [Google Scholar]
- 13.Cinnioğlu C., King R., Kivisild T., Kalfoğlu E., Atasoy S., Cavalleri G.L., Lillie A.S., Roseman C.C., Lin A.A., Prince K. Excavating Y-chromosome haplotype strata in Anatolia. Hum. Genet. 2004;114:127–148. doi: 10.1007/s00439-003-1031-4. [DOI] [PubMed] [Google Scholar]
- 14.Malyarchuk B., Derenko M., Grzybowski T., Lunkina A., Czarny J., Rychkov S., Morozova I., Denisova G., Miscicka-Sliwka D. Differentiation of mitochondrial DNA and Y chromosomes in Russian populations. Hum. Biol. 2004;76:877–900. doi: 10.1353/hub.2005.0021. [DOI] [PubMed] [Google Scholar]
- 15.Karlsson A.O., Wallerstrom T., Gotherstrom A., Holmlund G. Y-chromosome diversity in Sweden - A long-time perspective. Eur. J. Hum. Genet. 2006;14:963–970. doi: 10.1038/sj.ejhg.5201651. [DOI] [PubMed] [Google Scholar]
- 16.Luca F., Di Giacomo F., Benincasa T., Popa L.O., Banyko J., Kracmarova A., Malaspina P., Novelletto A., Brdicka R. Y-chromosomal variation in the Czech Republic. Am. J. Phys. Anthropol. 2007;132:132–139. doi: 10.1002/ajpa.20500. [DOI] [PubMed] [Google Scholar]
- 17.Kasperaviciute D., Kucinskas V., Stoneking M. Y chromosome and mitochondrial DNA variation in Lithuanians. Ann. Hum. Genet. 2004;68:438–452. doi: 10.1046/j.1529-8817.2003.00119.x. [DOI] [PubMed] [Google Scholar]
- 18.Dolukhanov P.M. “Prehistoric revolutions” and languages in Europe. In: Künnap A., editor. The roots of peoples and languages of Northern Eurasia II and III. University of Tartu; Tartu: 2000. pp. 71–78. [Google Scholar]
- 19.Anikovich M.V., Sinitsyn A.A., Hoffecker J.F., Holliday V.T., Popov V.V., Lisitsyn S.N., Forman S.L., Levkovskaya G.M., Pospelova G.A., Kuzmina I.E. Early Upper Paleolithic in Eastern Europe and implications for the dispersal of modern humans. Science. 2007;315:223–226. doi: 10.1126/science.1133376. [DOI] [PubMed] [Google Scholar]
- 20.Barac L., Pericic M., Klaric I.M., Rootsi S., Janicijevic B., Kivisild T., Parik J., Rudan I., Villems R., Rudan P. Y chromosomal heritage of Croatian population and its island isolates. Eur. J. Hum. Genet. 2003;11:535–542. doi: 10.1038/sj.ejhg.5200992. [DOI] [PubMed] [Google Scholar]
- 21.Rootsi S., Zhivotovsky L.A., Baldovic M., Kayser M., Kutuev I., Khusnutdinova E.K., Voevoda M.I., Osipova L.P., Stoneking M., Ferak V. A counter-clockwise northern route of the Y-chromosome haplogroup N from Southeast Asia towards Europe. Eur. J. Hum. Genet. 2007;15:204–211. doi: 10.1038/sj.ejhg.5201748. [DOI] [PubMed] [Google Scholar]
- 22.Zerjal T., Dashnyam B., Pandya A., Kayser M., Roewer L., Santos F.R., Schiefenhövel W., Fretwell N., Jobling M.A., Harihara S. Genetic relationships of Asians and Northern Europeans, revealed by Y- chromosomal DNA analysis. Am. J. Hum. Genet. 1997;60:1174–1183. [PMC free article] [PubMed] [Google Scholar]
- 23.Karafet T.M., Osipova L.P., Gubina M.A., Posukh O.L., Zegura S.L., Hammer M.F. High levels of Y-chromosome differentiation among native Siberian populations and the genetic signature of a boreal hunter-gatherer way of life. Hum. Biol. 2002;74:761–789. doi: 10.1353/hub.2003.0006. [DOI] [PubMed] [Google Scholar]
- 24.Karafet T., Xu L., Du R., Wang W., Feng S., Wells R.S., Redd A.J., Zegura S.L., Hammer M.F. Paternal population history of East Asia: Sources, patterns, and microevolutionary processes. Am. J. Hum. Genet. 2001;69:615–628. doi: 10.1086/323299. [DOI] [PMC free article] [PubMed] [Google Scholar]
- 25.Cavalli-Sforza L.L., Menozzi P., Piazza A. Princeton University Press; Princeton: 1994. The History and Geography of Human Genes. [Google Scholar]
- 26.Rychkov Yu., Balanovskaia E. Gene pool and gene geography of the USSR population. Genetika. 1992;28:52–75. [PubMed] [Google Scholar]
- 27.Sokal R.R., Oden N.L., Thomson B.A. A problem with synthetic maps. Hum. Biol. 1999;71:1–13. [PubMed] [Google Scholar]
- 28.Balanovsky O.P., Buzhilova A.P., Balanovska E.V. Russian gene pool. Gene geography of surnames. Genetika. 2001;37:974–990. [Google Scholar]
- 29.Nurbaev S.D., Balanovskaia E.V. Computer technology for geno geographic study of the gene pool. V. Evaluation of the reliability of maps. Genetika. 1998;34:825–838. [PubMed] [Google Scholar]
- 30.Revazov A.A., Kazachenko B.N., Tarlycheva L.V., Philippov I.K. Population genetics in the North of European Russia. 3: Demographical and genetic features of the two rural administrations of the Pinega district of the Arkhangel region. Genetika. 1979;15:917. [Google Scholar]
- 31.Ginter E.K., editor. Medical genetics of the Adygeya population. Maykop; 1997. p. 225. [Google Scholar]
- 32.Wiik, K. (2002). Eurooppalaisten juuret. Atenakustannus Oy, Jyväskylä 2002.
- 33.Wells R.S., Yuldasheva N., Ruzibakiev R., Underhill P.A., Evseeva I., Blue-Smith J., Jin L., Su B., Pitchappan R., Shanmugalakshmi S. The Eurasian heartland: A continental perspective on Y-chromosome diversity. Proc. Natl. Acad. Sci. USA. 2001;98:10244–10249. doi: 10.1073/pnas.171305098. [DOI] [PMC free article] [PubMed] [Google Scholar]
- 34.Loogvali E.L., Roostalu U., Malyarchuk B.A., Derenko M.V., Kivisild T., Metspalu E., Tambets K., Reidla M., Tolk H.V., Parik J. Disuniting uniformity: A pied cladistic canvas of mtDNA haplogroup H in Eurasia. Mol. Biol. Evol. 2004;21:2012–2021. doi: 10.1093/molbev/msh209. [DOI] [PubMed] [Google Scholar]
- 35.Achilli A., Rengo C., Magri C., Battaglia V., Olivieri A., Scozzari R., Cruciani F., Zeviani M., Briem E., Carelli V. The molecular dissection of mtDNA haplogroup H confirms that the Franco-Cantabrian glacial refuge was a major source for the European gene pool. Am. J. Hum. Genet. 2004;75:910–918. doi: 10.1086/425590. [DOI] [PMC free article] [PubMed] [Google Scholar]
- 36.Roostalu U., Kutuev I., Loogvali E.L., Metspalu E., Tambets K., Reidla M., Khusnutdinova E.K., Usanga E., Kivisild T., Villems R. Origin and expansion of haplogroup H, the dominant human mitochondrial DNA lineage in West Eurasia: The Near Eastern and Caucasian perspective. Mol. Biol. Evol. 2006;24:436–448. doi: 10.1093/molbev/msl173. [DOI] [PubMed] [Google Scholar]
- 37.Nasidze I., Ling E.Y., Quinque D., Dupanloup I., Cordaux R., Rychkov S., Naumova O., Zhukova O., Sarraf-Zadegan N., Naderi G.A. Mitochondrial DNA and Y-chromosome variation in the caucasus. Ann. Hum. Genet. 2004;68:205–221. doi: 10.1046/j.1529-8817.2004.00092.x. [DOI] [PubMed] [Google Scholar]
- 38.Gray R.D., Atkinson Q.D. Language-tree divergence times support the Anatolian theory of Indo-European origin. Nature. 2003;426:435–439. doi: 10.1038/nature02029. [DOI] [PubMed] [Google Scholar]
- 39.Lappalainen T., Koivumäki S., Salmela E., Huoponen K., Sistonen P., Savontaus M.L., Lahermo P. Regional differences among the Finns: A Y-chromosomal perspective. Gene. 2006;376:207–215. doi: 10.1016/j.gene.2006.03.004. [DOI] [PubMed] [Google Scholar]
- 40.Rosenberg M.S. Department of Biology, Arizona State University. PASSAGE; Tempe, AZ: 2001. Pattern Analysis, Spatial Statistics, and Geographic Exegesis. Version 1.1. [Google Scholar]
- 41.Behar D.M., Thomas M.G., Skorecki K., Hammer M.F., Bulygina E., Rosengarten D., Jones A.L., Held K., Moses V., Goldstein D. Multiple origins of Ashkenazi Levites: Y chromosome evidence for both Near Eastern and European ancestries. Am. J. Hum. Genet. 2003;73:768–779. doi: 10.1086/378506. [DOI] [PMC free article] [PubMed] [Google Scholar]
- 42.Bosch E., Calafell F., González-Neira A., Flaiz C., Mateu E., Scheil H.G., Huckenbeck W., Efremovska L., Mikerezi I., Xirotiris N. Paternal and maternal lineages in the Balkans show a homogeneous landscape over linguistic barriers, except for the isolated Aromuns. Ann. Hum. Genet. 2006;70:459–487. doi: 10.1111/j.1469-1809.2005.00251.x. [DOI] [PubMed] [Google Scholar]
- 43.Brion M., Dupuy B.M., Heinrich M., Hohoff C., Hoste B., Ludes B., Mevag B., Morling N., Niederstätter H., Parson W. A collaborative study of the EDNAP group regarding Y-chromosome binary polymorphism analysis. Forensic Sci. Int. 2005;153:103–108. doi: 10.1016/j.forsciint.2005.06.002. [DOI] [PubMed] [Google Scholar]
- 44.Cruciani F., Santolamazza P., Shen P., Macaulay V., Moral P., Olckers A., Modiano D., Holmes S., Destro-Bisol G., Coia V. A back migration from Asia to sub-Saharan Africa is supported by high-resolution analysis of human Y-chromosome haplotypes. Am. J. Hum. Genet. 2002;70:1197–1214. doi: 10.1086/340257. [DOI] [PMC free article] [PubMed] [Google Scholar]
- 45.Derenko M., Malyarchuk B., Denisova G.A., Wozniak M., Dambueva I., Dorzhu C., Luzina F., Miscicka-Sliwka D., Zakharov I. Contrasting patterns of Y-chromosome variation in South Siberian populations from Baikal and Altai-Sayan regions. Hum. Genet. 2006;118:591–604. doi: 10.1007/s00439-005-0076-y. [DOI] [PubMed] [Google Scholar]
- 46.Di Giacomo F., Luca F., Anagnou N., Ciavarella G., Corbo R.M., Cresta M., Cucci F., Di Stasi L., Agostiano V., Giparaki M. Clinal patterns of human Y chromosomal diversity in continental Italy and Greece are dominated by drift and founder effects. Mol. Phylogenet. Evol. 2003;28:387–395. doi: 10.1016/s1055-7903(03)00016-2. [DOI] [PubMed] [Google Scholar]
- 47.Kharkov, V.N. (2005). Structure of Y-chromosomal lineages in Siberian populations. PhD thesis (in Russian). Research Institute of Medical Genetics at the Tomsk Scientific Center, Siberian Division of Russian Academy of Medical Sciences, Tomsk.
- 48.Laitinen V., Lahermo P., Sistonen P., Savontaus M.L. Y-chromosomal diversity suggests that Baltic males share common Finno-Ugric-speaking forefathers. Hum. Hered. 2002;53:68–78. doi: 10.1159/000057985. [DOI] [PubMed] [Google Scholar]
- 49.Marjanovic D., Fornarino S., Montagna S., Primorac D., Hadziselimovic R., Vidovic S., Pojskic N., Battaglia V., Achilli A., Drobnic K. The peopling of modern Bosnia-Herzegovina: Y-chromosome haplogroups in the three main ethnic groups. Ann. Hum. Genet. 2005;69:757–763. doi: 10.1111/j.1529-8817.2005.00190.x. [DOI] [PubMed] [Google Scholar]
- 50.Nasidze I., Quinque D., Dupanloup I., Rychkov S., Naumova O., Zhukova O., Stoneking M. Genetic evidence concerning the origins of South and North Ossetians. Ann. Hum. Genet. 2004;68:588–599. doi: 10.1046/j.1529-8817.2004.00131.x. [DOI] [PubMed] [Google Scholar]
- 51.Nasidze I., Quinque D., Dupanloup I., Cordaux R., Kokshunova L., Stoneking M. Genetic evidence for the Mongolian ancestry of Kalmyks. Am. J. Phys. Anthropol. 2005;128:846–854. doi: 10.1002/ajpa.20159. [DOI] [PubMed] [Google Scholar]
- 52.Nasidze I., Quinque D., Rahmani M., Alemohamad S.A., Stoneking M. Concomitant replacement of language and mtDNA in South Caspian populations of Iran. Curr. Biol. 2006;16:668–673. doi: 10.1016/j.cub.2006.02.021. [DOI] [PubMed] [Google Scholar]
- 53.Passarino G., Cavalleri G.L., Lin A.A., Cavalli-Sforza L.L., Børresen-Dale A.L., Underhill P.A. Different genetic components in the Norwegian population revealed by the analysis of mtDNA and Y chromosome polymorphisms. Eur. J. Hum. Genet. 2002;10:521–529. doi: 10.1038/sj.ejhg.5200834. [DOI] [PubMed] [Google Scholar]
- 54.Regueiro M., Cadenas A.M., Gayden T., Underhill P.A., Herrera R.J. Iran: Tricontinental nexus for Y-chromosome driven migration. Hum. Hered. 2006;61:132–143. doi: 10.1159/000093774. [DOI] [PubMed] [Google Scholar]
- 55.Underhill P.A., Myers N.M., Rootsi S., Chow C.E.T, Lin A.A., Otillar R., King R., Zhivotovsky L.A., Balanovsky O., Pshenichnov A. Rethinking the human revolution: New Behavioural & Biological Perspectives on the Origins and Dispersal of Modern Humans. Cambridge University, McDonald Institute for Arhaeological Research Monographs; 2008. New phylogenetic relationship for Y chromosome haplogroup I: Reapprising its phylogeography and prehistory. [Google Scholar]
- 56.Balanovskaia E.V., Nurbaev S.D., Rychkov Iu G. Computer technology of the genogeographic study of the gene pool. I. Statistical information from the genogeographic map. Genetika. 1994;30:951–965. [PubMed] [Google Scholar]
- 57.Balanovskaia E.V., Balanovskiĭ O.P., Spitsyn V.A., Bychkovskaia L.S., Makarov S.V., Paĭ G.V., Rusakov A.E., Subbota D.S. The Russian gene pool. Genogeography of serum genetic markers (HP, GC, PI, TF) Genetika. 2001;37:1125–1137. [PubMed] [Google Scholar]
- 58.Casanova M., Leroy P., Boucekkine C., Weissenbach J., Bishop C., Fellous M., Purrello M., Fiori G., Siniscalco M. A human Y-linked DNA polymorphism and its potential for estimating genetic and evolutionary distance. Science. 1985;230:1403–1406. doi: 10.1126/science.2999986. [DOI] [PubMed] [Google Scholar]
- 59.Hammer M.F., Horai S. Y chromosomal DNA variation and the peopling of Japan. Am. J. Hum. Genet. 1995;56:951–962. [PMC free article] [PubMed] [Google Scholar]
- 60.Raitio M., Lindroos K., Laukkanen M., Pastinen T., Sistonen P., Sajantila A., Syvänen A.C. Y-chromosomal SNPs in Finno-Ugric-speaking populations analyzed by minisequencing on microarrays. Genome Res. 2001;11:471–482. doi: 10.1101/gr.156301. [DOI] [PMC free article] [PubMed] [Google Scholar]
- 61.Whitfield L.S., Sulston J.E., Goodfellow P.N. Sequence variation of the human Y chromosome. Nature. 1995;378:379–380. doi: 10.1038/378379a0. [DOI] [PubMed] [Google Scholar]
- 62.Mathias N., Bayes M., Tyler-Smith C. Highly informative compound haplotypes for the human Y chromosome. Hum. Mol. Genet. 1994;3:115–123. doi: 10.1093/hmg/3.1.115. [DOI] [PubMed] [Google Scholar]
- 63.Ye J., Parra E.J., Sosnoski D.M., Hiester K., Underhill P.A., Shriver M.D. Melting curve SNP (McSNP) genotyping: A useful approach for diallelic genotyping in forensic science. J. Forensic Sci. 2002;47:593–600. [PubMed] [Google Scholar]
- 64.Akey J.M., Sosnoski D., Parra E., Dios S., Hiester K., Su B., Bonilla C., Jin L., Shriver M.D. Melting curve analysis of SNPs (McSNP): A gel-free and inexpensive approach for SNP genotyping. Biotechniques. 2001;30:358–367. doi: 10.2144/01302tt05. [DOI] [PubMed] [Google Scholar]
- 65.Underhill P.A., Passarino G., Lin A.A., Shen P., Mirazon Lahr M., Foley R.A., Oefner P.J., Cavalli-Sforza L.L. The phylogeography of Y chromosome binary haplotypes and the origins of modern human populations. Ann. Hum. Genet. 2001;65:43–62. doi: 10.1046/j.1469-1809.2001.6510043.x. [DOI] [PubMed] [Google Scholar]
- 66.Hammer M.F., Redd A.J., Wood E.T., Bonner M.R., Jarjanazi H., Karafet T., Santachiara-Benerecetti S., Oppenheim A., Jobling M.A., Jenkins T. Jewish and Middle Eastern non-Jewish populations share a common pool of Y-chromosome biallelic haplotypes. Proc. Natl. Acad. Sci. USA. 2000;97:6769–6774. doi: 10.1073/pnas.100115997. [DOI] [PMC free article] [PubMed] [Google Scholar]
- 67.Balanovska, E. (1998). New technologies for studying the spatial structure of a gene pool. D.Sci dissertation, Research Centre for Medical Genetics, Moscow.
- 68.Nei M. Genetic distance between populations. Am. Nat. 1972;106:283–292. [Google Scholar]
- 69.Nei M. Analysis of gene diversity in subdivided populations. Proc. Natl. Acad. Sci. USA. 1973;70:3321–3323. doi: 10.1073/pnas.70.12.3321. [DOI] [PMC free article] [PubMed] [Google Scholar]