

Summary
Many common diseases are accompanied by disturbances in biochemical traits. Identifying the genetic determinants could provide novel insights into disease mechanisms and reveal avenues for developing new therapies. Here, we report a genome-wide association analysis for commonly measured serum and urine biochemical traits. As part of the WTCCC, 500,000 SNPs genome wide were genotyped in 1955 hypertensive individuals characterized for 25 serum and urine biochemical traits. For each trait, we assessed association with individual SNPs, adjusting for age, sex, and BMI. Lipid measurements were further examined in a meta-analysis of genome-wide data from a type 2 diabetes scan. The most promising associations were examined in two epidemiological cohorts. We discovered association between serum urate and SLC2A9, a glucose transporter (p = 2 × 10⁻¹⁵) and confirmed this in two independent cohorts, GRAPHIC study (p = 9 × 10⁻¹⁵) and TwinsUK (p = 8 × 10⁻¹⁹). The odds ratio for hyperuricaemia (defined as urate >0.4 mMol/l) is 1.89 (95% CI = 1.36–2.61) per copy of common allele. We also replicated many genes previously associated with serum lipids and found previously recognized association between LDL levels and SNPs close to genes encoding PSRC1 and CELSR2 (p = 1 × 10⁻⁷). The common allele was associated with a 6% increase in nonfasting serum LDL. This region showed increased association in the meta-analysis (p = 4 × 10⁻¹⁴). This finding provides a potential biological mechanism for the recent association of this same allele of the same SNP with increased risk of coronary disease.
Introduction
Serum and urine biochemistry measurements are used routinely in daily clinical practice to define comorbid traits such as dyslipidaemia or as biomarkers of target organ damage (e.g., urea, creatinine, and renal function). Many of these traits have been shown to be under tighter genetic control than their related diseases.1 By analyzing such heritable quantitative traits, genome-wide association scans (GWASs) could enable us to discover unexpected genetic factors or pathways for common quantitative traits and diseases.2,3 This approach is very similar to early epidemiological surveys that detected associations of common cardiovascular risk factors, e.g., cholesterol and coronary disease (MIM 607339).4 Our hypothesis is that genetic variation might influence the inheritance of commonly measured biochemical traits, which might in some instances, serve as risk factors for common diseases or associated complications.
In this study, we performed genome-wide quantitative trait analyses of 25 commonly assessed biochemical variables from concomitant serum and urine samples from hypertensive (essential hypertension [MIM 145500]) individuals from the MRC British Genetics of Hypertension (BRIGHT) study.3 We also took the opportunity to combine our lipid data with comparable data from a contemporary diabetes GWAS5 by using meta-analysis. This approach offers the chance to identify genetic determinants of biochemical profiles that might extend across the population and in turn could lead to disease-causing pathways and therapeutic avenues.
Subjects and Methods
Study Subjects and Measurement of Covariates
Ascertainment of hypertensive individuals recruited for the BRIGHT study and methods used for biochemical and urinary analyses are described in detail elsewhere.6 In brief, white European patients were recruited if they had blood pressure readings >145/95 (mean of three seated readings) or >150/100 (single reading). Patients with diabetes (MIM 222100, MIM 125853), intrinsic renal disease, secondary hypertension, extreme obesity (body mass index, BMI >35 [MIM 601665]), or other coexisting illness were excluded. A subset of 2000 unrelated hypertensives were chosen for inclusion in the Wellcome Trust Case Control Consortium (WTCCC) study;3 these were selected on the basis of current residence for maximization of geographical coverage across Great Britain. Serum-biochemistry measures were done on nonfasting samples, and only individuals with complete 24 hr urine collections were included; all measurements were performed by the Clinical Biochemistry Unit at the University of Glasgow, and normal ranges are those given from this unit. Derived biochemistry measures were calculated with standard formulae, including low-density lipoprotein (LDL) cholesterol,7 glomerular filtration rate (GFR),8 and corrected calcium, an estimate of ionized calcium.9
We used two independent resources for replication. The first was composed of 2033 individuals (1028 men and 1005 women) from 519 families from the GRAPHIC study, a population based sample broadly representative of the UK White European population; all had serum-urate measurements available.10 The second was composed of 1461 healthy female twin individuals of European descent, ascertained from the TwinsUK registry (see Web Resources) at St Thomas' Hospital, London,11 and shown to be representative of the UK population.12 TwinsUK subjects have been genotyped on the Illumina 317k chip, and this enabled us to select proxy single-nucleotide polymorphism (SNPs) in strong LD with our primary associated SNPs for replication. Both dizygotic twin (DZ) individuals were included, and one individual, randomly selected from the monozygotic twins (MZ), although the average of both phenotypic traits was used in analysis. Both fasting serum-urate and LDL levels were available from this cohort. Ethics committee approval was previously obtained for all cohorts, and all participants gave informed written consent.
Genotyping and Quality Control
The WTCCC genotyped SNPs on the Affymetrix 500K GeneChip in 2000 BRIGHT subjects3. We followed WTCCC thresholds for quality control; in brief, individuals were excluded if they had >3% missing data or evidence of non-European ancestry under eigenstrat analysis. SNPs were excluded if they showed deviation from Hardy Weinberg equilibrium (p < 5 × 10⁻⁷), high levels of missing data (capture rate < 95%), or low minor allele frequency (<1%). Cluster plots were manually examined for any SNP showing p < 10−5 within BRIGHT subjects or the meta-analysis. Only associations with SNPs that displayed clearly defined nonoverlapping clusters are reported. Genotyping for the TwinsUK resource was performed with the Illumina Human Hap 317 chip by the Wellcome Trust Sanger Institute. Genotyping for the GRAPHIC study was performed with the Taqman assay (Applied Biosystems) and was followed by allelic discrimination with the ABI PRISM 7900HT Sequence Detection System and software (SDSv2.0, Applied Biosystems).
Statistical Analysis
Each continuous trait was assessed for normality with quantile-quantile plots and the Shapiro-Wilks test and then natural log transformed if appropriate and regressed upon covariates: recruitment center, age, age2, sex, and BMI. Extreme outliers (likely to reflect data errors) were identified by visual inspection of box plots and removed. Trait-genotype association was modeled under an additive model for normally distributed variables and under a multiplicative model for log-transformed variables. Individuals who self-reported taking lipid-lowering drugs were excluded from analyses of total cholesterol, high-density lipoprotein (HDL), LDL, and triglycerides. The residuals from the regression analyses were tested for association with each SNP with a score test for trend (Hotelling's t test), implemented in the snpMatrix library13 for the statistical software R.14 We note that log transformations might not be optimal for all traits. However, the Hotelling's t test is an approximation to a test based on the permutation distribution so that results do not depend on distributional assumptions.15 We estimated overdispersion of the test statistics by using the genomic control parameter λ = median χ2/0.456.16 SNP-trait combinations that showed p < 1 × 10⁻⁵ were reanalysed with linear regression, thereby allowing us to estimate effect sizes and the proportion of variance explained (R2). The Wald tests from a linear model can be affected by nonnormality that can lead to incorrect estimates of the variance-covariance matrix. To alleviate this, we use an empirical estimate of the standard errors formed from 1000 bootstrap samples to compute the Wald tests. We tested for evidence for interaction between pairwise combinations of unlinked SNPs by ANOVA comparison of models that allowed an interaction effect to ones that did not. To investigate the potential location of causative variants, we calculated the r2 measure of linkage disequilibrium (LD) between Affymetrix and HapMap SNPs by using snpMatrix.
Saxena et al. have recently published a GWAS of type 2 diabetes (MIM 222100) in which they analyzed several serum-lipid phenotypes in a combined group of 1464 cases and 1467 controls; results are freely available on their website.5 To conduct meta analyses, we reanalyzed LDL, HDL, and triglyceride variables according to the same methods used by Saxena et al.—that is, we regressed natural log transformed LDL, HDL, and triglyceride against recruitment center, age, age2, and sex and then performed linear regression of the standardized residuals against each SNP. We used the inverse variance method to combine results with meta-analysis. Saxena et al. used the same Affymetrix 500K GeneChip as the WTCCC. For our analysis, we included SNPs that passed quality control within the BRIGHT samples, as described above, and were called in ≥95% of diabetic/control samples.
Association analysis was conducted in the TwinsUK samples with linear regression with robust clustered-variance estimates that allow for relatedness within twin pairs in STATA. Analysis in the GRAPHIC study was undertaken by fitting generalized linear mixed models (GLMMs) with Gibbs sampling in WinBUGS, and such fitting adjusted for age and sex.17,18 These models include random effects reflecting the variance attributable to additive polygenic effects (σ2A), common family environment (σ2C), and shared sibling environment (σ2Cs), as well as an error term (σ2E) representing the variance attributable to the effect of unshared nonfamilial factors. By modeling the covariance structure in this manner, the GLMMs deal appropriately with the correlation of traits, genotypes, and environmental determinants within families and are robust to the effects of population substructure.17,19
The definition of a significant result in genome-wide scans is not straightforward. We follow previous arguments3 and consider the problem to be one of multiple hypotheses (many SNPs potentially associated with each trait) rather than of multiple tests of a single global null hypothesis. In this case, the threshold at which significance is declared depends on the (very small) a priori probability that there is a true association at any given SNP and the power of the study to detect it.20 Defining these priori probabilities is to some degree guesswork, but we have made a pragmatic choice to employ the threshold of p < 5 × 10⁻⁷ chosen in the WTCCC because many SNPs that displayed p < 5 × 10⁻⁷ have been readily confirmed in follow-up replication studies.21,22 Power calculations show we have 80% power at this threshold to detect variants responsible for 1.8% of the variance of any trait. We also report SNPs of p < 1 × 10⁻⁵ because there are likely to be some genuine associations within this set. The absolute test of association lies in follow-up replication studies, and we have attempted to replicate newly discovered associations in independent cohorts where available or by meta analysis.
Results
Demographic Features of Cohorts
Subjects in the BRIGHT Study had a median age of 58 years (interquartile range 49–65), and 60% were female. Summary statistics for the biochemistry phenotypes are given in Table 1. The values for phenotypes were generally within normal ranges, apart from creatinine clearance that was slightly reduced (mean 80 ml/min) and triglyceride levels that were slightly elevated (median 1.8 mMol/l), compatible with the hypertensive status of the subjects. The mean age of the GRAPHIC cohort was 39 years (SD = 14), and mean urate levels were 0.27 mMol/l (SD = 0.08 mMol/l). The TwinsUK cohort mean age was 47 years (SD = 12), and mean urate levels were 0.26 mMol/l (SD = 0.06 mMol/l). The average fasting LDL level in TwinsUK was 3.47 mMol/l (SD = 1.10 mMol/l). Demographics of the Saxena et al. cohort have been published previously.5
Table 1.
Summary Statistics for All Biochemistry Variables Studied
| Variable | Unit | n | Normal Range | Mean (SD) | Median (IQR) | Logged |
|---|---|---|---|---|---|---|
| Serum Biochemistry | ||||||
| GFR | ml/min per 1.73 m sq | 1780 | >60 | 72.35 (13.46) | - | |
| Sodium | mmol/l | 1792 | 135.00–144.00 | 139.04 (3.18) | - | |
| Potassium | mmol/l | 1794 | 3.50–5.10 | - | 4.2 (3.8–4.5) | ∗ |
| Chloride | mmol/l | 1407 | 97.00–108.00 | 102.13 (3.15) | - | |
| Urea | mmol/l | 1804 | 2.50–7.50 | - | 5.7 (4.9–6.7) | ∗ |
| Creatinine | umol/l | 1806 | 60.00–110.00 | - | 88 (79–100) | ∗ |
| Calcium | mmol/l | 1803 | 2.20–2.65 | 2.4 (0.14) | - | |
| Corrected.calcium | mmol/l | 1807 | 2.16–2.53 | 2.34 (0.15) | - | |
| Albumin | g/l | 1803 | 36.00–50.00 | 44.4 (2.93) | - | |
| GGT | U/l | 1802 | 5.00–50.00 | - | 24 (17–36) | ∗ |
| Glucose | mmol/l | 1748 | 2.80–6.00 | - | 5.2 (4.7–5.8) | ∗ |
| Urate | mmol/l | 1766 | 0.10–0.42 | 0.32 (0.09) | - | |
| Cholesterol | mmol/l | 1635 | 3.10–6.50 | 5.6 (1.03) | - | |
| Triglyceride | mmol/l | 1635 | <2.10 | - | 1.8 (1.3–2.6) | ∗ |
| HDL | mmol/l | 1636 | 0.90–1.93 | - | 1.3 (1.1–1.6) | ∗ |
| LDL | mmol/l | 1635 | 1.55–4.40 | - | 3.76 (3.2–4.4) | ∗ |
| Urine Biochemistry | ||||||
| Sodium | mmol/l | 1254 | # | - | 77 (57–102) | ∗ |
| 24 hr sodium | mmol/24 hr | 1249 | 40.00–222.00 | 140.93 (62.79) | - | |
| Potassium | mmol/l | 1254 | # | - | 38 (30–50) | ∗ |
| 24 hr potassium | mmol/24 hr | 1248 | 25.00–125.00 | 69.78 (25.98) | - | |
| Creatinine | mmol/l | 1248 | # | - | 5.5 (4.3–7.8) | ∗ |
| 24 hr creatinine | mmol/24 hr | 1248 | 9.00–18.00 | - | 9.63 (7.7–12.4) | ∗ |
| Albumin creatinine ratio | mg/mmol | 1144 | <2.50 | - | 0.83 (0.48–1.53) | ∗ |
| Albumin | mg/l | 1144 | <20 | - | 5 (3–8) | ∗ |
| Creatinine clearance | ml/min | 1186 | 80.00–140.00 | 80.63 (28.17) | - | |
Variables that were log transformed are shown with a asterisk in the logged column. The number of observations (n) is shown together with the mean and standard deviation for untransformed variables and median and interquartile range for log-transformed variables. Normal ranges were obtained from Clinical Biochemistry Unit at the University of Glasgow; “#” indicates that no normal range available for this variable.
Summary of Quality-Control Measures
Only limited overdispersion of test statistics was observed in the BRIGHT cohort, with λ ranging from 0.99–1.03 with a mean of 1.01 over all traits (Table 2). This implies that our type I error rates will be broadly correct and that the influence of unmeasured population substructure and cryptic relatedness is minimal. Genotype data for 1955 individuals and 400,496 SNPs passed quality control.
Table 2.
Genomic Control Parameters, Lambda, Estimating the Overdispersion of Chi Square Statistics for Each Trait Studied
| Trait | Lambda |
|---|---|
| GFR | 1.01 |
| Sodium | 1.00 |
| Potassium | 1.02 |
| Chloride | 1.02 |
| Urea | 1.00 |
| Creatinine | 1.02 |
| Calcium | 1.01 |
| Corrected.calcium | 1.03 |
| Albumin | 1.01 |
| GGT | 1.02 |
| Glucose | 1.01 |
| Urate | 1.01 |
| Urine sodium | 1.01 |
| Urine sodium by volume | 1.02 |
| Urine potassium | 1.01 |
| Urine potassium by volume | 1.00 |
| Urine creatinine | 0.99 |
| Urine creatinine by volume | 1.02 |
| Urine albumin | 1.01 |
| Albumin creatinine ratio | 1.02 |
| Creatinine clearance | 1.01 |
| Cholesterol | 1.00 |
| Triglyceride | 1.01 |
| HDL | 0.99 |
| LDL | 1.01 |
Genetic Associations
Our analysis identified several previously unrecognized associations and confirmed previously published associations (Table 3). The strongest association was between serum urate and SNPs in a 0.4 Mb region on chromosome 4p16–p15.3 (most associated SNP: rs7442295, p = 2 × 10⁻¹⁵, Figure 1; more detailed information in Table 4). Urate has several known potential confounders: serum creatinine, alcohol consumption, blood pressure, sex, and administration of thiazide diruretics. We therefore reanalyzed the association in a multivariate regression including all these covariates; the evidence for association remained highly significant (p = 1 × 10⁻¹³, effect = −0.023 mMol/L per copy of common allele, 95% CI = −0.029, −0.016). Tables 5 and 6 show summary statistics on these covariates and the relationship between them. Estimated effect sizes are given in Table 7. Among the BRIGHT subjects, 196 of 1765 with urate measurements were hyperuricaemic (defined as serum urate >0.42 mMol/l). The effect of this SNP on serum urate translated to an odds ratio of 1.89 (95% CI = 1.36–2.61, p = 5.6 × 10⁻⁵) per copy of the common allele. There was no significant difference in effect by sex. We replicated this finding in two independent cohorts: in the GRAPHIC study by genotyping the same SNP (p = 9 × 10⁻¹⁵) and in TwinsUK by using the best proxy SNP for rs7442295 on the Illumina Chip (p = 8 × 10⁻¹⁹) with similar odds ratios, see Table 8.
Table 3.
Primary Associations in BRIGHT Subjects, p < 1 × 10⁻⁵
| Trait | Chr | Position | SNP | Genes | MAF | A1 | A2 | Additive | Effect | 95% CI | p | R2 |
|---|---|---|---|---|---|---|---|---|---|---|---|---|
| Serum Biochemistry | ||||||||||||
| Albumin | 3 | 125256768 | rs9289231 | KALRN | 0.09 | T | G | + | −0.77 | −1.09, −0.45 | 2.91 × 10⁻⁶ | 1.20 |
| Calcium | 3 | 8114779 | rs527498 | - | 0.36 | G | A | + | −0.02 | −0.03, −0.01 | 6.45 × 10⁻⁶ | 1.34 |
| Chloride | 5 | 52417975 | rs12521915 | ITGA2 | 0.37 | C | G | + | 0.54 | 0.30, 0.78 | 8.09 × 10⁻⁶ | 1.41 |
| Cholesterol | 11 | 116175886 | rs6589567 | ApoA5 | 0.11 | C | A | + | 0.28 | 0.17, 0.39 | 7.76 × 10⁻⁷ | 1.48 |
| Cholesterol | 1 | 109526922 | rs4970834 | CELSR2 | 0.20 | C | T | + | −0.21 | −0.30, −0.12 | 1.70 × 10⁻⁶ | 1.42 |
| Cholesterol | 16 | 81115185 | rs10514542 | - | 0.28 | G | C | + | 0.18 | 0.10, 0.25 | 6.98 × 10⁻⁶ | 1.23 |
| Cholesterol | 14 | 54967291 | rs4470077 | TBPL2 | 0.19 | A | G | + | 0.20 | 0.11, 0.28 | 9.04 × 10⁻⁶ | 1.20 |
| GGTa | 9 | 114895784 | rs17819305 | TNC | 0.09 | C | T | × | 1.20 | 1.12, 1.29 | 1.74 × 10⁻⁷ | 1.50 |
| GGT | 2 | 44238574 | rs2333825 | - | 0.43 | G | A | × | 1.10 | 1.06, 1.15 | 2.68 × 10⁻⁶ | 1.21 |
| GGT | 22 | 16857154 | rs10854521 | - | 0.24 | G | A | × | 0.90 | 0.86, 0.94 | 7.44 × 10⁻⁶ | 1.11 |
| Glucose | 22 | 43065788 | rs739161 | - | 0.30 | T | C | × | 0.97 | 0.95, 0.98 | 3.75 × 10⁻⁶ | 1.68 |
| HDL | 10 | 132089471 | rs11017236 | - | 0.16 | T | A | × | 1.06 | 1.04, 1.09 | 5.67 × 10⁻⁷ | 1.51 |
| HDL | 11 | 102903507 | rs11826048 | - | 0.09 | C | T | × | 0.92 | 0.90, 0.95 | 9.70 × 10⁻⁷ | 1.45 |
| HDL | 3 | 15540326 | rs905648 | COLQ | 0.34 | C | T | × | 0.96 | 0.94, 0.98 | 4.58 × 10⁻⁶ | 1.28 |
| LDLa | 1 | 109534208 | rs599839 | PSRC1, CELSR2 | 0.24 | A | G | × | 0.95 | 0.93, 0.97 | 1.05 × 10⁻⁷ | 1.71 |
| LDL | 2 | 51183769 | rs11889082 | - | 0.08 | A | G | × | 1.08 | 1.05, 1.12 | 1.22 × 10⁻⁶ | 1.44 |
| LDL | 8 | 129112227 | rs6470600 | NA | 0.03 | G | A | × | 0.89 | 0.85, 0.94 | 8.68 × 10⁻⁶ | 1.21 |
| Triglyceridea | 11 | 116157633 | rs6589566 | APOA5 | 0.06 | A | G | × | 1.28 | 1.19, 1.37 | 2.89 × 10⁻¹¹ | 2.65 |
| Triglyceridea | 8 | 19876926 | rs17482753 | LPL | 0.11 | G | T | × | 0.84 | 0.79, 0.89 | 1.17 × 10⁻⁹ | 2.22 |
| Triglyceridea | 2 | 27652888 | rs780094 | GCKR | 0.39 | C | T | × | 1.10 | 1.06, 1.14 | 4.99 × 10⁻⁷ | 1.54 |
| Triglyceride | 19 | 36032592 | rs17545624 | - | 0.29 | A | G | × | 1.10 | 1.06, 1.14 | 2.13 × 10⁻⁶ | 1.36 |
| Uratea | 4 | 9642649 | rs7442295 | SLC2A9 | 0.21 | A | G | + | −0.02 | −0.03, −0.02 | 1.85 × 10⁻¹⁵ | 3.48 |
| Urate | 8 | 42088927 | rs7840827 | - | 0.20 | G | A | + | 0.02 | 0.01, 0.02 | 1.84 × 10⁻⁶ | 1.28 |
| Urea | 12 | 38609908 | rs11174338 | SLC2A13 | 0.12 | G | T | × | 1.06 | 1.03, 1.08 | 7.91 × 10⁻⁶ | 1.10 |
| Urine Biochemistry | ||||||||||||
| Albumina | 12 | 102813190 | rs11111839 | XR_015316.1 | 0.06 | C | A | × | 1.61 | 1.35, 1.93 | 2.51 × 10⁻⁷ | 2.31 |
| Albumina | 3 | 19758281 | rs17006217 | - | 0.13 | T | C | × | 0.72 | 0.64, 0.82 | 4.52 × 10⁻⁷ | 2.21 |
| Creatinine | 11 | 21910263 | rs324175 | - | 0.09 | C | T | × | 0.87 | 0.82, 0.92 | 6.03 × 10⁻⁷ | 1.97 |
| Potassium | 22 | 17950507 | rs737857 | - | 0.10 | A | G | × | 1.12 | 1.07, 1.18 | 2.19 × 10⁻⁶ | 1.76 |
| Potassium by volume | 23 | 122355911 | rs4474149 | - | 0.38 | G | A | + | −3.86 | −5.54, −2.19 | 5.88 × 10⁻⁶ | 1.62 |
| Potassium by volume | 10 | 91689651 | rs1419112 | - | 0.06 | C | T | + | −9.34 | −13.31, −5.38 | 4.02 × 10⁻⁶ | 1.69 |
| Sodiuma | 20 | 1936599 | rs6035310 | PDYN | 0.18 | A | C | × | 1.13 | 1.08, 1.18 | 2.32 × 10⁻⁷ | 2.10 |
| Sodium | 2 | 133366441 | rs10496693 | Q6ZVE2_HUMAN | 0.25 | G | A | × | 1.09 | 1.05, 1.14 | 3.24 × 10⁻⁶ | 1.71 |
| Creatinine clearance | 1 | 58615359 | rs706430 | - | 0.42 | G | A | + | −4.49 | −6.45, −2.52 | 8.02 × 10⁻⁶ | 1.66 |
Only the SNP with the lowest p value for each region is shown. Genes listed are within 20 kb of the associated SNP or within the LD block estimated from HapMap data. MAF stands for minor allele frequency; A1 stands for the major allele; and A2 stands for the minor allele; effects are additive (+) or multiplicative (×) depending on whether the phenotype was log transformed. “R2” represents the percentage of phenotypic variance explained by the SNP. All SNP positions are in relation to build 35 of the human genome.
Associations with p < 5 × 10⁻⁷.
Figure 1.
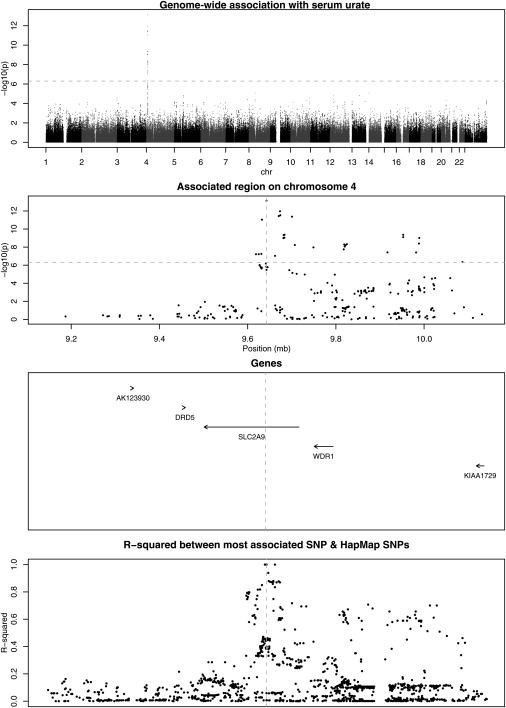
Genome-Wide Association with Serum Urate
The dotted line represents the threshold for genome-wide significance.
Table 4.
Genotype Counts and Trait Distributions in BRIGHT Subjects for Associations with Urate and LDL
| SNP | Trait | Number of Individuals | Genotypes | Counts | Trait Summary |
|---|---|---|---|---|---|
| rs7442295 | Urate | 1754 | AA | 1083 | 0.33 (0.09) |
| AG | 600 | 0.31 (0.08) | |||
| GG | 71 | 0.25 (0.08) | |||
| rs10489588 | LDL | 1628 | AA | 926 | 1.34 (1.18–1.50) |
| AG | 621 | 1.29 (1.13–1.46) | |||
| GG | 81 | 1.27 (1.10–1.40) |
Traits are summarized within genotype by mean (standard deviation) for urate and by median (interquartile range) for LDL because the latter is nonnormally distributed.
Table 5.
Summary Statistics about Confounding Variables
| Variable | Summary (median, IQR unless otherwise shown) |
|---|---|
| Sex (female/male) | 977/593 |
| Thiazides (yes/no) | 558/1012 |
| rs7442295 (AA/AG/GG) | 982/525/63 |
| Alcohol (units/weeks) | 3 (0–10) |
| Creatinine (μmol/l) | 87 (79–99) |
A total of 1570 individuals had information on all variables.
Table 6.
Correlation between Variables
| Urate (mmol/l) | Alcohol (units/week) | Sex (female) | Creatinine (μmol/l) | |
|---|---|---|---|---|
| Alcohol (units/week) | 0.24 (<2 × 10⁻¹⁶) | |||
| Sex (female) | −0.41 (<2 × 10⁻¹⁶) | −0.35 (<2 × 10⁻¹⁶) | ||
| Creatinine (μmol/l) | 0.48 (<2 × 10⁻¹⁶) | 0.13 (4.47 × 10⁻⁷) | −0.50 (<2 × 10⁻¹⁶) | |
| Thiazides (yes) | 0.12 (6.9 × 10⁻⁷) | −0.03 (0.18) | 0.11 (3.1 × 10⁻⁶) | 0.04 (0.07) |
Entries are r (p) where r is Pearson's correlation coefficient.
Table 7.
Results of Multivariate Regression of Serum Urate against Covariates and Most Associated SNP
| Effect Size | Std Error | T | p | |
|---|---|---|---|---|
| Alcohol (units/week) | 0.0012 | 0.0002 | 6.116 | 1.21 × 10⁻⁹ |
| Sex (female) | −0.0339 | 0.0044 | −7.634 | 3.93 × 10⁻¹⁴ |
| Creatinine (μmol/l) | 0.0018 | 0.0001 | 15.149 | <2 × 10⁻¹⁶ |
| Thiazides (yes) | 0.0299 | 0.0037 | 8.138 | 8.08 × 10⁻¹⁶ |
| rs7442295 | −0.0230 | 0.0031 | −7.493 | 1.12 × 10⁻¹³ |
Table 8.
Replication of Associations
| Serum Urate (mmol/l) and rs7442295 | |||||||
|---|---|---|---|---|---|---|---|
| Cohort | SNP | Alleles | MAF | Effect | 95% CI | p | r2 with rs7442295 |
| BRIGHT | rs7442295 | A/G | 0.21 | −0.024 | (−0.030, −0.018) | 2 × 10⁻¹⁵ | – |
| GRAPHIC | rs7442295 | A/G | 0.21 | −0.020 | (−0.024, −0.015) | 9 × 10⁻¹⁵ | – |
| Twins UK | rs6449213 | T/C | 0.20 | −0.020 | (−0.016, −0.024) | 8 × 10⁻¹⁹ | 0.88 |
| Hyperuracemia and rs742295 | |||||||
| Cohort | SNP | Alleles | MAF | OR | 95% CI | p | r2 with rs7442295 |
| BRIGHT | rs7442295 | A/G | 0.21 | 0.53 | (0.38, 0.73) | 1 × 10⁻⁴ | – |
| GRAPHIC | rs7442295 | A/G | 0.21 | 0.58 | (0.40, 0.84) | 4 × 10⁻³ | – |
| Twins UK | rs6449213 | T/C | 0.20 | 0.33 | (0.16, 0.71) | 4 × 10⁻³ | 0.88 |
| LDL and rs599839 | |||||||
| Cohort | SNP | Alleles | MAF | Effect | 95% CI | p | r2 with rs599839 |
| BRIGHT | rs599839 | A/G | 0.24 | 0.95 | (0.93, 0.97) | 1 × 10⁻⁷ | – |
| Saxena | rs599839 | A/G | 0.23 | 0.83 | (0.78, 0.89) | 5 × 10⁻⁸ | – |
| Twins UK | rs646776 | A/G | 0.23 | 0.92 | (0.85, 1.00) | 0.06 | 0.88 |
The estimated effect is the effect of the minor allele compared to the major. Alleles stands for major/minor alleles. MAF stands for minor allele frequency. 95% CI stands for 95% confidence interval. OR stands for odds ratio.
The most associated SNP lies within the SLC2A9 gene (MIM 606142), the solute carrier family 2 (facilitated glucose transporter), member 9 gene. This SNP is within a sizeable region of linkage disequilibrium (LD) and extends into a neighboring gene, WDR1 (a WD-repeat-containing protein implicated in the development and function of neutrophils and megakaryocytes [MIM 604734]).23 The association signal is much stronger across SNPs within SLC2A9 than the rest of the high LD region. There are 762 SNPs that lie within 2 Mb of rs7442295 on the Affymetrix 500k gene chip; none of these contribute additional information to explain the association (all p > 0.007), suggesting there is only one causative locus tagged by these SNPs (SLC2A9).
We found many associations with lipid traits, replicating several published known associations between genes and serum triglyceride levels: APO1/APOC3/APOA5 region (APOA1 [MIM 07680], APOC3 [MIM 107720], and APOA5 [MIM 606368]) (rs6589566, p = 3 × 10⁻¹¹),24 lipoprotein lipase, LPL (MIM 609708) (rs17482753, p = 1 × 10⁻⁹),25 and the recently established association with glucokinase (hexokinase 4) regulator, GCKR (MIM 600842) (rs780094, p = 5 × 10⁻⁷)5. These genes all showed considerably stronger evidence for association in the meta-analysis (Table 9).
Table 9.
Meta-Analysis Associations, p < 1 × 10⁻⁵
| Bright |
Broad |
Meta |
|||||||||||||||
|---|---|---|---|---|---|---|---|---|---|---|---|---|---|---|---|---|---|
| Trait | Chr | Position | SNP | Genes | A1 | A2 | MAF | Effect | 95% CI | p | Effect | 95% CI | p | Effect | 95% CI | p | R2 |
| HDLa | 16 | 55542640 | rs9989419 | CETP | G | A | 0.4 | 0.98 | 0.96, 0.99 | 5.99 × 10⁻³ | 0.94 | 0.93, 0.96 | 1.27 × 10⁻⁹ | 0.96 | 0.94, 0.97 | 1.03 × 10⁻¹⁰ | 0.45 |
| HDLa | 8 | 19896590 | rs17411031 | LPL | C | G | 0.27 | 1.05 | 1.02, 1.07 | 2.12 × 10⁻⁵ | 1.05 | 1.03, 1.07 | 1.31 × 10⁻⁶ | 1.05 | 1.03, 1.07 | 1.28 × 10⁻¹⁰ | 1.11 |
| HDL | 15 | 56514617 | rs261332 | LIPC | G | A | 0.21 | 1.03 | 1.01, 1.05 | 7.00 × 10⁻³ | 1.05 | 1.03, 1.08 | 1.82 × 10⁻⁵ | 1.04 | 1.03, 1.06 | 5.02 × 10⁻⁷ | 0.47 |
| HDL | 9 | 104727210 | rs3890182 | ABCA1 | G | A | 0.12 | 0.97 | 0.95, 1.00 | 3.80 × 10⁻² | 0.94 | 0.92, 0.97 | 1.31 × 10⁻⁵ | 0.95 | 0.94, 0.97 | 2.09 × 10⁻⁶ | 0.26 |
| HDL | 19 | 50169221 | rs16979595 | CLPTM1 | G | A | 0.16 | 1.03 | 1.01, 1.06 | 6.11 × 10⁻³ | 1.05 | 1.02, 1.07 | 3.05 × 10⁻⁴ | 1.04 | 1.02, 1.06 | 5.79 × 10⁻⁶ | 0.45 |
| LDLa | 1 | 109534208 | rs599839 | PSRC1,CELSR2 | A | G | 0.24 | 0.95 | 0.93, 0.97 | 1.05 × 10⁻⁷ | 0.83 | 0.78, 0.89 | 4.91 × 10⁻⁸ | 0.85 | 0.82, 0.89 | 3.50 × 10⁻¹⁴ | 1.71 |
| LDLa | 19 | 50114786 | rs4420638 | APOE | A | G | 0.19 | 1.03 | 1.00, 1.05 | 2.17 × 10⁻² | 1.30 | 1.21, 1.39 | 3.57 × 10⁻¹⁴ | 1.18 | 1.13, 1.23 | 8.27 × 10⁻¹⁴ | 0.32 |
| LDLa | 2 | 21199973 | rs562338 | APOB | G | A | 0.17 | 0.95 | 0.93, 0.98 | 3.31 × 10⁻⁵ | 0.80 | 0.75, 0.87 | 5.43 × 10⁻⁹ | 0.85 | 0.81, 0.89 | 8.58 × 10⁻¹³ | 1.05 |
| LDL | 19 | 11088602 | rs688 | LDLR | C | T | 0.45 | 1.03 | 1.02, 1.05 | 9.25 × 10⁻⁵ | 1.10 | 1.04, 1.16 | 1.31 × 10⁻³ | 1.09 | 1.06, 1.13 | 7.27 × 10⁻⁷ | 0.93 |
| Trga | 8 | 19876926 | rs17482753 | LPL | G | T | 0.11 | 0.84 | 0.79, 0.89 | 1.17 × 10⁻⁹ | 0.76 | 0.68, 0.84 | 3.28 × 10⁻⁷ | 0.76 | 0.71, 0.82 | 5.23 × 10⁻¹⁵ | 2.22 |
| Trga | 2 | 27652888 | rs780094 | GCKR | C | T | 0.39 | 1.10 | 1.06, 1.14 | 4.06 × 10⁻⁷ | 1.20 | 1.13, 1.29 | 3.44 × 10⁻⁸ | 1.18 | 1.13, 1.23 | 8.05 × 10⁻¹⁴ | 1.54 |
| Trga | 11 | 116157633 | rs6589566 | APOA5 | A | G | 0.06 | 1.29 | 1.20, 1.38 | 1.45 × 10⁻¹¹ | 1.25 | 1.11, 1.40 | 1.45 × 10⁻⁴ | 1.32 | 1.22, 1.42 | 3.65 × 10⁻¹² | 2.65 |
| Trga | 1 | 62761840 | rs12042319 | ANGPTL3 | G | A | 0.34 | 0.93 | 0.90, 0.97 | 3.29 × 10⁻⁴ | 0.88 | 0.82, 0.94 | 2.46 × 10⁻⁴ | 0.89 | 0.85, 0.93 | 3.24 × 10⁻⁷ | 0.77 |
| Trg | 4 | 58825236 | rs1471233 | - | C | T | 0.41 | 1.06 | 1.02, 1.10 | 2.00 × 10⁻³ | 1.12 | 1.05, 1.20 | 3.55 × 10⁻⁴ | 1.10 | 1.06, 1.15 | 2.38 × 10⁻⁶ | 0.60 |
| Trg | 7 | 72321817 | rs2074755 | BAZ1B | T | C | 0.11 | 0.91 | 0.86, 0.96 | 3.44 × 10⁻⁴ | 0.87 | 0.80, 0.95 | 1.59 × 10⁻³ | 0.87 | 0.82, 0.92 | 3.51 × 10⁻⁶ | 0.78 |
| Trg | 1 | 174178573 | rs12140698 | - | C | T | 0.12 | 1.10 | 1.05, 1.16 | 3.02 × 10⁻⁴ | 1.15 | 1.05, 1.26 | 2.70 × 10⁻³ | 1.15 | 1.08, 1.22 | 4.98 × 10⁻⁶ | 0.80 |
| Trg | 1 | 166296403 | rs3917820 | SELP | G | A | 0.12 | 0.94 | 0.89, 0.99 | 1.39 × 10⁻² | 0.82 | 0.74, 0.91 | 1.12 × 10⁻⁴ | 0.86 | 0.81, 0.92 | 5.47 × 10⁻⁶ | 0.37 |
| Trg | 9 | 1660196 | rs4740635 | - | G | C | 0.33 | 1.07 | 1.03, 1.11 | 6.56 × 10⁻⁴ | 1.11 | 1.04, 1.19 | 1.91 × 10⁻³ | 1.11 | 1.06, 1.15 | 5.51 × 10⁻⁶ | 0.70 |
| Trg | 9 | 110936892 | rs7861175 | - | T | C | 0.2 | 0.94 | 0.90, 0.98 | 5.26 × 10⁻³ | 0.85 | 0.78, 0.93 | 4.65 × 10⁻⁴ | 0.88 | 0.83, 0.93 | 7.98 × 10⁻⁶ | 0.45 |
| Trg | 18 | 12273547 | rs7229921 | - | A | G | 0.25 | 1.06 | 1.02, 1.11 | 2.26 × 10⁻³ | 1.12 | 1.05, 1.21 | 1.26 × 10⁻³ | 1.11 | 1.06, 1.16 | 9.87 × 10⁻⁶ | 0.57 |
Only the SNP with the lowest p value for each region is shown. Genes listed are within 20 kb the associated SNP or within the LD block estimated from HapMap data. MAF stands for minor allele frequency in BRIGHT subjects; A1 stands for the major allele; and A2 stands for the minor allele; all effects are multiplicative. “R2” refers to the percentage of phenotypic variance explained by the SNP. All positions are build 35.
Associations with p < 5 × 10⁻⁷.
We also found an interesting signal in the BRIGHT cohort between LDL cholesterol and SNPs in a 10 Kb region on chromosome 1p13.3 (most associated SNP, rs599839, p = 1 × 10⁻⁷; more detailed information in Table 4). This region also showed association in Saxena et al. (p = 5 × 10⁻⁸), and the evidence for association was further enhanced in the combined meta analysis (p = 4 × 10⁻¹⁴). The common allele is associated with a 6% increase in nonfasting serum LDL in the BRIGHT cohort and a 25% increase in fasting serum LDL in the Saxena study. The closest genes are PSRC1 and CELSR2 (MIM 604265); neither gene has previously been associated with LDL levels (see Figure 2). We attempted to replicate association of LDL with the PSRC1/CELSR2 region in the TwinsUK resource by using a proxy SNP for rs599839 (r2 = 0.88) but found only borderline significant association with fasting LDL levels (p = 0.06). However, the same allele of the same SNP was recently reported to be strongly associated with increased risk of coronary artery disease.26
Figure 2.
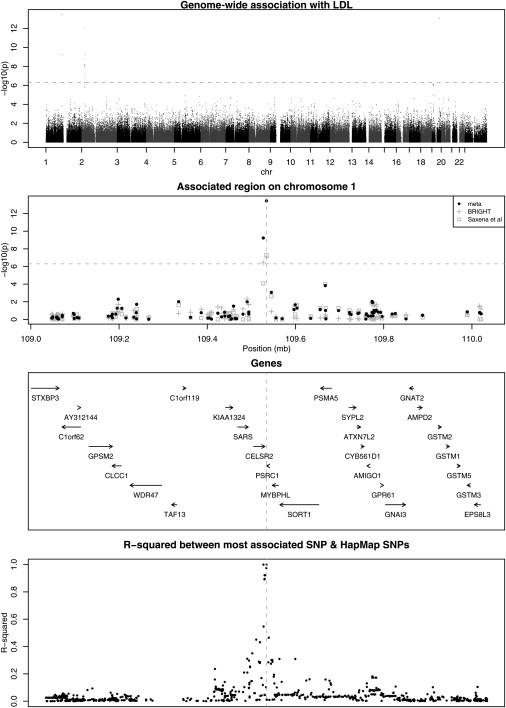
Genome-Wide Association with Serum LDL
The dotted line represents the threshold for genome-wide significance.
We also found interesting signals between gamma glutamyl transferase (GGT) and SNPs in the TNC gene (MIM 187380) (rs17819305, p = 2 × 10⁻⁷); urine albumin and SNPs around 102 Mb on chromosome 12 (rs11111839, p = 3 × 10⁻⁷) and 19.7 Mb on chromosome 3 (rs17006217, p = 5 × 10⁻⁷); and urine sodium and SNPs close to the PDYN gene (MIM 131340) (rs6035310, p = 2 × 10⁻⁷). Of potential interest is the SNP associated with urinary sodium, which is upstream of prodynorphin, PDYN. PDYN belongs to the opioid neuropeptide precursor family and is a preproprotein that is proteolytically processed to form secreted opioid peptides, which are ligands for the kappa type of opioid receptor. This is interesting because the kappa opioid receptors have been shown to play a role in regulating urinary sodium and water excretion. At this time, these associations need to be considered as provisional until replicated in other studies.
Discussion
This study indicates that common genetic variation influences biochemical parameters that are measured in everyday clinical care. Importantly, we have identified a region that is on chromosome 1 and that is not previously known to influence LDL, a frequently measured biomarker of cardiovascular risk. In addition, we replicated many previously reported associations with other lipid traits. We also discovered and replicated association between serum-urate levels and the SLCA9 gene in two cohorts. This indicates an inherited tendency to have higher urate levels, a finding that might lead to the understanding the biological relationship between serum urate and cardiovascular disease.
There is clear epidemiological evidence that increased levels of LDL lead to cardiovascular disease (mostly coronary disease), and it is estimated that elevated cholesterol contributes to 4.4 M deaths per annum worldwide.27 In this context, our discovery of an association between serum LDL levels and SNPs in neighboring genes PSRC1 and CELSR2 is of interest. Our finding assumes particular importance because the same allele at same SNP has recently been associated with increased risk of coronary disease in a combined genome-wide analysis of British and German cohorts.26 Accordingly, our observations provide a biological connection between genetic influence on LDL levels and coronary heart disease.
The association appears to be localized to a 10 Kb region, containing just the PSRC1 and CELSR2 genes that have not been extensively characterized. PSRC1 (proline/serine-rich coiled coil 1), also known as DDA3, is most abundantly expressed in adult brain and fetal thymus,28 but very little is known about function of the gene product beyond a role as a microtubule-associated protein within the WNT/beta-catenin signaling pathway. This pathway, however, has been functionally implicated in LDL processing in the liver.29,30 CELSR2 (cadherin, EGF LAG seven-pass G-type receptor 2) is a member of the flamingo subfamily of receptors thought to be involved in contact-mediated communication, but a specific function has not yet been determined.31 We found only borderline significant association between a proxy SNP and LDL in the TwinsUK cohort. This finding parallels data from other recently discovered QTLs in which the overall evidence is highly significant, but significant association is not seen within every cohort, e.g., in the association between a common variant in the FTO (MIM 610966) (fat-mass- and obesity-associated) gene and body mass.2 Thus, further genetic studies will be required for determination of the respective role of these new genes in lipid metabolism.
Generally, the estimated effect sizes for the lipid associations were lower in the BRIGHT subjects than those in the Saxena study. The most likely explanation for the difference is that BRIGHT hypertensive subjects had nonfasting measurements, whereas subjects in the Saxena study were fasted. This could introduce additional noise from dietary exposure, and such noise might attenuate genetic effects. However, this also illustrates an interesting point, that genetic polymorphisms that influence fasting lipid levels also exert their effects in the more common “fed” state. This is of importance because several recent papers have shown association between nonfasting triglycerides with increased risk of cardiovascular events.32,33
Our second novel finding of potential clinical relevance is the identification of a common allele within the glucose transporter gene SLC2A9, present in 79% of white European population, increases serum-urate levels by 0.02 mMol/l for each allelic copy, and this translates into an odds ratio of 1.89 per copy for hyperuricaemia in BRIGHT and similar OR in the replication cohorts. This association was detected in a GWAS of hypertensive patients and confirmed in two epidemiological collections that reflect the normal range of blood-pressure variation in the UK. Genetic epidemiological data from the Framingham study suggest that urate levels are markedly heritable; the proportion of variance explained by shared genetic background is ∼63%.34 Our findings at the SLC2A9 gene locus explain 3.5% of residual urate variance (after adjustment for covariates).
The SLC2A9 gene encodes a putative glucose transporter most strongly expressed in the kidney and liver,35 and at low levels in chondrocytes, suggesting this gene should also be explored in patients with gout.36 There are no data suggesting that SLC2A9 acts directly as a urate transporter in the proximal nephron. However, the kidney is known to have a pivotal role in urate handling via multiple organic anion transporters (OATs 1–4 [MIM 607582, MIM 604995, MIM 607581, and MIM 607579], OATv1) and urate anion transporters (URAT1 [MIM 607096], UAT) and is the target of uricosuric drugs.36 We found no evidence for association with these previously characterized urate transporters and serum urate within the WTCCC genome-wide scan, although many are poorly tagged by the Affymetrix chip (Table 10).
Table 10.
Known Urate Transporters Showing the Number of HapMap SNPs Tagged by Affymetrix SNPs at R2 > 0.8
| Name | Alternative Identity | Chr | Gene Start | Gene End | Number of HapMap.SNPs | Number of Affy SNPs | Mean R2 | Percentage of Hapmap SNPs tagged at R2 > 0.8 |
|---|---|---|---|---|---|---|---|---|
| ABCC4 | MRP4 | 13 | 94470091 | 94751684 | 395 | 90 | 0.75 | 0.610 |
| LGALS9 | UAT2 | 17 | 22982301 | 23000712 | 34 | 9 | 0.82 | 0.735 |
| PDZK1 | PDZK1 | 1 | 144439083 | 144475430 | 93 | 26 | 0.83 | 0.677 |
| SLC17A1 | NPT-1 | 6 | 25891296 | 25938776 | 118 | 16 | 0.87 | 0.873 |
| SLC22A6 | OAT1 | 11 | 62500646 | 62509045 | 23 | 4 | 0.57 | 0.348 |
| SLC22A7 | OAT2 | 6 | 43373976 | 43381253 | 25 | 9 | 0.67 | 0.440 |
| SLC22A8 | OAT3 | 11 | 62516873 | 62539887 | 37 | 5 | 0.37 | 0.324 |
| SLC22A9 | OAT-5 | 11 | 62893837 | 62934286 | 52 | 11 | 0.80 | 0.673 |
| SLC22A11 | OAT4 | 11 | 64079674 | 64095574 | 24 | 12 | 0.86 | 0.792 |
| SLC22A12 | URAT1 | 11 | 64114858 | 64126396 | 15 | 6 | 0.62 | 0.533 |
| SLC2A9 | GLUT9 | 4 | 9436948 | 9650970 | 352 | 78 | 0.94 | 0.898 |
| SLC9A3R1 | NHERF-1 | 17 | 70256379 | 70277089 | 42 | 2 | 0.56 | 0.310 |
| SLC9A3R2 | NHERF-1 | 16 | 2016930 | 2028484 | 28 | 4 | 0.27 | 0.143 |
| SLC5A8 | AIT | 12 | 100073409 | 100128120 | 99 | 15 | 0.72 | 0.545 |
There are many studies in the literature showing a correlation between increased serum urate and blood pressure,37,38 coronary artery disease, and other metabolic disorders.39,40 Several mechanisms have been proposed to explain the correlation of urate with hypertension and common cardiovascular disease. These include enhanced renin release from the kidney leading to vasoconstriction and sodium retention, suppression of nitric oxide production, and endothelial dysfunction, but the precise mechanism is unclear.41
We note that none of the convincingly associated loci reported in this paper were associated with hypertension in the primary WTCCC study even though urate has been associated with blood pressure in other studies.37,38,41 This might reflect either lack of power to detect association with hypertension because these biochemical traits are more strongly heritable or that these traits are biomarkers of hypertension without being in the causative pathway. This can only be resolved for SLC2A9 and urate by more extensive genotyping in large populations with blood-pressure measurements and functional studies. Unfortunately, it is difficult to estimate how large a sample size would be required without robust estimates of the effect of change in uric acid on disease endpoints, and we could not find these for the UK population. Finally, we note that analysis in hypertensives only or hypertensives and diabetics for the lipid traits might reveal genes that are not relevant to the general population. However, our replication of known associations in these disease-selected populations and the replication of our novel results in population cohorts (TwinsUK and GRAPHIC) indicate that our results are independent of disease background and applicable to the wider population.
In summary, we have identified a gene locus for serum LDL, a common risk factor for coronary disease, and replicated several other genes for dyslipidaemia. Furthermore, we detected common SLC2A9 variants that increase serum urate, but the precise relationship of our findings to blood pressure, cardiovascular risk, and gout will require further work. Our findings provide a focus for several novel research avenues, whose results might have widespread clinical applications and illustrates the additional value that can be extracted from GWAS data when subjects have been intensively phenotyped for intermediate traits.
Supplemental Data
A membership list of the WTCCC is available at http://www.ajhg.org/cgi/content/full/82/1/139/DC1/.
Supplemental Data
Web Resources
The URLs for data presented herein are as follows:
Online Mendelian Inheritance in Man (OMIM), http://www.ncbi.nlm.nih.gov/Omim
TwinsUK Registry, http://www.twinsUK.ac.uk
Acknowledgments
We thank the Diabetes Genetics Initiative of Broad Institute of Harvard and MIT, Lund University, and Novartis Institutes for BioMedical Research for making their results available and thank Paul deBakker. We would also like to thank Mr. Abiodun Onipinla for helpful discussions. C.W. is funded by the British Heart Foundation (grant number; FS/05/061/19501). The BRIGHT study is supported by the Medical Research Council (grant number; G9521010D) and the British Heart Foundation (grant number PG02/128). The Wellcome Trust Case Control Consortium was funded by the Wellcome Trust (grant number; 076113/B/04/Z). The Barts and The London Charity funded the Barts and The London Genome Centre. Professors Dominiczak and Samani are British Heart Foundation Chairholders. The GRAPHIC Study was funded by the British Heart Foundation. We would also like to thank all the staff of the Twins Research Unit and the twin volunteers. TwinsUK is supported by the Wellcome Trust. We also thank Rhian Gwilliam and the genotyping facility at the Sanger Institute for generating the genotypes of the Twins samples. P.D. is funded by the Wellcome Trust.
References
- 1.Mitchell B.D., Kammerer C.M., Blangero J., Mahaney M.C., Rainwater D.L., Dyke B., Hixson J.E., Henkel R.D., Sharp R.M., Comuzzie A.G. Genetic and environmental contributions to cardiovascular risk factors in Mexican Americans. The San Antonio Family Heart Study. Circulation. 1996;94:2159–2170. doi: 10.1161/01.cir.94.9.2159. [DOI] [PubMed] [Google Scholar]
- 2.Frayling T.M., Timpson N.J., Weedon M.N., Zeggini E., Freathy R.M., Lindgren C.M., Perry J.R., Elliott K.S., Lango H., Rayner N.W. A common variant in the FTO gene is associated with body mass index and predisposes to childhood and adult obesity. Science. 2007;316:889–894. doi: 10.1126/science.1141634. [DOI] [PMC free article] [PubMed] [Google Scholar]
- 3.Wellcome Trust Case Control Consortium Genome-wide association study of 14,000 cases of seven common diseases and 3,000 shared controls. Nature. 2007;447:661–678. doi: 10.1038/nature05911. [DOI] [PMC free article] [PubMed] [Google Scholar]
- 4.Pekkanen J., Linn S., Heiss G., Suchindran C.M., Leon A., Rifkind B.M., Tyroler H.A. Ten-year mortality from cardiovascular disease in relation to cholesterol level among men with and without preexisting cardiovascular disease. N. Engl. J. Med. 1990;322:1700–1707. doi: 10.1056/NEJM199006143222403. [DOI] [PubMed] [Google Scholar]
- 5.Saxena R., Voight B.F., Lyssenko V., Burtt N.P., de Bakker P.I., Chen H., Roix J.J., Kathiresan S., Hirschhorn J.N., Daly M.J. Genome-wide association analysis identifies loci for type 2 diabetes and triglyceride levels. Science. 2007;316:1331–1336. doi: 10.1126/science.1142358. [DOI] [PubMed] [Google Scholar]
- 6.Caulfield M., Munroe P., Pembroke J., Samani N., Dominiczak A., Brown M., Benjamin N., Webster J., Ratcliffe P., O'Shea S. Genome-wide mapping of human loci for essential hypertension. Lancet. 2003;361:2118–2123. doi: 10.1016/S0140-6736(03)13722-1. [DOI] [PubMed] [Google Scholar]
- 7.Friedewald W.T., Levy R.I., Fredrickson D.S. Estimation of the concentration of low-density lipoprotein cholesterol in plasma, without use of the preparative ultracentrifuge. Clin. Chem. 1972;18:499–502. [PubMed] [Google Scholar]
- 8.Levey A.S., Bosch J.P., Lewis J.B., Greene T., Rogers N., Roth D. A more accurate method to estimate glomerular filtration rate from serum creatinine: A new prediction equation. Modification of diet in renal disease study group. Ann. Intern. Med. 1999;130:461–470. doi: 10.7326/0003-4819-130-6-199903160-00002. [DOI] [PubMed] [Google Scholar]
- 9.Orrell D.H. Albumin as an aid to the interpretation of serum calcium. Clin. Chim. Acta. 1971;35:483–489. doi: 10.1016/0009-8981(71)90224-5. [DOI] [PubMed] [Google Scholar]
- 10.Tobin M.D., Raleigh S.M., Newhouse S., Braund P., Bodycote C., Ogleby J., Cross D., Gracey J., Hayes S., Smith T. Association of WNK1 gene polymorphisms and haplotypes with ambulatory blood pressure in the general population. Circulation. 2005;112:3423–3429. doi: 10.1161/CIRCULATIONAHA.105.555474. [DOI] [PubMed] [Google Scholar]
- 11.Spector T.D., Williams F.M. The UK Adult Twin Registry (TwinsUK) Twin Res. Hum. Genet. 2006;9:899–906. doi: 10.1375/183242706779462462. [DOI] [PubMed] [Google Scholar]
- 12.Andrew T., Hart D.J., Snieder H., de Lange M., Spector T.D., MacGregor A.J. Are twins and singletons comparable? A study of disease-related and lifestyle characteristics in adult women. Twin Res. 2001;4:464–477. doi: 10.1375/1369052012803. [DOI] [PubMed] [Google Scholar]
- 13.Clayton D., Leung H.T. An R package for analysis of whole-genome association studies. Hum. Hered. 2007;64:45–51. doi: 10.1159/000101422. [DOI] [PubMed] [Google Scholar]
- 14.Team RDC (2007) R: A language and environment for statistical computing.
- 15.Stuart A., Ord K., Arnold S. Kendall's Advanced Theory of Statistics. A Hodder Arnold; London: 1999. Linear regression and correlation; pp. 486–488. [Google Scholar]
- 16.Devlin B., Roeder K., Bacanu S.A. Unbiased methods for population-based association studies. Genet. Epidemiol. 2001;21:273–284. doi: 10.1002/gepi.1034. [DOI] [PubMed] [Google Scholar]
- 17.Burton P.R., Tiller K.J., Gurrin L.C., Cookson W.O., Musk A.W., Palmer L.J. Genetic variance components analysis for binary phenotypes using generalized linear mixed models (GLMMs) and Gibbs sampling. Genet. Epidemiol. 1999;17:118–140. doi: 10.1002/(SICI)1098-2272(1999)17:2<118::AID-GEPI3>3.0.CO;2-V. [DOI] [PubMed] [Google Scholar]
- 18.Spielgelhalter, D., Thomas, A., and Best, N. (2003). winBUGS Version 4 - User Manual, Cambridge.
- 19.Allison D.B., Heo M., Kaplan N., Martin E.R. Sibling-based tests of linkage and association for quantitative traits. Am. J. Hum. Genet. 1999;64:1754–1763. doi: 10.1086/302404. [DOI] [PMC free article] [PubMed] [Google Scholar]
- 20.Thomas D.C., Clayton D.G. Betting odds and genetic associations. J. Natl. Cancer Inst. 2004;96:421–423. doi: 10.1093/jnci/djh094. [DOI] [PubMed] [Google Scholar]
- 21.Todd J.A., Walker N.M., Cooper J.D., Smyth D.J., Downes K., Plagnol V., Bailey R., Nejentsev S., Field S.F., Payne F. Robust associations of four new chromosome regions from genome-wide analyses of type 1 diabetes. Nat. Genet. 2007;39:857–864. doi: 10.1038/ng2068. [DOI] [PMC free article] [PubMed] [Google Scholar]
- 22.Zeggini E., Weedon M.N., Lindgren C.M., Frayling T.M., Elliott K.S., Lango H., Timpson N.J., Perry J.R., Rayner N.W., Freathy R.M. Replication of genome-wide association signals in UK samples reveals risk loci for type 2 diabetes. Science. 2007;316:1336–1341. doi: 10.1126/science.1142364. [DOI] [PMC free article] [PubMed] [Google Scholar]
- 23.Kile B.T., Panopoulos A.D., Stirzaker R.A., Hacking D.F., Tahtamouni L.H., Willson T.A., Mielke L.A., Henley K.J., Zhang J.G., Wicks I.P. Mutations in the cofilin partner Aip1/Wdr1 cause autoinflammatory disease and macrothrombocytopenia. Blood. 2007;110:2371–2380. doi: 10.1182/blood-2006-10-055087. [DOI] [PMC free article] [PubMed] [Google Scholar]
- 24.van Dijk K.W., Rensen P.C., Voshol P.J., Havekes L.M. The role and mode of action of apolipoproteins CIII and AV: Synergistic actors in triglyceride metabolism? Curr. Opin. Lipidol. 2004;15:239–246. doi: 10.1097/00041433-200406000-00002. [DOI] [PubMed] [Google Scholar]
- 25.Otarod J.K., Goldberg I.J. Lipoprotein lipase and its role in regulation of plasma lipoproteins and cardiac risk. Curr. Atheroscler. Rep. 2004;6:335–342. doi: 10.1007/s11883-004-0043-4. [DOI] [PubMed] [Google Scholar]
- 26.Samani N.J., Erdmann J., Hall A.S., Hengstenberg C., Mangino M., Mayer B., Dixon R.J., Meitinger T., Braund P., Wichmann H.E. Genomewide association analysis of coronary artery disease. N. Engl. J. Med. 2007;357:443–453. doi: 10.1056/NEJMoa072366. [DOI] [PMC free article] [PubMed] [Google Scholar]
- 27.World Health Organization . World Health Organization; Geneva: 2002. The World Health Report 2002: Reducing Risks, Promoting Healthy Life. pp. 58–60. [Google Scholar]
- 28.Lo P.K., Chen J.Y., Lo W.C., Chen B.F., Hsin J.P., Tang P.P., Wang F.F. Identification of a novel mouse p53 target gene DDA3. Oncogene. 1999;18:7765–7774. doi: 10.1038/sj.onc.1203167. [DOI] [PubMed] [Google Scholar]
- 29.Thompson M.D., Monga S.P. WNT/beta-catenin signaling in liver health and disease. Hepatology. 2007;45:1298–1305. doi: 10.1002/hep.21651. [DOI] [PubMed] [Google Scholar]
- 30.Hsieh P.C., Chang J.C., Sun W.T., Hsieh S.C., Wang M.C., Wang F.F. p53 downstream target DDA3 is a novel microtubule-associated protein that interacts with end-binding protein EB3 and activates beta-catenin pathway. Oncogene. 2007;26:4928–4940. doi: 10.1038/sj.onc.1210304. [DOI] [PubMed] [Google Scholar]
- 31.Vincent J.B., Skaug J., Scherer S.W. The human homologue of flamingo, EGFL2, encodes a brain-expressed large cadherin-like protein with epidermal growth factor-like domains, and maps to chromosome 1p13.3-p21.1. DNA Res. 2000;7:233–235. doi: 10.1093/dnares/7.3.233. [DOI] [PubMed] [Google Scholar]
- 32.Bansal S., Buring J.E., Rifai N., Mora S., Sacks F.M., Ridker P.M. Fasting compared with nonfasting triglycerides and risk of cardiovascular events in women. JAMA. 2007;298:309–316. doi: 10.1001/jama.298.3.309. [DOI] [PubMed] [Google Scholar]
- 33.Nordestgaard B.G., Benn M., Schnohr P., Tybjaerg-Hansen A. Nonfasting triglycerides and risk of myocardial infarction, ischemic heart disease, and death in men and women. JAMA. 2007;298:299–308. doi: 10.1001/jama.298.3.299. [DOI] [PubMed] [Google Scholar]
- 34.Yang Q., Guo C.Y., Cupples L.A., Levy D., Wilson P.W., Fox C.S. Genome-wide search for genes affecting serum uric acid levels: The Framingham Heart Study. Metabolism. 2005;54:1435–1441. doi: 10.1016/j.metabol.2005.05.007. [DOI] [PubMed] [Google Scholar]
- 35.Phay J.E., Hussain H.B., Moley J.F. Cloning and expression analysis of a novel member of the facilitative glucose transporter family, SLC2A9 (GLUT9) Genomics. 2000;66:217–220. doi: 10.1006/geno.2000.6195. [DOI] [PubMed] [Google Scholar]
- 36.Anzai N., Kanai Y., Endou H. New insights into renal transport of urate. Curr. Opin. Rheumatol. 2007;19:151–157. doi: 10.1097/BOR.0b013e328032781a. [DOI] [PubMed] [Google Scholar]
- 37.Sundstrom J., Sullivan L., D'Agostino R.B., Levy D., Kannel W.B., Vasan R.S. Relations of serum uric acid to longitudinal blood pressure tracking and hypertension incidence. Hypertension. 2005;45:28–33. doi: 10.1161/01.HYP.0000150784.92944.9a. [DOI] [PubMed] [Google Scholar]
- 38.Perlstein T.S., Gumieniak O., Williams G.H., Sparrow D., Vokonas P.S., Gaziano M., Weiss S.T., Litonjua A.A. Uric acid and the development of hypertension: The normative aging study. Hypertension. 2006;48:1031–1036. doi: 10.1161/01.HYP.0000248752.08807.4c. [DOI] [PubMed] [Google Scholar]
- 39.Nakanishi N., Okamoto M., Yoshida H., Matsuo Y., Suzuki K., Tatara K. Serum uric acid and risk for development of hypertension and impaired fasting glucose or Type II diabetes in Japanese male office workers. Eur. J. Epidemiol. 2003;18:523–530. doi: 10.1023/a:1024600905574. [DOI] [PubMed] [Google Scholar]
- 40.Liese A.D., Hense H.W., Lowel H., Doring A., Tietze M., Keil U. Association of serum uric acid with all-cause and cardiovascular disease mortality and incident myocardial infarction in the MONICA Augsburg cohort. World Health Organization Monitoring Trends and Determinants in Cardiovascular Diseases. Epidemiology. 1999;10:391–397. doi: 10.1097/00001648-199907000-00006. [DOI] [PubMed] [Google Scholar]
- 41.Johnson R.J., Kang D.H., Feig D., Kivlighn S., Kanellis J., Watanabe S., Tuttle K.R., Rodriguez-Iturbe B., Herrera-Acosta J., Mazzali M. Is there a pathogenetic role for uric acid in hypertension and cardiovascular and renal disease? Hypertension. 2003;41:1183–1190. doi: 10.1161/01.HYP.0000069700.62727.C5. [DOI] [PubMed] [Google Scholar]
Associated Data
This section collects any data citations, data availability statements, or supplementary materials included in this article.