

Summary
The crystal structure of the yeast SLN1 response regulator domain bound to both a phosphoryl analog (BeF3−) and Mg2+ ion in complex with its downstream phosphorelay signaling partner YPD1 has been determined at a resolution of 1.70 Å. Comparisons between the beryllium fluoride-activated complex and the unliganded (or apo) complex determined previously reveal modest but important differences. The SLN1-R1•Mg2+•BeF3− structure from the complex provides evidence for the first time that the mechanism of phosphorylation-induced activation is highly conserved between bacterial response regulator domains and this example from a eukaryotic organism. Residues in and around the active site undergo slight rearrangements in order to form bonds to the essential divalent cation and fluorine atoms of BeF3−. Two conserved switch-like residues (Thr 1173 and Phe 1192) occupy distinctly different positions in the apo- versus BeF3−-bound structures consistent with the “Y-T” coupling mechanism proposed for activation of CheY and other bacterial response regulators. Several loop regions and the α4-β5-α5 surface of the SLN1-R1 domain undergo subtle conformational changes (∼1-3 Å displacements relative to the apo-structure) that lead to significant changes in terms of contacts that are formed with YPD1. Detailed structural comparisons of protein-protein interactions in the apo- and BeF3−-bound complexes suggest at least a two-state equilibrium model for formation of a transient encounter complex, in which phosphorylation of the response regulator promotes the formation of a phosphotransfer-competent complex. In the BeF3−-activated complex, the position of His 64 from YPD1 is within ideal distance and near linear geometry with Asp 1144 from the SLN1-R1 domain for phosphotransfer to occur. The ground state structure presented here suggests that phosphoryl transfer will likely proceed through an associative mechanism involving formation of a pentacoordinate phosphorus intermediate.
Keywords: histidine-containing phosphotransfer (HPt) domain, response regulator, two-component signal transduction, phosphoryl analog, beryllium fluoride (BeF3−)
Introduction
In two-component regulatory systems1, phosphoryl transfer between a sensor histidine kinase (HK) and its cognate response regulator (RR) is the chemical basis for signal transduction. Multi-step His-Asp phosphorelay signaling systems have evolved from the simpler two-component systems and are typically composed of a hybrid HK containing a C-terminal RR domain that transmits signals to a histidine-containing phosphotransfer (HPt) protein, which then relays phosphoryl groups to downstream RRs1-3. Phosphorylation of the cytoplasmic RRs results in activation of either associated effector domains or downstream signaling partners.
While structures of RR proteins (or domains) in their unphosphorylated inactive states have been well documented, structural studies of phosphorylated RRs have been somewhat limited due to the intrinsic lability of the phospho-aspartyl linkage. However, there have been numerous reports in recent years describing the use of beryllium fluoride, a non-covalent mimic of the phosphoryl group, in order to obtain NMR or X-ray structures of stably activated RR domains (reviewed in3-5). These have shown that phosphorylation of a conserved aspartate residue and binding of an essential divalent cation induces localized structural rearrangements within the active site of RR domains that lead to subtle long range conformational changes affecting primarily one surface of the protein. RR domains have a central five-stranded β-sheet surrounded by five α-helices (overall α5/β5 fold). Three carboxylate-containing residues, including the aspartic acid that is the site of phosphorylation, and an invariant lysine residue comprise the active site located at the C-terminal edge of the central β-sheet. Two additional highly conserved residues in the vicinity of the active site (Thr/Ser from β4 and Tyr/Phe from β5) have been implicated as switch-type residues that occupy distinctly different positions in the phosphorylated RR in comparison to the unphosphorylated state. Hence, the orientation of these two residues is highly indicative of whether the RR is in an active or inactive conformation. The combined effect of the active site rearrangement upon phosphorylation and the so-called “Y-T” conformational coupling of the switch residues results in a modest alteration of the α4-β5-α5 surface of the protein6-8. Despite the growing numbers of RR domain structures that support a simple two-state model, there are two notable exceptions9,10, suggesting the possibility that multiple conformational states occur along the pathway to RR activation.
Small molecule phosphodonors, such as acetyl phosphate and phosphoramidate, have also been used to phosphorylate RRs in vitro11,12. However, the observed rate of phosphorylation is several orders of magnitude slower than if the cognate HK or HPt protein served as the phosphodonor13-15. A similar rate difference was exploited as a means for differentiating cognate from non-cognate HK-RR and HPt-RR pairs in a phosphotransfer profiling assay16,17. This raises two important questions: how do cognate HK, HPt and RR proteins specifically interact with each other and what aspect(s) of the association contribute to phosphotransfer efficiency?
To date, there are only two examples of structures of RR domains in complex with their cognate HPt protein, namely Spo0B/Spo0F10,18 and YPD1/SLN1-R119. No high resolution structures have been determined, thus far, of complexes between an HK and RR. The reason for the paucity of structural and biochemical data on RR/HPt and RR/HK interactions most likely stems from the transient and presumably weak nature of the interaction, which is typical of signaling partners, and the additional influence that phosphorylation may have on recognition and/or binding.
In the yeast Sacchromyces cerevisiae, YPD1 functions as an HPt protein that shuttles phosphoryl groups to and from three homologous RR domains associated with SLN1, SSK1 and SKN7 (referred to as SLN1-R1, SSK1-R2 and SKN7-R3, respectively). In the osmoregulatory branch of this phosphorelay system (SLN1-YPD1-SSK1), YPD1 serves two important functions by mediating phosphoryl group transfer between the hybrid HK SLN1 and the SSK1 RR and by stabilizing the phosphorylated state of SSK120,21. In its phosphorylated state, SSK1 is incapable of activating the downstream mitogen-activated protein (MAP) kinase cascade and therefore inhibits signaling via the high osmolarity glycerol response (HOG) MAP kinase cascade under normal growth conditions.
We previously reported the first structure of a monomeric HPt domain (YPD1) in complex with its upstream phosphodonor, the SLN1-R1 domain19. Two crystal forms were obtained (P32 and P212121 space groups) that differed slightly in the relative orientation of YPD1 with respect to the SLN1-R1 domain. The P212121 crystal form appeared to be favored when beryllium fluoride was included in the crystallization condition22, and from the structure of this complex we observed the two active sites to be better aligned than the P32 complex for phosphoryl transfer to occur. However, in the YPD1/SLN1-R1 complex, we did not observe electron density for the phosphoryl analog, BeF3− or for the divalent metal ion.
Recently, Varughese et al. published the 3.05 Å structure of Mg2+- and BeF3−-bound Spo0F in complex with the dimeric Spo0B HPt protein10. This complex revealed a snapshot of a pre-transition state complex just prior to phosphotransfer. Here we report the crystal structure of beryllium fluoride- and magnesium ion-bound SLN1 RR domain (SLN1-R1) in complex with the HPt protein YPD1 at 1.70 Å resolution. This structure also represents a pre-transition state interaction between “activated” SLN1-R1 and YPD1 and allows for a detailed analysis of the active site configuration, protein-protein interactions, and mechanism of phosphotransfer between HPt and RR proteins. Furthermore, because of the high degree of structural homology among HPt proteins and within the RR superfamily, the yeast YPD1/SLN1-R1•Mg2+•BeF3− quaternary complex can serve as a model for studies of other HPt protein-RR complexes in other organisms.
Results
Overall structure of the quaternary complex
The YPD1/SLN1-R1•Mg2+•BeF3− complex was formed by soaking ammonium sulfate grown YPD1/SLN1-R1 apo crystals22 in a buffered PEG solution containing MgCl2, BeCl2 and NaF. The exchange of ammonium sulfate with PEG served two purposes in that it removed a sulfate molecule bound at the active site in the apo-crystal complex 19 and allowed the introduction of an essential Mg2+ ion23. The Fo–Fc difference electron density map (Figure 1) showed clear evidence of an octahedrally-coordinated metal ion and density consistent with beryllium fluoride bound to Asp 1144 with tetrahedral geometry. The asymmetric unit consists of a 1:1 complex between YPD1 (full-length, residues 2-167) and SLN1-R1 (residues 1086-1218) bound to one BeF3− molecule and one Mg2+ ion. The model of this quaternary complex was refined to a resolution of 1.70 Å with a final crystallographic R-factor of 19.6% (Rfree = 23.9%) (Table 1). In Ramachandran plots, generated by the PROCHECK program24, 97.8% of residues occupy favored or allowable regions. Only 6 residues, 2.2 % of the model, are in the disallowed region of the Ramachandran plot because of their locations within turns. Electron density was not observed for the first two and final two residues of the SLN1-R1 expressed protein. A number of surface-exposed residues showed electron density for multiple side chain conformations and were therefore modeled as such with partial occupancy. In addition, Tyr 1165 of SLN1-R1 (located on the α3-β4 loop on the opposite face of the molecule from the active site) had additional electron density within 2.0 Å of the side chain hydroxyl that we tentatively interpret to be a sodium ion.
Figure 1.

Stereoview of the Fo-Fc map calculated with active site residues omitted and contoured at 3σ. The final model of the SLN1-R1 active site residues in the presence of Mg2+ and BeF3− is displayed within the electron density (YPD1 has been omitted for clarity). SLN1-R1 carbons are yellow with oxygens and nitrogens colored red and blue, respectively. The magnesium ion is green, beryllium is light green and fluorine atoms light blue. Red spheres represent water molecules.
Table 1.
X-ray Data Collection and Refinement Statistics
| A. Crystal parameters | |
| Space group | P212121 |
| Unit cell dimensions (Å) | 52.01, 75.54, 98.39 |
| Matthews' coefficient (Å3/Da) | 2.81 |
| Solvent content (%) | 56.2 |
| B. Data Collection | |
| Beamline at Brookhaven NSLS | X12B |
| Wavelength (Å) | 0.900 |
| Temperature (K) | 100 |
| Resolution (Å) | 1.70 |
| No. of observations | 313590 |
| Unique reflections | 51408 |
| Multiplicity | 6.1 |
| Completeness (%) | 99.9 (99.9) |
| Mean I/σ(I) | 27.0 (3.62) |
| Rmerge (%)a | 4.8 (39.0) |
| C. Refinement | |
| Resolution range (Å) | 20.00 – 1.70 |
| No. of protein atoms | 2292 |
| No. of heteroatoms | 258 (252 H2O, BeF3−, Mg2+, Na+) |
| Avg. B-factors (Å2) | 37.6 |
| R-factor (%)b | 19.6 (31.2) |
| R-free (%)c | 23.9 (39.1) |
| Rmsd bond lengths (Å) | 0.032 |
| Rmsd bond angles (°) | 2.492 |
| Ramachandran plot | |
| Most favored region (%) | 90.1 |
| Additionally allowed region (%) | 6.9 |
| Generously allowed region (%) | 0.7 |
| Disallowed region (%) | 2.2 |
Rmerge = Σ (I-<I>) / Σ(I), where I is the intensity measurement for a given reflection and <I> is the average intensity for multiple measurements of this reflection.
Values in parentheses are for the highest resolution shell.
R-factor = Σ | | Fobs | - | Fcal | | / | ΣFobs |, where Fobs and Fcal are the observed and calculated structure factor amplitudes, respectively.
Rfree was calculated with 5% of the diffraction data randomly selected and not used throughout refinement.
The overall structure of the YPD1/SLN1-R1•Mg2+•BeF3− complex is very similar to the P212121 YPD1/SLN1-R1 apo complex solved previously19. The root mean square deviations (rmsd) for Cα atoms, as determined by LSQMAN25, for the individually superimposed proteins were 0.594 Å and 0.984 Å for YPD1 and SLN1-R1, respectively. YPD1 retains its all-helical structure26 with surface-exposed residues from the αA, αB, αC, and αD helices forming a primarily hydrophobic docking site for SLN1-R1. A ribbon diagram showing the relative orientation of the two proteins in complex with each other is shown in Figure 2. The modest differences that we observe between this complex and the previously reported apo complex19 appear to be directly attributable to the binding of the essential Mg2+ ion and BeF3− to the SLN1-R1 domain (detailed below).
Figure 2.

Global view of the YPD1/SLN1-R1•Mg2+•BeF3− quaternary complex. YPD1 is displayed in a green ribbon representation with His 64 shown in stick model. The SLN1-R1 domain is shown in yellow with Asp 1144 and the bound BeF3− displayed in sticks. The transparent surfaces of the two proteins are shown in their respective colors to illustrate the high degree of surface complimentarity at the interface.
Mg2+/BeF3− induced changes that affect YPD/SLN1-R1 interactions
The major difference observed in the relative orientation of the two proteins upon binding of Mg2+ and BeF3− is a 2.2 Å rigid-body shift of YPD1 with respect to SLN1-R1 (Figure 3A). This realignment of YPD1 positions the active site His 64 side chain within ideal distance (3.13 Å) and near linear geometry of Asp 1144 of SLN1-R1 for phosphotransfer to occur (Figure 3B). In addition, there is a slight reduction in the overall size of the buried surface area at the interface from 970 Å2 in the apo complex to 949 Å2 in the Mg2+/BeF3− bound complex, a decrease of 2.2% of the surface area based on calculations using AREAIMOL in the CCP4 program suite27. The program LIGPLOT28 as well as the PISA webserver29 were used to determine the specific residues that are involved in forming hydrophobic, hydrogen bond or ionic interactions between the two proteins in both the apo complex and the Mg2+/BeF3− bound complex. A list of the specific interactions is provided as Supplementary Information (Table 2).
Figure 3.
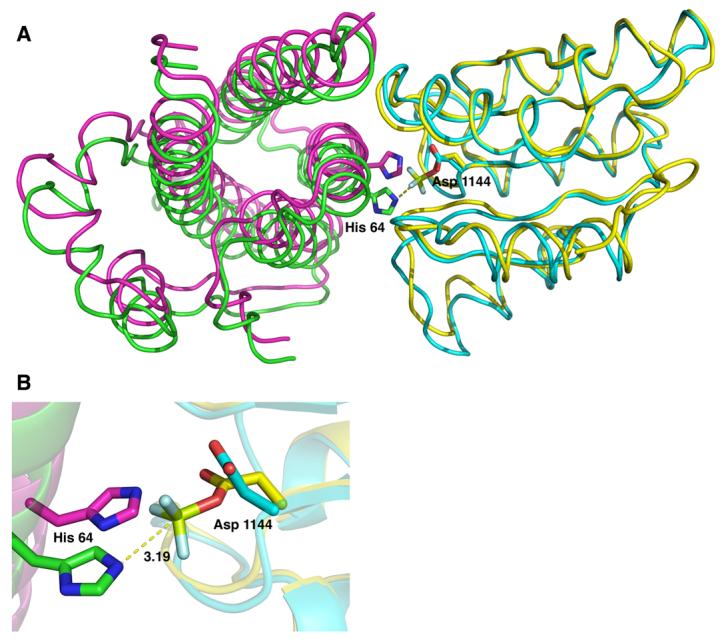
Superposition of the YPD1/SLN1-R1•Mg2+•BeF3− quaternary complex (YPD1 in green and SLN1-R1 in yellow) and the YPD1/SLN1-R1 apo complex (in magenta and cyan, respectively). A) Top view of the overlayed structures in which the αA helix of YPD1 was removed for clarity. BeF3− is shown in light green and light blue. The alignment was performed using the first 50 residues of SLN1-R1 because there is little difference in these residues between the two complexes. The rigid body shift in YPD1 from the apo complex (magenta) to the BeF3−-bound complex (green) is approximately 2.2 Å and allows for the alignment of the active site residues for phosphotransfer. B) Close-up view of the superimposed complexes showing the active site residues His 64 from YPD1 and Asp 1144 from SLN1-R1. The distance from the His 64 Nε2 atom to the beryllium atom (light green) is 3.19 Å.
In the Mg2+/BeF3− bound complex, there are a total of 26 hydrophobic contacts, a dramatic increase from the 16 observed in the apo complex (Figure 4 and Supplementary Table 2). The number of polar interactions, however, remained about the same (9 H bond interactions and 1 salt-bridge in the Mg2+/BeF3− bound complex, 10 H bonds and 1 salt-bridge in the apo complex). An additional 6 water-mediated H bonds were observed in the Mg2+/BeF3− bound complex, whereas the apo complex had only 2 water-mediated contacts at the interface. Figure 4 highlights the interfacial contacts that are new or altered in the Mg2+/BeF3−-bound complex in comparision to the structure of the apo complex.
Figure 4.
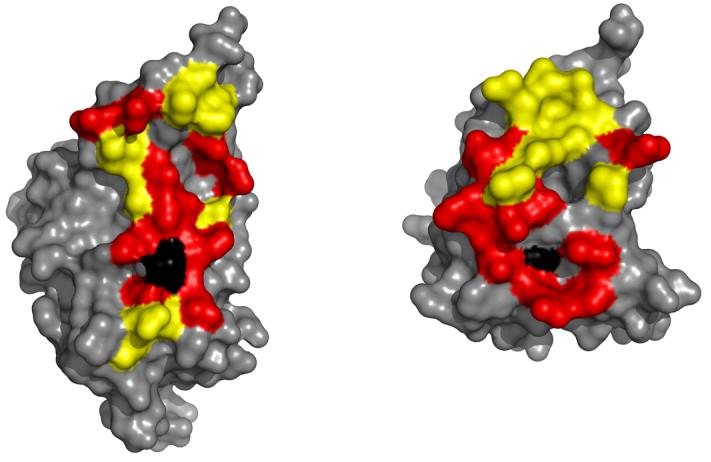
Surface maps of YPD1 (left) and SLN1-R1 (right) separated in order to illustrate areas of protein-protein interaction. Yellow represents contact regions that are conserved in the apoand BeF3− -bound complexes, whereas red represents areas of contact that are new or altered in the BeF3− -bound complex (specific contacts are listed in Supplementary Table 2). The black color highlights the positions of the phosphorylatable residues His 64 in YPD1 (left) and Asp 1114 in SLN1-R1 (right).
Mg2+/BeF3− induced changes that affect the SLN1 response regulator domain
The essential Mg2+ ion is bound in the active site of SLN1-R1 with near perfect octahedral geometry (Figure 5). The metal ion is bound to two water molecules (2.06 Å, 2.12 Å), the backbone O of Gln 1146 (2.14 Å), Oδ2 of Asp 1144 (2.05 Å), Oδ2 of Asp1095 (1.99 Å), and F1 of beryllium fluoride (2.04 Å). There are several rearrangements that occur in and around the active site upon binding of Mg2+. In order for the backbone O of Gln 1146 to form a direct bond to the metal ion (Figure 5), the entire β3-α3 loop shifts by ∼1 Å in comparison to the apo complex (Figure 6). In addition, the movement of Asp 1095 in coordinating to the metal ion and Glu 1094 to form a water-mediated contact to the metal ion, alters the conformation of the β1-α1 loop and the N-terminus of α1 helix (Figure 6).
Figure 5.
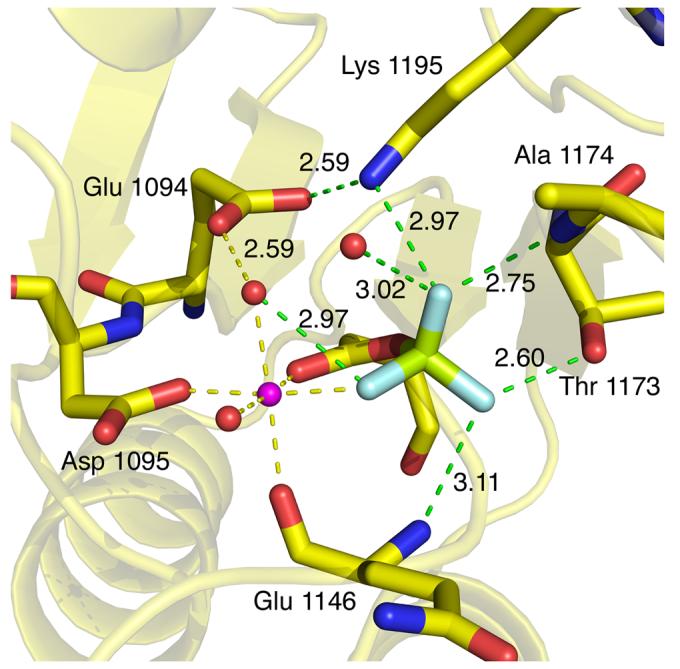
Close up view of the active site with important sidechains and distances labeled. SLN1-R1 carbons are yellow with oxygens and nitrogens colored red and blue, respectively; BeF3− is light green and light blue, Mg2+ is magenta, and waters are red. Mg2+ coordination bonds are shown in yellow and the distances range from 1.99 Å to 2.14 Å. Bonds to the BeF3− atoms are shown in green with the bond lengths indicated in angstroms.
Figure 6.
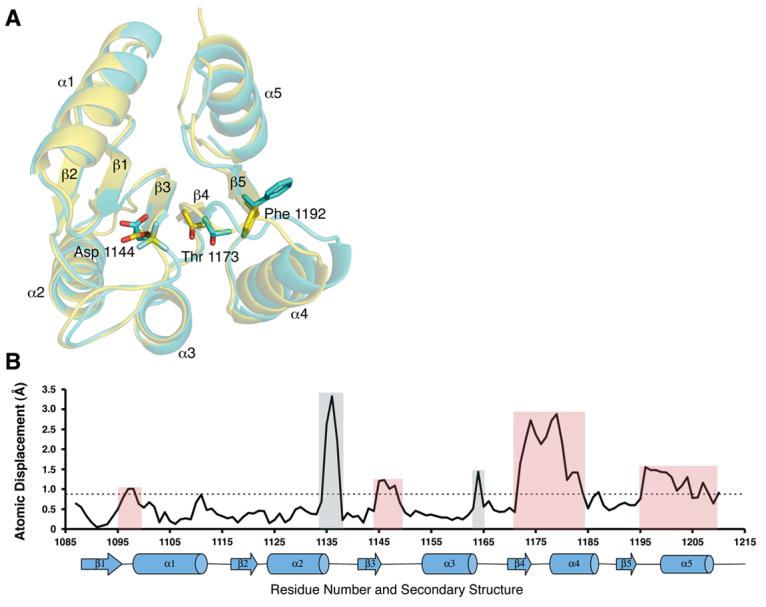
A) Superposition of the SLN1-R1 proteins from the BeF3− -bound complex (yellow) and the apo complex (cyan) showing the site of phosphorylation (Asp 1144) and the residues that undergo a shift in position upon binding of BeF3−. Thr 1173 and Phe 1192 are the two switch residues in the SLN1-R1 protein that occupy distinctly different positions in the active vs. inactive conformation. In the unphosphorylated state, Phe 1192 is exposed to solvent (cyan). Upon binding of BeF3−, Thr 1173 shifts 2.3 Å toward the bound BeF3− and vacates space that allows Phe 1192 to rotate 90° toward the active site and adopt the active conformation (yellow). B) Plot of the rmsd for the Cα atoms of SLN1-R1 upon binding of BeF3−. The x-axis is residue number and y-axis is atomic displacement in angstroms. Below the residue numbers is the secondary structure of the protein with α-helices shown as cylinders and β-strands shown as arrows. The dashed line represents the average rmsd for the whole protein (0.9 Å). Colored boxes separate the peaks into two groups. Red boxes are changes that are directly applicable to the binding of BeF3− or Mg2+. Gray boxes are the result of the higher resolution of the BeF3− bound structure that allowed for better modeling of the loop regions that were not as well defined in the apo complex.
The phosphoryl mimic, BeF3−, binds to the Oδ1 atom of the active site aspartate (Asp 1144). In comparison to the apo complex the Oδ1 atom of Asp 1144 is shifted about 1.6 Å and rotated downward (∼60°) about the Cα-Cβ bond (Figure 3B). This change in position, along with the displacement of the sulfate ion from the active site, sets up near ideal geometry for phosphotransfer, with an angle of 163° from Oδ1 of Asp 1144 to the Be atom to Nε2 of His 64 on YPD1. The binding of BeF3− is stabilized by a network of hydrogen bonds and a direct bond to the magnesium ion (Figure 5). The F1 atom forms a water-mediated contact to Glu 1094 and is also coordinated directly to the Mg2+ ion. The F2 atom forms H bonds to the Oγ1 atom of Thr 1173 and the backbone N of Gln 1146. The F3 atom forms H bonds to the Nζ atom of Lys 1195 and the backbone N of Ala 1174. In comparison to the apo structure, several significant conformational changes occur upon binding BeF3− that are consistent with what has been observed in a significant number of bacterial phosphorylated- or BeF3−-activated RR domains8,30-40. Specifically, Thr 1173 undergoes a shift in its Cα position of 2.23 Å in order for its side chain Oγ1 atom to bond to one of the fluorine atoms of BeF3− (Figures 5 and 6). This movement allows the other so-called “switch residue”, Phe 1192, to rotate ∼90° inward toward the active site into a solvent inaccessible conformation. Because of the extended nature of the loop region immediately following Thr 1173, residues in this loop (β4-α4) as well as in the α4 helix exhibit the most significant shifts in Cα position between 1-3 Å (Figure 6). The conformational change associated with the interaction of the Nζ atom of Lys 1195 with the F3 atom of BeF3− causes a shift in the β5-α5 loop and is partially responsible for the ∼1.5 Å shift seen in the α5 helix (Figure 6B). The movement of Thr 1173 towards the active site brings Leu 1172 into hydrophobic contact with Ile 1197, and this appears to play a role in the displacement of the α5 helix. Other differences in backbone displacements (gray-shaded areas in Figure 6B) are attributed to the higher resolution of the BeF3−-bound structure, which allowed for better modeling of two loop areas (residues 1134-1138 and 1163-1165) that were not as well defined in the apo complex.
Discussion
Effect of BeF3− binding on YPD1/SLN1-R1 interactions
The YPD1/SLN1-R1•Mg2+•BeF3− complex described herein is the first report of a high resolution structure of an HPt protein-RR complex in an “activated” state due to the presence of the phosphoryl analog beryllium fluoride. In comparison to the apo-complex, the largest global change observed is a rigid body shift of 2.2 Å in the orientation of YPD1 with respect to SLN1-R1. Conformational changes in SLN1-R1 induced by the binding of Mg2+ and BeF3− also contribute to a significant number of new or altered protein-protein interactions observed in comparison to the apo-complex (Figure 4 and Supplementary Table 2). In contrast, very few changes were observed for the Spo0B/Spo0F•Mg2+•BeF3− complex (PDB ID 2FTK) relative to the inactive state (PDB ID 1F51)10. Superposition of the two structures revealed only ∼0.5 Å rmsd for backbone atoms and a net increase of one hydrophobic interaction.
It is noteworthy that multiple binding modes (two different space groups) were observed for the apo-complex19, and in the BeF3−-activated complex most of the new or altered contacts formed between the two proteins are centered around the active site residues (His 64, Asp1144) (Figure 4). This supports the notion that an equilibrium may exist in solution that involves formation of transient non-specific “encounter complexes” that can then reorient in a more optimal binding mode resulting in a functionally competent complex41,42. Furthermore, the subtle differences that we observe in complexes of YPD1 and SLN1-R1 in the presence and absence of a phosphoryl analog suggest that fine tuning of protein-protein interactions may contribute to signaling specificity in two-component systems.
Mg2+/BeF3−-induced conformational changes in SLN1-R1
From structural studies of phosphorylated or BeF3−-activated bacterial response regulator domains8,30-40, a common mechanism of activation has emerged involving a concerted shift in position of a conserved Thr (or Ser) residue and a conserved aromatic residue (Tyr or Phe) towards the active site which results in alterations of the α4-β5-α5 surface area. The BeF3−-bound SLN1-R1 structure reported here provides evidence for the first time that the same mechanism of activation is conserved in eukaryotic RR domains as well. Also required for phosphotransfer is a Mg2+ ion in the active site to neutralize the charge of the phosphoryl group or in this case BeF3−, in the active site. As shown in Figure 5, three protein atoms, two water molecules and a F1 atom from BeF3− form bonds to the Mg2+ ion in nearly perfect octahedral geometry. In the presence of BeF3−, other residues also shift position to form direct contacts to F2 and F3, notably Lys 1195, Thr 1173, Ala 1174 and Gln 1146. The largest change in position observed between the apo- and bound-complexes is the movement of the Thr 1173 side chain ∼2.3 Å towards the active site in order to directly interact with BeF3− (Figures 5 and 6). In addition, there is ∼90° rotation of the Phe 1192 side chain from an outward facing, solvent-exposed position to an inward-facing solvent inaccessible position (Figure 6). These changes are consistent with the proposed two-state equilibrium model involving a concerted movement of two switch-like residues (Ser/Thr from β4 and Tyr/Phe from β5) indicative of RR domain activation8.
In terms of the combined effects of binding of Mg2+/BeF3− to SLN1-R1, we observe no obvious changes to the electrostatic surface and no net increase in the hydrophobic surface area. However, a slightly lower gap index43 can be calculated for the Mg2+/BeF3−-bound YPD1/SLN-R1 complex, which is indicative of a slightly higher degree of surface complementarity. Overall, there does not appear to be dramatic changes in the molecular surfaces of the two proteins, rather slight changes in contact residues at the interface and the orientation of the two proteins relative to each other (Figures 3 and 4) results in a more optimal fit for phosphoryl transfer.
Mechanism of phosphoryl group transfer
The combined effects of Mg2+ and BeF3− binding to the SLN1-R1 domain alter the way in which it binds to YPD1 and result in an almost linear alignment of the active site residues for productive phosphotransfer. The observed angle between the nitrogen atom (Nε2) of YPD1, the beryllium atom and the SLN1 Asp 1144 oxygen atom (Oδ2) is 163°, very close to the ideal linear alignment required for phosphoryl transfer44.
It was first proposed by Mildvan in 1979 that for the transfer of a phosphoryl group using an associative mechanism, the attacking nucleophile and the electrophile were required to be within 3.3 Å of each other44,45. In support of a dissociative mechanism, the same atoms must be ≥ 4.9 Å apart in order to accommodate a metaphosphate intermediate. In the beryllium fluoride-bound YPD1/SLN1-R1 complex, the Nε2 atom of His 64 and the Be atom are 3.19 Å apart (Figure 3B), within the range required for an associative mechanism. Furthermore, for an associative mechanism there would be a larger charge distribution on the equatorial atoms of the transition state or reaction intermediate. Therefore the protein would have to provide electrophilic regions to neutralize the charge on those atoms. In the ground state or pre-transition state structure presented here, the bound Mg2+ ion as well as multiple hydrogen bond donors as seen in Figure 3B (Lys 1195, Thr 1173, two waters, and backbone nitrogen of Ala 1174) are proposed to supply the necessary charge neutralization.
Thus, based on the geometry of the active site residues and surrounding highly conserved residues, we believe the structure of the BeF3−-bound YPD1/SLN1-R1 complex supports an associative mechanism for phosphoryl group transfer, in agreement with the conclusion drawn from the activated Spo0F/Spo0B complex 10. We propose a model for a pentacoordinate trigonal bipyramidal transition state (Figure 7) in which charge neutralization by the Mg2+ ion, Lys 1195, Thr 1173 helps to facilitate formation and stabilization of the transition state.
Figure 7.

Proposed transition state structure representing an associative mechanism for phosphotransfer. Two sidechains from residues Lys 1195 and Thr 1173 and the Mg2+ ion are shown interacting with the equatorial oxygens to neutralize the negative charge on the pentacoordinate phosphorus intermediate.
In summary, the structure of the YPD1/SLN1•Mg2+•BeF3− complex allowed us to identify the changes that occur upon binding of a phosphoryl analog to the response regulator domain SLN1-R1 and how these changes affect the binding of SLN1-R1 to its phosphorelay signaling partner YPD1. We propose that phosphorylation of SLN1-R1 induces conformational changes, consistent with those observed in activated bacterial RR domains, which alters the manner in which P∼SLN1-R1 interacts with its downstream signaling partner YPD1. In the presence of the phosphoryl analog, SLN1-R1 appears to form a phosphotransfer-competent complex with YPD1 in which an associative mechanism for phosphoryl transfer is favored.
Materials and Methods
Protein expression, purification and crystallization
The Saccharomyces cerevisiae YPD1 (full-length) and SLN1-R1 (residues 1084-1220) proteins were over-expressed in Escherichia coli strain DH5α, purified and co-crystallized as descdribed previously22,46,47. Crystals of the apo complex were grown in 2.2 – 2.6 M ammonium sulfate, 50 mM sodium acetate (pH 5.6), under hanging drop vapor diffusion conditions at room temperature. The size of the crystals reached an average of 250 μm × 250 μm × 300 μm after about one week. They were transferred to 40% PEG 4000, 60 mM sodium acetate (pH 5.6), 20 mM MgCl2, 10 mM BeCl2 and 70 mM NaF and allowed to soak at room temperature for 10-12 hours. The soaked crystals were then flash frozen in liquid nitrogen or directly in a nitrogen cryostream at 100 K prior to data collection.
Data collection and processing
Crystals were initially screened at our in-house X-ray facility (RigakuMSC RUH3R generator, Raxis IV++ image plate detectors, and Oxford Series 700 cryosystem). Approximately 1 out of 10 crystals were of suitable quality for data collection and showed evidence of difference electron density in Fo-Fc maps in the vicinity of the active site residues. However, the resolution using our home X-ray source ranged only from 2.3-2.5 Å on the best crystals. Therefore, additional crystals were screened and the best were sent to the National Synchrotron Light Source (Beamline X12b) mail-in program at Brookhaven National Laboratory for higher resolution data collection. The data were collected in two passes from a single crystal using 0.900 Å wavelength radiation, first a high-resolution pass of 138 frames with a 1° oscillation and an exposure time of 40 seconds, then a low-resolution pass of 139 frames with a 1° oscillation and an exposure time of 40 seconds. The images were merged and processed with HKL2000 48. The X-ray data collection and processing statistics are listed in Table 1.
Structure determination and refinement
The structure of the YPD1/SLN1-R1complex bound to Mg2+ and BeF3− was solved by molecular replacement using the program PHASER49. The search models were YPD1 and SLN1-R1 from the 2.3 Å P212121 crystal structure of the YPD1/SLN1-R1 complex (1OXB) solved previously in our lab19. After molecular replacement, the initial R-factor was 36.03% with an Rfree of 37.06%. Following the first restrained refinement step and initial map calculation using REFMAC550, as a part of the CCP4 suite of programs27, beryllium fluoride and magnesium were modeled into clearly defined density of an Fo-Fc electron density map (Figure 1a). After further interactive cycles of maximum likelihood and isotropic temperature factor refinement using TLS restraints51 and model building using Coot52, the R-factor dropped to 23.23% with an Rfree of 25.24%. Water molecules were initially modeled using Arp_waters from the ARP/wARP routine53 implemented in REFMAC550 and subsequently only water molecules with Fourier difference peaks greater than 2σ were included in the final model. The final model was refined to 1.70 Å with an R-factor of 19.6% and an Rfree of 23.9%. Refinement statistics of the final model are listed in the Table 1.
All structure figures were generated using Pymol (http//pymol.sourceforge.net). Graphical representations were produced using Microsoft Excel 2004 version 11.2.3 (Microsoft corporation).
The atomic coordinates and structure factors for the YPD1/SLN1-R1•Mg2+•BeF3− complex have been deposited in the RCSB Protein Data Bank with a PDB ID code of 2R25.
Supplementary Material
Acknowledgements
We thank Bryan Prince for maintenance of our in-house X-ray facility and for sharing ideas on crystal soaking methods. We are also grateful to Ann Stock, George Richter-Addo and Paul Cook for advice and helpful discussion. This research was supported by grants to AHW from the National Institutes of Health (GM059311) and the Oklahoma Center for the Advancement of Science and Technology (HR06-126).
Footnotes
Publisher's Disclaimer: This is a PDF file of an unedited manuscript that has been accepted for publication. As a service to our customers we are providing this early version of the manuscript. The manuscript will undergo copyediting, typesetting, and review of the resulting proof before it is published in its final citable form. Please note that during the production process errors may be discovered which could affect the content, and all legal disclaimers that apply to the journal pertain.
References
- 1.Stock AM, Robinson VL, Goudreau PN. Two-component signal transduction. Annu. Rev. Biochem. 2000;69:183–215. doi: 10.1146/annurev.biochem.69.1.183. [DOI] [PubMed] [Google Scholar]
- 2.Appleby JL, Parkinson JS, Bourret RB. Signal transduction via the multi-step phosphorelay: not necessarily a road less traveled. Cell. 1996;86:845–848. doi: 10.1016/s0092-8674(00)80158-0. [DOI] [PubMed] [Google Scholar]
- 3.West AH, Stock AM. Histidine kinases and response regulator proteins in two-component signaling systems. Trends Biochem. Sci. 2001;26:369–376. doi: 10.1016/s0968-0004(01)01852-7. [DOI] [PubMed] [Google Scholar]
- 4.Stock AM, Guhaniyogi J. A new perspective on response regulator activation. J. Bacteriol. 2006;188:7328–7330. doi: 10.1128/JB.01268-06. [DOI] [PMC free article] [PubMed] [Google Scholar]
- 5.Gao R, Mack TR, Stock AM. Bacterial response regulators: versatile regulatory strategies from common domains. Trends Biochem. Sci. 2007;32:225–234. doi: 10.1016/j.tibs.2007.03.002. [DOI] [PMC free article] [PubMed] [Google Scholar]
- 6.Dyer CM, Quillin ML, Campos A, Lu J, McEvoy MM, Hausrauth AC, Westbrook EM, Matsumura P, Matthews BW, Dahlquist FW. Structure of the constitutively active double mutant CheYD13K Y106W alone and in complex with a FliM peptide. J. Mol. Biol. 2004;342:1325–1335. doi: 10.1016/j.jmb.2004.07.084. [DOI] [PubMed] [Google Scholar]
- 7.Zhu X, Rebello J, Matsumura P, Volz K. Crystal structures of CheY mutants Y106W and T87I/Y106W. J. Biol. Chem. 1997;272:5000–5006. doi: 10.1074/jbc.272.8.5000. [DOI] [PubMed] [Google Scholar]
- 8.Lee S-Y, Cho HS, Pelton JG, Yan D, Berry EA, Wemmer DE. Crystal structure of activated CheY. J. Biol. Chem. 2001;276:16425–16431. doi: 10.1074/jbc.M101002200. [DOI] [PubMed] [Google Scholar]
- 9.Dyer CM, Dahlquist FW. Switched or not?: the structure of unphosphorylated CheY bound to the N terminus of FliM. J. Bacteriol. 2006;188:7354–7363. doi: 10.1128/JB.00637-06. [DOI] [PMC free article] [PubMed] [Google Scholar]
- 10.Varughese KI, Tsigelny I, Zhao H. The crystal structure of beryllofluoride Spo0F in complex with the phosphotransferase Spo0B represents a phosphotransfer pretransition state. J. Bacteriol. 2006;188:4970–4977. doi: 10.1128/JB.00160-06. [DOI] [PMC free article] [PubMed] [Google Scholar]
- 11.Lukat GS, McCleary WR, Stock AM, Stock JB. Phosphorylation of bacterial response regulator proteins by low molecular weight phospho-donors. Proc. Natl. Acad. Sci. USA. 1992;89:718–722. doi: 10.1073/pnas.89.2.718. [DOI] [PMC free article] [PubMed] [Google Scholar]
- 12.McCleary WR. The activation of PhoB by acetylphosphate. Mol. Microbiol. 1996;20:1155–1163. doi: 10.1111/j.1365-2958.1996.tb02636.x. [DOI] [PubMed] [Google Scholar]
- 13.Stewart RC, Jahreis K, Parkinson JS. Rapid phosphotransfer to CheY from a CheA protein lacking the CheY-binding domain. Biochemistry. 2000;39:13157–13165. doi: 10.1021/bi001100k. [DOI] [PubMed] [Google Scholar]
- 14.Mayover TL, Halkides CJ, Stewart RC. Kinetic characterization of CheY phosphorylation reactions: Comparison of P-CheA and small-molecule phosphodonors. Biochemistry. 1999;38:2259–2271. doi: 10.1021/bi981707p. [DOI] [PubMed] [Google Scholar]
- 15.Zapf JW, Hoch JA, Whiteley JM. A phosphotransferase activity of the Bacillus subtilis sporulation protein Spo0F that employs phosphoramidate substrates. Biochemistry. 1996;35:2926–2933. doi: 10.1021/bi9519361. [DOI] [PubMed] [Google Scholar]
- 16.Skerker JM, Prasol MS, Perchuk BS, Biondi EG, Laub MT. Two-component signal transduction pathways regulating growth and cell cycle progression in a bacterium: a system-level analysis. PLOS Biol. 2005;3:e334. doi: 10.1371/journal.pbio.0030334. [DOI] [PMC free article] [PubMed] [Google Scholar]
- 17.Biondi EG, Reisinger SJ, Skerker JM, Arif M, Perchuk BS, Ryan KR, Laub MT. Regulation of hte bacterial cell cycle by an integrated genetic circuit. Nature. 2006;444:899–904. doi: 10.1038/nature05321. [DOI] [PubMed] [Google Scholar]
- 18.Zapf J, Sen U, Madhusudan, Hoch JA, Varughese KI. A transient interaction between two phosphorelay proteins trapped in a crystal lattice reveals the mechanism of molecular recognition and phosphotransfer in signal transduction. Structure. 2000;8:851–862. doi: 10.1016/s0969-2126(00)00174-x. [DOI] [PubMed] [Google Scholar]
- 19.Xu Q, Porter SW, West AH. The yeast YPD1/SLN1 complex: Insights into molecular recognition in two-component systems. Structure. 2003;11:1569–1581. doi: 10.1016/j.str.2003.10.016. [DOI] [PubMed] [Google Scholar]
- 20.Posas F, Wurgler-Murphy SM, Maeda T, Witten EA, Thai TC, Saito H. Yeast HOG1 MAP kinase cascade is regulated by a multistep phosphorelay mechanism in the SLN1-YPD1-SSK1 “two-component” osmosensor. Cell. 1996;86:865–875. doi: 10.1016/s0092-8674(00)80162-2. [DOI] [PubMed] [Google Scholar]
- 21.Janiak-Spens F, Sparling DP, West AH. Novel role for an HPt domain in stabilizing the phosphorylated state of a response regulator domain. J. Bacteriol. 2000;182:6673–6678. doi: 10.1128/jb.182.23.6673-6678.2000. [DOI] [PMC free article] [PubMed] [Google Scholar]
- 22.Chooback L, West AH. Co-crystallization of the yeast phosphorelay protein YPD1 with the SLN1 response regulator domain and preliminary X-ray diffraction analysis. Acta Cryst. 2003;D59:927–929. doi: 10.1107/s0907444903004487. [DOI] [PubMed] [Google Scholar]
- 23.Stock AM, Martinez-Hackert E, Rasmussen BF, West AH, Stock JB, Ringe D, Petsko GA. Structure of the Mg2+-bound form of CheY and mechanism of phosphoryl transfer in bacterial chemotaxis. Biochemistry. 1993;32:13375–13380. doi: 10.1021/bi00212a001. [DOI] [PubMed] [Google Scholar]
- 24.Laskowski RA, MacArthur MW, Moss DS, Thornton JM. PROCHECK: a program to check the stereochemical quality of protein structures. J. Appl. Cryst. 1993;26:283–291. [Google Scholar]
- 25.Sierk ML, Kleywegt GJ. Deja vu all over again: finding and analyzing protein structure similarities. Structure. 2004;12:2103–2111. doi: 10.1016/j.str.2004.09.016. [DOI] [PubMed] [Google Scholar]
- 26.Xu Q, West AH. Conservation of structure and function among histidine-containing phosphotransfer (HPt) domains as revealed by the crystal structure of YPD1. J. Mol. Biol. 1999;292:1039–1050. doi: 10.1006/jmbi.1999.3143. [DOI] [PubMed] [Google Scholar]
- 27.Collaborative Computational Project, N. The CCP4 suite: Programs for protein crystallography. Acta Cryst. 1994;D50:760–763. doi: 10.1107/S0907444994003112. [DOI] [PubMed] [Google Scholar]
- 28.Wallace AC, Laskowski RA, Thornton JM. LIGPLOT: a program to generate schematic diagrams of protein-ligand interactions. Prot. Eng. 1995;8:127–134. doi: 10.1093/protein/8.2.127. [DOI] [PubMed] [Google Scholar]
- 29.Krissinel E, Henrick K. Detection of protein assemblies in crystals. In: Berthold MR, editor. CompLife 2005, LNBI 3695. Springer-Verlag; Berlin Heidelberg: 2005. pp. 163–174. e. a. [Google Scholar]
- 30.Yan D, Cho HS, Hastings CA, Igo MM, Lee S-Y, Pelton JG, Stewart V, Wemmer DE, Kustu S. Beryllofluoride mimics phosphorylation of NtrC and other bacterial response regulators. Proc. Natl. Acad. Sci. (USA) 1999;96:14789–14794. doi: 10.1073/pnas.96.26.14789. [DOI] [PMC free article] [PubMed] [Google Scholar]
- 31.Lee S-Y, Cho HS, Pelton JG, Yan D, Henderson RK, King DS, Huang L-S, Kustu S, Berry EA, Wemmer DE. Crystal structure of an activated response regulator bound to its target. Nat. Struct. Biol. 2001;8:52–56. doi: 10.1038/83053. [DOI] [PubMed] [Google Scholar]
- 32.Birck C, Mourey L, Gouet P, Fabry B, Schumacher J, Rousseau P, Kahn D, Samama J-P. Conformational changes induced by phosphorylation of the FixJ receiver domain. Structure. 1999;7:1505–1515. doi: 10.1016/s0969-2126(00)88341-0. [DOI] [PubMed] [Google Scholar]
- 33.Kern D, Volkman BF, Luginbühl P, Nohaile MJ, Kustu S, Wemmer DE. Structure of a transiently phosphorylated switch in bacterial signal transduction. Nature. 1999;402:894–898. doi: 10.1038/47273. [DOI] [PubMed] [Google Scholar]
- 34.Lewis RJ, Brannigan JA, Muchova K, Barak I, Wilkinson AJ. Phosphorylated aspartate in the structure of a response regulator protein. J. Mol. Biol. 1999;294:9–15. doi: 10.1006/jmbi.1999.3261. [DOI] [PubMed] [Google Scholar]
- 35.Gardino AK, Volkman BF, Cho HS, Lee S-Y, Wemmer DE, Kern D. The NMR solution structure of BeF3−-activated Spo0F reveals the conformational switch in a phosphorelay system. J. Mol. Biol. 2003;331:245–254. doi: 10.1016/s0022-2836(03)00733-2. [DOI] [PubMed] [Google Scholar]
- 36.Toro-Roman A, Mack TR, Stock AM. Structural analysis and solution studies of the activated regulated domain of the response regulator ArcA: a symmetric dimer mediated by the α4-β5-α5 face. J. Mol. Biol. 2005;349:11–26. doi: 10.1016/j.jmb.2005.03.059. [DOI] [PMC free article] [PubMed] [Google Scholar]
- 37.Toro-Roman A, Wu T, Stock AM. A common dimerization interface in bacterial response regulators KdpE and TorR. Prot. Sci. 2005;14:3077–3088. doi: 10.1110/ps.051722805. [DOI] [PMC free article] [PubMed] [Google Scholar]
- 38.Bachhawat P, Swapna GVT, Montelione GT, Stock AM. Mechanism of activation for transcription factor PhoB suggested by different modes of dimerization in the inactive and active states. Structure. 2005;13:1353–1363. doi: 10.1016/j.str.2005.06.006. [DOI] [PMC free article] [PubMed] [Google Scholar]
- 39.Bachhawat P, Stock AM. Crystal structures of the receiver domain of the response regulator PhoP from Escherichia coli in the absence and presence of the phosphoryl analog beryllofluoride. J. Bacteriol. 2007;189:5987–5995. doi: 10.1128/JB.00049-07. [DOI] [PMC free article] [PubMed] [Google Scholar]
- 40.Wassmann P, Chan C, Paul R, Beck A, Heerklotz H, Jenal U, Schirmer T. Structure of BeF3−-modified response regulator PleD: implications for diguanylate cyclase activation, catalysis, and feedback inhibition. Structure. 2007;15:915–927. doi: 10.1016/j.str.2007.06.016. [DOI] [PubMed] [Google Scholar]
- 41.Tang C, Iwahara J, Clore GM. Visualization of transient encounter complexes in protein-protein association. Nature. 2006;444:383–386. doi: 10.1038/nature05201. [DOI] [PubMed] [Google Scholar]
- 42.Blundell TL, Fernandez-Recio J. Brief encounters bolster contacts. Nature. 2006;444:279–280. doi: 10.1038/nature05306. [DOI] [PubMed] [Google Scholar]
- 43.Jones S, Marin A, Thornton JM. Protein domain interfaces: characterization and comparison with oligomeric protein interfaces. Prot. Eng. 2000;13:77–82. doi: 10.1093/protein/13.2.77. [DOI] [PubMed] [Google Scholar]
- 44.Knowles JR. Enzyme-catalyzed phosphoryl transfer reactions. Annu. Rev. Biochem. 1980;49:877–919. doi: 10.1146/annurev.bi.49.070180.004305. [DOI] [PubMed] [Google Scholar]
- 45.Mildvan A. The role of metals in enzyme-catalyzed substitutions at each of the phosphorus atoms of ATP. Adv. Enzymol. Relat. Areas Mol. Biol. 1979;49:103–126. doi: 10.1002/9780470122945.ch3. [DOI] [PubMed] [Google Scholar]
- 46.Xu Q, Nguyen V, West AH. Purification, crystallization, and preliminary X-ray diffraction analysis of the yeast phosphorelay protein YPD1. Acta Cryst. 1999;D55:291–293. doi: 10.1107/S090744499800866X. [DOI] [PubMed] [Google Scholar]
- 47.Janiak-Spens F, Sparling JM, Gurfinkel M, West AH. Differential stabilities of phosphorylated response regulator domains reflect functional roles of the yeast osmoregulatory SLN1 and SSK1 proteins. J. Bacteriol. 1999;181:411–417. doi: 10.1128/jb.181.2.411-417.1999. [DOI] [PMC free article] [PubMed] [Google Scholar]
- 48.Otwinowski Z, Minor W. Processing of X-ray diffraction data collected in oscillation mode. Methods Enzymol. 1997;276:307–326. doi: 10.1016/S0076-6879(97)76066-X. [DOI] [PubMed] [Google Scholar]
- 49.Storini LC, McCoy AJ, Read RJ. Likelihood-enhanced fast rotation functions. Acta Cryst. 2004;D60:432–438. doi: 10.1107/S0907444903028956. [DOI] [PubMed] [Google Scholar]
- 50.Murshudov GN, Vagin AA, Dodson EJ. Refinement of macromolecular structures by the maximum-likelihood method. Acta Cryst. 1997;D53:240–255. doi: 10.1107/S0907444996012255. [DOI] [PubMed] [Google Scholar]
- 51.Winn MD, Isupov MN, Murshudov GN. Use of TLS parameters to model anisotropic displacements in macromolecular refinement. Acta Crystallogr. 2001;D 57:122–133. doi: 10.1107/s0907444900014736. [DOI] [PubMed] [Google Scholar]
- 52.Emsley P, Cowtan K. Coot: model-building tools for molecular graphics. Acta Crystallogr. 2004;D 60:2126–2132. doi: 10.1107/S0907444904019158. [DOI] [PubMed] [Google Scholar]
- 53.Lamzin VS, Wilson KS. Automated refinement of protein models. Acta Crystallogr. 1993;D49:129–147. doi: 10.1107/S0907444992008886. [DOI] [PubMed] [Google Scholar]
Associated Data
This section collects any data citations, data availability statements, or supplementary materials included in this article.