

Abstract
The AcrAB multidrug efflux pump, which belongs to the resistance-nodulation-division (RND) family, recognizes and extrudes a wide range of antibiotics and chemotherapeutic agents, and causes the intrinsic antibiotic resistance in Escherichia coli. The expression of AcrAB is controlled by the transcriptional regulator AcrR, whose open reading frame is located 141-base-pair upstream of the acrAB operon. To understand the structural basis of AcrR regulation, we have determined the crystal structure of AcrR, to 2.55 Å resolution, revealing a dimeric two-domain molecule with an entirely helical architecture similar to members of the TetR family of transcriptional regulators. Each monomer of AcrR forms a multi-entrance pocket of 350 cubic angstroms in the ligand-binding domain. The ligand-binding pocket is surrounded with mostly hydrophobic residues. In addition, a completely buried negatively charged glutamate, expected to be critical for drug binding, is located at the center of the binding pocket. The crystal structure provides novel insight into the mechanisms of ligand binding and AcrR regulation.
Introduction
The increase in multidrug-resistant pathogenic bacteria has emerged as a major problem in human and animal health. In bacteria, one important mechanism that gives rise to multidrug resistance is the over-expression of multidrug transporters, which actively engage to extrude clinically relevant antimicrobials from these organisms and thereby prevent the accumulation of antimicrobials to toxic levels.1–4 These bacterial multidrug transporters can be divided into five different classes: i) the ATP-binding cassette (ABC) family;5 ii) the major facilitator superfamily (MFS);6–8 iii) the resistance-nodulation-division (RND) family;9,10 iv) the small multidrug resistance (SMR) family;11 and v) the multidrug and toxic compound extrusion (MATE) family.12–14 Transporters belonging to the RND superfamily recognize and export the widest range of toxic chemicals, and usually contribute significantly to the intrinsic antibiotic resistance in Gram-negative bacteria and the increased resistant levels of multidrug resistant strains.15,16
The Escherichia coli AcrB is one of the prototypical members of the RND family of transporters.15,17 It recognizes many structurally unrelated compounds, including most of the currently available antibiotics and chemotherapeutic agents, detergents and dyes, and expels them from cells.18 This inner membrane efflux pump interacts with a periplasmic membrane fusion protein, AcrA,19 and an outer membrane channel, TolC,20 to mediate the extrusion of toxic compounds directly into the external medium, across both membranes of E. coli.
The transcription of the acrB gene is regulated by a global transcriptional activator MarA and a local transcriptional repressor AcrR.21 The acrR gene is located 141 bp upstream of the acrAB operon and transcribed divergently.21 It encodes a 215-aminoacid protein, which shares N-terminal sequence and structural similarities to members of the TetR family of transcriptional repressors.22 The signatures of the TetR family of regulators include a homologous three helix DNA-binding domain, and a diverse C-terminal domain that possesses unique sequences, forming a specific ligand-binding site for inducing compounds.22
Many TetR family members bind as dimers to their ~15-bp palindrome (IR) operator sites. However, the crystal structure of the QacR-DNA complex reveals that QacR binds its 28-bp IR1 operator as a dimer of dimers.23 In the case of AcrR, there is strong evidence that the IR of AcrR consists of a 24-bp inverting sequence, 5′TACATACATTTGTGAATGTATGTA3′.21,24,25 This nucleotide sequence is located upstream of the acrAB operon and overlaps with the promoter. Fluorescence polarization assays suggested that AcrR binds this inverting IR in a manner of 2:1 dimeric AcrR-to-IR molar ratio, with the dissociation constant of 20 nM.24 Thus, there is a good chance that the binding of AcrR to IR resembles the QacR-IR1 complex.
AcrR is induced by a variety of structurally dissimilar agents, which also served as substrates of the AcrB multidrug efflux pump. The binding of AcrR with several ligands, including rhodamine 6G (R6G), ethidium (Et) and proflavin (Pf), have been studied and their dissociation constants have been measured, ranging from 4.2 to 10.7 μM.24 How inducing ligands bind to AcrR and modulate the expression of AcrB is not known. It is expected that binding of drugs to the C-terminal ligand-binding domain of AcrR triggers conformational change in the N-terminal DNA-binding region. This change in conformation results in the release of AcrR from its operator DNA, and thus allows transcription from cognate promoter.
As an initial step to examine the mechanism that AcrR uses to regulate gene expression, we here report the crystal structure of AcrR at a resolution of 2.55 Å. The structure reveals that AcrR is an all-alpha helical protein. It is folded into nine α-helices and is composed of two domains, a DNA-binding domain and a ligand-binding domain. The N-terminal domain is a three-helix domain, which forms a typical helix-turn-helix (HTH) motif. The C-terminal domain, however, covers a large internal cavity that seems to form a ligand-binding pocket. This pocket can accommodate a variety of ligands, which suggests that AcrR is a multidrug binding protein.
Results
Overall structure of AcrR
The structure of the apo form of selenomethioninyl-substituted (SeMet) AcrR was determined by multi-wavelength anomalous dispersion (MAD) (Table 1 and Fig. 1a). The final model, containing 207 amino acids (residues 6 to 212), was refined to 2.55 Å. All residues in the refined model fall within the favored and allowed regions of the Ramachandran plot (Table 1). The asymmetric unit contains a single monomer of AcrR (Fig. 1b). By applying the crystallographic symmetry operators, a dimeric arrangement of the protein was found. The dimer is an all-helical protein, and its overall architecture is in agreement with the structures of the homologues TetR,26,27 QacR,23,28 CprB,29 EthR30,31 and CmeR.32
Table 1.
Data collection, phasing and structural refinement statistics
| A. Data collection | |||
|---|---|---|---|
| SeMet Inflect. point | SeMet Peak | SeMet Remote | |
| Wavelength (Å) | 0.9801 | 0.9799 | 0.9606 |
| Space group | P2221 | P2221 | P2221 |
| Cell constants (Å) | a = 48.2, b =54.6, c = 73.7 | a = 48.2, b = 54.6, c = 73.7 | a = 48.2, b = 54.6, c = 73.7 |
| f′, f″ | −10.2,2.8 | −8.7,5.2 | −3.5,3.8 |
| Resolution (Å) | 2.68(2.78–2.68) | 2.55(2.64–2.55) | 2.75(2.85–2.75) |
| Completeness (%) | 98.6(87.5) | 98.2(85.2) | 98.3(84.9) |
| Total no. of reflections | 492,377 | 483,800 | 499,993 |
| No. of Unique reflections | 5,892 | 6,766 | 5,545 |
| Rsym(%) | 8.1(35.6) | 7.6(30.6) | 7.6(39.7) |
| Average I/s | 20.5(3.1) | 20.9(3.3) | 21.1(2.3) |
| B. Phasing | |||
| Selenium atom sites | 7 | ||
| Resolution range of data used (Å) | 50–2.80 | ||
| Overall figure of merit | 0.51 | ||
| C. Refinement | |||
| Rwork (%) | 22.8 | ||
| Rfree (%) | 27.3 | ||
| rms deviations | |||
| Bond angles (deg.) | 0.8 | ||
| Bond length (Å) | 0.006 | ||
| Ramachandran analysis | |||
| Most favored (%) | 88.9 | ||
| Allowed (%) | 9.5 | ||
| Generously allowed (%) | 1.1 | ||
| Disallowed (%) | 0.0 |
Figure 1.

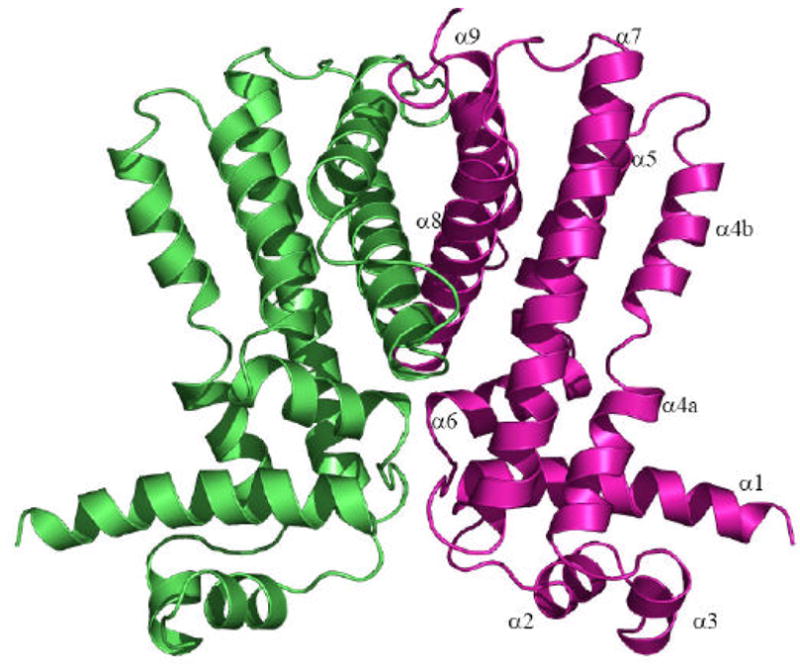
Stereo view of the experimental density map and ribbon diagram of AcrR. (a) Representative section of electron density surrounding three of the seven experimentally determined Se sites (M159, M167 and M175). The solvent-flattened electron density (50–2.8 Å) is contoured at 1σ and superimposed with the final refined model (yellow, carbon; red, oxygen; blue nitrogen; green, sulfur). (b) Ribbon diagram of the AcrR homodimer generated by crystallographic symmetry. The Figure was prepared using PyMOL.52
Each subunit of AcrR in the dimer is composed of nine helices (α1-α9 and α1′-α9′, respectively) and can be divided into two domains. The smaller N-terminal domain comprises helices α1 to α3. Like other known protein structures of the TetR family members, helices α2 and α3 form the HTH DNA-binding motif. The larger C-terminal domain consists of helices α4 to α9. In TetR,26 QacR,28 EthR31 and CmeR,32 their C-terminal domains are known to make the ligand-binding domains. Thus, its function in AcrR is expected to recognize and bind multiple AcrR drugs. The helices of AcrR are designated as: α1 (7–27), α2 (34–41), α3 (45–51), α4 (a (55–65) and b (69–80)), α5 (85–102), α6 (104–115), α7 (122–151), α8 (160–180), and α9 (190–204).
N-terminal DNA-binding domain
The DNA-binding domain is composed of three helices, α1 to α3, in which helices α2 and α3 form a typical helix-turn-helix (HTH) motif. Residues of the N-terminal domain are conserved among the TetR family of regulators. Sequence alignment of this region, residues 12–62, with QacR28 obtains 43% amino acid identity and 71% similarity. This sequence alignment also gives 43% identity and 57% homology to that of CmeR,32 although the crystal structure of CmeR reveals the lack of the recognition helix α3 in the regulator. Residues 55–62 belong to the N-terminal half of helix α4. Thus this portion of α4 could be considered as part of the DNA-binding domain because of its high sequence similarity, especially for its first residue, K55, which is well conserved among members of the TetR family.
The distances and relative orientations of two DNA-binding domains within homodimers of the TetR family of regulators are expected to be different between the DNA and ligand bound forms. The center-to-center distance between the DNA recognition helices α3 and α3′ of the AcrR dimer is 42 Å. Such distance in the apo form of QacR is 39 Å.28 This center-to-center distance in QacR increases upon drug binding. The induced conformational change triggered by the bound drug is accompanied with an increase in center-to-center distance between the DNA recognition helices α3 and α3′ from 37 Å in the DNA-bound form to 48 Å in the ligand-bound form.23 Thus, similar conformational change within two HTH motifs of the AcrR dimer is expected upon DNA and ligand bindings.
The overall structure of the N-terminal domain of AcrR is very similar to those of TetR family members. A superposition of this domain, residues 12 through 62, with that of QacR gives an overall rms deviation of 1.2 Å calculated over the Cα atoms. As CmeR is lacking the recognition helix α3, we superimposed the Cα atoms of helices α1 and α2, between residues 8 and 42, of AcrR with their corresponding residues in CmeR. These residues can also be superimposed and give an overall rms deviation of 1.0 Å. Fig. 2a illustrates the superposition of the N-terminal domains of AcrR, QacR and CmeR.
Figure 2.


Structural comparison of the TetR family regulators. (a) Superimposition of DNA-binding domains (green, AcrR; red, QacR; deep blue, CmeR). (b) Superimposition of regulatory domains (green, AcrR; red, QacR; deep blue, CmeR). Helices α4b-α8 are labeled.
C-terminal regulatory domain
The C-terminal domain of AcrR consists of six α helices, with helices 4, 5, 7, 8 and 9 forming an antiparallel five-helix bundle. Like QacR, the dimerization surface mainly comprises helices α8 and α9, although helices α6 and α7 are also involved in the formation of the dimer. These helices make contact with their counterparts. A surface area of 2,002 Å2 per monomer (probe radius of 1.4 Å) is buried in the contact region of the dimer. The interaction surface is mostly hydrophobic in character. Within 3.5 Å, the close contact pairs in the helices involve F114 and E176′, R162 and Q190′, I165 and L174′, I166 and Y170′, I166 and Y194′, R168 and N177′, G169 and G173′, M201 and M201′, and L204 and L204′. Additional contact interfaces are provided by the loop regions connecting helices α6 and α7, helices α8 and α9, and the loop right after helix α9. At the flexible loop between helices α6 and α7, F119 makes contact with K116′. In helix α8, residue I165 interacts with F185′ from the flexible region between helices α8 and α9, while residue I197 from helix α9 forms hydrophobic contacts with T207′ and L208′ closed to the end of the C-terminus. Similar interaction is found in residue Q200, which makes hydrophobic contacts with C205′ and P206′. The interactions between two AcrR subunits are extensive, and this dimer interface is further strengthened by two cross-interface hydrogen bonds between R131 and F180′; and R162 and Q190′.
Although the C-terminal region displays no primary sequence conservation among members of the TetR family, the overall structure of the C-terminal domain of AcrR displays topological similarity to those of QacR28 and CmeR.32 A pair-wise alignment of the C-terminal domains is difficult as the six C-terminal helices (seven in CmeR) differ both in length and orientation. Superposition of the secondary structures, as shown in Fig. 2b, indeed highlights the topological similarity of these three TetR family regulators.
Ligand binding pocket
In view of the AcrR crystal structure, the C-terminal α-helical bundle forms a large internal cavity. Superimposition of the C-terminal domain of AcrR with that of QacR28 indicates that this large internal cavity overlaps with the multidrug binding pocket of QacR. Thus, this cavity is most likely to serve as the ligand-binding pocket in AcrR. Helices 4–8 in each monomer of AcrR form this large pocket that occupies a volume of 350 Å3. Helix α6 is located at the bottom of the pocket and is almost orthogonal to the twofold axis of the dimer. Thus, helix α6 seems to form the bottom of the pocket. We used the program “putative active sites with spheres” (PASS)33 to search for potential ligand-binding sites in the AcrR structure. Like QacR28 and CmeR,32 the top two predicted binding sites fell inside this large pocket. The ligand-binding pocket of AcrR is unique in that it possesses three openings (Fig. 3a). One of these openings is located at the dimer interface, and is nearly blocked by the loop between helices α8′ and α9′ from the second subunit. Residues I113 and F114 of α6; Q130, C134 and S137 of α7; and R168 and S172 make this opening. The other two openings are located at the front and side surfaces of the monomer, and they are more or less orthogonal to each other. The loop region between α4a and α4b contributes to form part of these two openings. Surrounding the front surface of the opening are residues S68, I70, G71, and E74 of α4; and L133, R140 and T144 of α7. Residues L65, S66, N69, and L73 of α4; H95 of α5; and E103, R105 and R106 of α6, however, are involved in the formation of the opening at the side surface. The inner wall of the ligand-binding pocket is lined by 14 residues (W63 and E67 of α4; V88, L89, I92, L93, V96 and S99 of α5; L109 and M110 of α6; I141 of α7; and M167, I171 and M175 of α8), in which most of these residues are hydrophobic in nature. Similar multidrug binding pocket has been found in the QacR repressor.28 The volume of the multidrug binding pocket in AcrR seems larger than that of the apo-QacR, but smaller than the drug-bound form of the QacR repressor.
Figure 3.


Views of the cavity formed in the ligand-binding domain of AcrR. (a) View of the hydrophobic cavity with residues forming the cavity. The locations of three openings of the cavity are indicated with arrows. (b) Electrostatic surface potential of one subunit of AcrR. This view shows the large cavity spanning from the side surface (front) to subunit interface (back) of the C-terminal domain of one subunit of AcrR. Blue (+15 kBT) and red (−15 kBT) indicate the positively and negatively charged areas, respectively, of the protein.
Although the ligand-binding pocket of AcrR is predominantly hydrophobic, the inner surface of the pocket displays a patch of negative potential, created by the completely buried acidic residue E67, in the electrostatic surface diagram (Fig. 3b). This negative potential suggests that AcrR may be more favorable to bind neutral and positively charged ligands. In fact, many of the AcrR ligands, including R6G and Et, are positive in charge.
Discussion
The large cavity located in the C-terminal regulatory domain is most likely to form a multidrug-binding pocket. This cavity is surrounded by hydrophobic residues of helices 4–8, and occupies a volume of 350 Å3. Since the cavity is formed independently by helices of one subunit, the dimeric form of AcrR consists of two identical multidrug binding pockets as indicated by the strict twofold symmetry for the homodimer. Based on the crystal structure, it is expected that the AcrR dimer binds two ligand molecules, and each subunit of which contribute to bind one ligand. Recently, fluorescence polarization experiments have suggested that AcrR binds R6G, Et and Pf in a manner of 1:1 monomer-to-drug molar ratio.24 Thus, the crystal structure, demonstrating two independent ligand-binding pockets in the homodimer, is in good agreement with the fluorescence polarization study. This ligand-binding mode is similar to those of TetR,26 EthR31 and CmeR,32 but is different from the case of QacR28 in which it binds one drug per dimer. Although AcrR and QacR recognize a similar range of cationic lipophilic drugs, their C-terminal sequences, which form the multidrug binding pockets, are quite diverse. The difference in the C-terminal sequence may be attributed to a unique manner of drug binding.
The docking study using the program MEDock34 shows that the large cavity can accommodate different drugs, including Et, Pf and ciprofloxacin (Cip) (Fig. 4). In each case, the bound drug was completely buried in the AcrR molecule, and strong interaction between the bound drug and the regulator was observed. MEDock suggested that Et, Pf and Cip are bound in distinct sites in the cavity. However, their binding sites are partially overlapped with each other, similar to those of the QacR bindings.28 When PASS was used to search for potential drug-binding sites in the AcrR structure, the top two predicted sites are found inside the large pocket. One of these PASS sites corresponds to the Et binding site predicted by MEDock. The second PASS site, however, overlaps with the predicted Cip binding site. The binding pocket created by helices 4–8 is extensive. There are more than 10 residues, which line the inner wall of the cavity, involved in the binding of drugs. The docking study suggests that W63, I70 and F114 are likely to make hydrophobic contacts with the bound drugs. Additional electrostatic interactions may come from residues E67, E74, Q130, R168 and S172 to secure the binding. A distinguishing feature of multidrug binding proteins that bind positively charged drugs is the presence of buried acidic glutamates or aspartates in the binding site. This was clearly demonstrated in the cases of BmrR35,36 and QacR.28 For AcrR, the crystal structure illustrates that there is a completely buried acidic residue, E67, located at the center of the drug-binding binding pocket (Fig. 4). Thus, this negatively charged residue is expected to be critical for recognizing positively charged drugs, and possibly important for neutralizing the formal positive charges of these drugs. In the crystal structure, within the vicinity of E67, R106 is found to make hydrogen bond with this acidic residue.
Figure 4.

Binding site prediction for AcrR. This is a composite figure showing the locations of the predicted bound ligands in the ligand-binding pocket. The ligands shown in stick models are Et (orange), Cip (pink) and Pf (red). Residue E67 buried in the ligand-binding pocket (see the text for details) is shown in yellow sticks.
To demonstrate that the buried acidic glutamate, E67, in AcrR is critical for drug binding, we mutated this residue to an alanine. We then determined the binding affinity of this alanine mutant, E67A, with three different AcrR ligands, Pf, R6G and Et, using fluorescence polarization assays.37,38 Fig. 5 illustrates the binding isotherm of E67A in the presence of 1 μM Pf. The titration experiment indicated that the E67A mutant binds Pf with dissociation constant, KD, of 96.2 ± 4.6 μM. This value is about nine times greater than that of the wild-type AcrR (Table 2), suggesting that the E67A substitution abolished the binding of Pf. Similar results were also found with the binding of R6G and Et (Table 2), thus confirming the critical role of the buried E67 residue at the ligand binding site.
Figure 5.

Representative fluorescence polarization of mutant E67A with Pf. The binding isotherm of E67A with Pf, showing a KD of 96.2 ± 4.6 μM.
Table 2.
Dissociation constants of the wild-type AcrR and E67A mutant with different ligands.
| KD (μM) | ||
|---|---|---|
| Ligand | E67A | Wild-type |
| Proflavin | 96.2 ± 4.6 | 10.1 ± 0.8a |
| Rhodamine 6G | 106.2 ± 6.7 | 10.7 ± 1.4a |
| Ethidium | 138.3 ± 6.3 | 4.2 ± 0.3a |
Data were obtained from ref. (24).
Surprisingly, when MEDock was used to search for a potential R6G binding site, we have not found any solution inside the binding pocket. We also used AutoDock39 to search for the R6G binding site, and neither did the program give us any conclusive solution. The fact that R6G cannot be docked into the ligand-binding pocket suggests that the cavity may not be large enough to accommodate the entire R6G molecule, which is considerably bigger than Et, Cip and Pf. We reasoned that when AcrR binds its inducing ligand, the volume of the ligand-binding pocket might need to expand to accommodate the large size of the drug molecule. This plasticity of a multidrug-binding pocket has been observed in the case of QacR28,40 in which the volume of the entire multidrug-binding pocket has increased at least by a few hundred cubic angstroms after drug binding.28
The crystal structures of the TetR-IR27 and QacR-IR123 complexes have been determined, and the interactions between these regulators and their target DNAs have been revealed. These crystal structures suggested that the recognition helix α3 is responsible for interacting with the major groove of target DNA. The strong structural and sequence similarities in the DNA-binding domains of the TetR members suggest a similar mode of interaction with target DNAs. Sequence alignment of the HTH motif among members of the TetR family indicates that residues L34, R45, G46, A47, Y49, W50, H51 and K55 in AcrR are important for repressor-operator interaction.22 Three of these residues, Y49, H51 and K55, are highly conserved, suggesting that these residues may play a major role in the recognition of target DNA. In fact, K46 of QacR and K47 of TetR (correspond to the first residue, K55, in helix α4 of AcrR) have been seen in contact with the phosphate backbones in QacR-IR123 and TetR-tetO,27 respectively. Presumably, AcrR represses the transcription of acrAB by directly binding to the inverting 24-bp IR sequence in the promoter region of the efflux operon. This IR sequence is different in length to that of the 15-bp tetO bound by TetR, but is similar to the long 28-bp IR1 recognized by QacR. TetR binds as a single dimer to the tetO operator,27 however, two dimers of QacR interact with one IR1.23 Based on the IR sequence, we reasoned that AcrR might bind its operator as a dimer of dimers in a way that is similar to the QacR-DNA binding.23 Indeed, recent study using fluorescence polarization assays indicated that two dimers of AcrR bind to one double-stranded IR.24
To confirm that two AcrR dimers bind one IR operator site, we performed gel filtration experiments using the purified AcrR protein pre-incubated with the purified, complementary, annealed 28-mer IR oligonucleotides. The experiments were repeated for three times. Gel filtration suggested an average molecular weight of 124.1 ± 4.0 kDa for the AcrR-IR complex (Fig. 6). This value is in good agreement with the theoretical value of 120.7 kDa for four AcrR molecules bound to the 28-bp IR. Thus, the stoichiometry of the AcrR-IR complex is 2:1 dimeric AcrR-to-DNA molar ratio.
Figure 6.
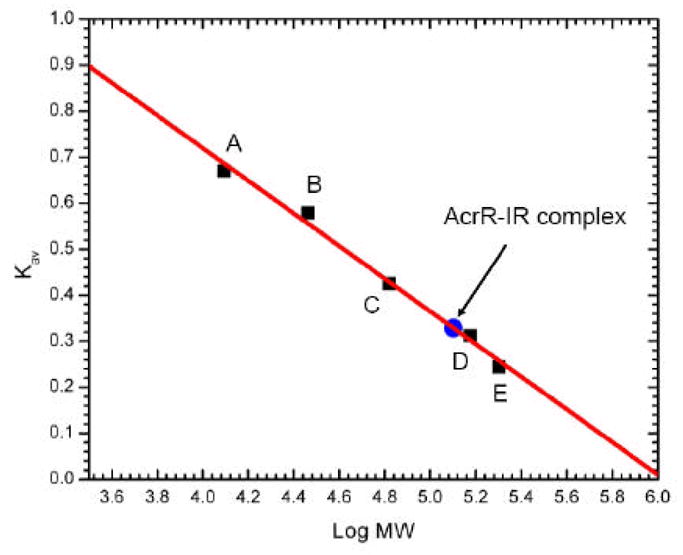
Representative gel filtration experiment. The experiment demonstrated that four AcrR molecules are bound to one IR operator. The y axis values were defined as: Kav = (Ve − V0)/(VT − V0), where VT, Ve, and V0 are the total column volume, elution volume, and void volume of the column, respectively. Standards used were: A, cytochrome C (Mr 12,400); B, carbonic anhydrase (Mr 29,000); C, albumin bovine serum (Mr 66,000); D, alcohol dehydrogenase (Mr 150,000); and E, β-Amylase (Mr 200,000). The void volume was measured using blue dextran (Mr 2,000,000).
We generated a speculative model of DNA-bound AcrR by aligning its individual domains with those of the DNA-bound QacR (Fig. 7). The model of this DNA-bound AcrR suggests that Y49, H51 and K55 make phosphate contacts with the IR. R45, however, interacts directly with four different bases of the DNA. According to our speculative model, a mutation on residue R45 should affect the function of the AcrR regulator. Additional direct contacts of the regulator and IR come from G46, which contacts one base, and W50, which makes π-π interactions with three different bases. A recent study of 36 fluoroquinolone-resistant E. coli strains indicated that 11 of the isolates consistently produced more acrB mRNA. Among these 11 isolates, six of them had a mutation at codon 45 (Arg → Cys) in acrR, and all these six R45C mutants showed elevated (64 to 128-fold) resistance to several antibiotics, including ciprofloxacin, tetracycline and chloramphenicol,41 Thus, these results are consistent with our speculative model of the AcrR-IR complex. The crystal structure of the DNA-bound AcrR would be necessary to confirm our model.
Figure 7.

Speculative model of AcrR in its DNA-bound form. The N- and C-terminal domains of the ligand-bound dimeric AcrR were individually aligned with those of the DNA-bound QacR (1JT0) to generate the DNA-bound form of AcrR. The model of the 24 bp IR model is shown in stick model. It is expected that two dimers of AcrR (in orange and deepolive ribbons) bind one double-stranded IR.
Based on our DNA-bound model, it is speculated that during DNA binding, the loop region connecting helices α1 and α2 shifts upward by 3 Å. This conformational change causes helix α6, which forms the bottom of the ligand-binding pocket, moves toward the cavity. The movement of helix α6 induces the relocation of helix α4, in turn decreasing the volume of the ligand-binding pocket. This change in conformation may not be favorable for the drug molecule, as it needs to overcome the steric hindrance to enter the ligand-binding site. Thus, it is likely that AcrR induction may be governed by steric repulsion that takes place during drug binding.
Materials and Methods
Purification, crystallization and data collection
Recombinant AcrR, containing a 6xHis tag at the C-terminus, was produced in E. coli using the pET15b vector. The cloning, expression and purification procedures have been described previously.42 For crystallization, a 4 μl drop consisting of 2 μl protein solution (20 mg/ml SeMet-AcrR in 20 mM Tris, pH 7.5, 60 mM imidazole, and 200 mM NaCl) and 2 μl well solution (35% PEG 4000, 0.2 M MgCl2 and 0.1 M Tris buffer pH 8.5) was equilibrated against 500 μl well solution. The crystallization conditions provided sufficient cryoprotection and crystals were frozen directly in liquid nitrogen at 100K. Diffraction data sets were taken at the Advanced Light Source (beamlines 8.2.1 and 8.2.2) at cryogenic temperature (100 K) using an ADSC Quantum 315 CCD-based detector.
Structural determination and refinement
Diffraction data sets were processed with DENZO and scaled with SCALEPACK.43 The SeMet crystal took the space group group of P2221, with unit cell parameters summarized in Table 1. Initial phase calculation was carried out at the 2.8 Å resolution using the program BnP44 after finding and refinement of all seven selenium sites. The electron density map obtained was applied to density modification (DM) using the program RESOLVE.45 The auto-interpretation routine program in RESOLVE led to an initial model containing 60% amino acid residues, 32% of which contained side-chains. The remaining part of the model was manually constructed using the program O.46 The model, comprising residues 6–212, was then refined against the peak data at 2.55 Å using the programs CNS47 and REFMAC5.48,49 Solvent atoms were initially built using the program ARP/warp48,50 and later added or removed by manual inspection. The final Rwork and Rfree (calculated with 5% of the reflections omitted from the refinement) were 22.8% and 27.3%, respectively.
Fluorescence polarization assay for AcrR ligand binding affinities
Fluorescence polarization assays37,38 were used to determine the ligand binding affinities of the mutant AcrR regulator. The experiments were done using a ligand binding solution containing 10 mM Na-phosphate (pH 7.2), 100 mM NaCl, and 1 μM ligand (R6G, Et, or Pf). The E67A protein solution in 10 mM Na-phosphate (pH 7.2), 100 mM NaCl, and 1 μM ligand was titrated into the ligand binding solution until the polarization (P) become unchanged. The excitation wavelengths were 527, 483, and 447 nm, respectively, for R6G, Et, and Pf. Fluorescence polarization signals (in ΔP) were measured at emission wavelengths of 550, 620, and 508 nm, respectively, for these ligands. Each titration point recorded was an average of 15 measurements. Data were analyzed using the equation, where P is the polarization measured at a given total protein concentration, Pfree is the initial polarization of free ligand, Pbound is the maximum polarization of specifically bound ligand, and [protein] is the protein concentration. The titration experiments were repeated for three times to obtain the average KD values. Curve fitting was accomplished using the program ORIGIN.51
Gel filtration
A protein liquid chromatography Superdex 200 16/60 column (Amersham Pharmacia Biotech) with a mobile phase containing 40 mM Tris-HCl (pH 7.2), 100 mM imidazole-HCl (pH 7.2) and 250 mM NaCl was used in the gel filtration experiments. Blue dextran (Sigma) was used to determine the column void volume, and proteins for use as gel filtration molecular weight standards were cytochrome C (Mr 12,400), carbonic anhydrase (Mr 29,000), albumin bovine serum (Mr 66,000), alcohol dehydrogenase (Mr 150,000), and β-Amylase (Mr 200,000). All these standards were purchased from Sigma. The molecular weights of the experimental samples were determined following the protocols supplied by the manufacturers.
Modeling of DNA-bound form of AcrR
The model of the DNA-bound form of AcrR was generated using O.46 In brief, the N- and C-terminal domains of AcrR were separately aligned with the corresponding domains of the DNA-bound QacR (1JT023). The resulting model was then idealized using REFMAC5.48,49 The AcrR dimer was generated by applying symmetry operators obtained from the apo AcrR crystal structure. The final center-to-center distance of the DNA-bound form of AcrR is 36 Å.
Prediction of ligand-binding sites
The MEDock web server34 was used for prediction of the ethidium (PDB: et), proflavin (PDB: pf), ciprofloxacin (PDB: cpf) and rhodamine 6G (PDB: rhq) bindings in AcrR. A global search strategy that exploits the maximum entropy property of the Gaussian distribution was employed. For the docking protocol, the maximum generation in each run was set to 1,000. A grid of 0.375 Å spacing was used for the calculation. For each ligand, five separate docking calculations were performed. Each calculation was performed with a population size of 50, and a probability of 0.05 to invoke local search.
Acknowledgments
M.D.R. is a recipient of a Roy J. Carver Trust pre-doctoral training fellowship. Funded by the NSF (EEC0608769), K.C.H. and E.S.J. were summer interns of the BBSI Bioinformatics and Computational Systems Biology Summer Institute at Iowa State University. All X-ray diffraction data were collected at the Advanced Light Source (ALS, beamlines 8.2.1 and 8.2.2). This work was supported by an NIH grant GM074027 (to E.W.Y.).
Footnotes
Publisher's Disclaimer: This is a PDF file of an unedited manuscript that has been accepted for publication. As a service to our customers we are providing this early version of the manuscript. The manuscript will undergo copyediting, typesetting, and review of the resulting proof before it is published in its final form. Please note that during the production process errors may be discovered which could a3ect the content, and all legal disclaimers that apply to the journal pertain.
References
- 1.Levy SB. Antibiotic resistance: consequences of inaction. Clin Infect Dis. 2001;33(Suppl 3):S124–S129. doi: 10.1086/321837. [DOI] [PubMed] [Google Scholar]
- 2.Levy SB. Active efflux mechanisms for antimicrobial resistance. Antimicrob Agents Chemother. 1992;36:695–703. doi: 10.1128/aac.36.4.695. [DOI] [PMC free article] [PubMed] [Google Scholar]
- 3.Saier MH, Jr, Paulsen IT, Sliwinski MK, Pao SS, Skurray RA, Nikaido H. Evolutionary origins of multidrug and drug-specific efflux pumps in bacteria. FASEB J. 1998;12:265–274. doi: 10.1096/fasebj.12.3.265. [DOI] [PubMed] [Google Scholar]
- 4.McKeegan KS, Borges-Walmsley MI, Walmsley AR. The structure and function of drug pumps: an update. Trends Microbiol. 2003;11:21–29. doi: 10.1016/s0966-842x(02)00010-0. [DOI] [PubMed] [Google Scholar]
- 5.Higgins CF. ABC transporters: from microorganisms to man. Annu Rev Cell Biol. 1992;8:67–113. doi: 10.1146/annurev.cb.08.110192.000435. [DOI] [PubMed] [Google Scholar]
- 6.Griffith JK, Baker ME, Rouch DA, Page MG, Skurray RA, Paulsen IT, Chater KF, Baldwin SA, Henderson PJ. Membrane transport proteins: Implications of sequence comparisons. Curr Opin Cell Biol. 1992;4:684–695. doi: 10.1016/0955-0674(92)90090-y. [DOI] [PubMed] [Google Scholar]
- 7.Marger MD, Saier MH., Jr A major superfamily of transmembrane facilitators that catalyse uniporter, symporter and antiporter. Trends Biochem Sci. 1993;18:13–20. doi: 10.1016/0968-0004(93)90081-w. [DOI] [PubMed] [Google Scholar]
- 8.Pao SS, Paulsen IT, Saier MH., Jr Major facilitator superfamily. Microbiol Mol Biol Rev. 1998;62:1–34. doi: 10.1128/mmbr.62.1.1-34.1998. [DOI] [PMC free article] [PubMed] [Google Scholar]
- 9.Saier MH, Jr, Tam R, Reizer A, Reizer J. Two novel families of bacterial membrane proteins concerned with nodulation, cell division and transport. Mol Microbiol. 1994;11:841–847. doi: 10.1111/j.1365-2958.1994.tb00362.x. [DOI] [PubMed] [Google Scholar]
- 10.Paulsen IT, Brown MH, Skurray RA. Proton-dependent multidrug efflux systems. Microbiol Rev. 1996;60:575–608. doi: 10.1128/mr.60.4.575-608.1996. [DOI] [PMC free article] [PubMed] [Google Scholar]
- 11.Paulsen IT, Skurray RA, Tam R, Saier MH, Jr, Turner RJ, Weiner JH, Goldberg EB, Grinius LL. The SMR family: a novel family of multidrug efflux proteins involved with the efflux of lipophilic drugs. Mol Microbiol. 1996;19:1167–1175. doi: 10.1111/j.1365-2958.1996.tb02462.x. [DOI] [PubMed] [Google Scholar]
- 12.Brown MH, Paulsen IT, Skurray RA. The multidrug efflux protein NorM is a prototype of a new family of transporters. Mol Microbiol. 1999;31:393–395. doi: 10.1046/j.1365-2958.1999.01162.x. [DOI] [PubMed] [Google Scholar]
- 13.Hvorup RN, Winnen B, Chang AB, Jiang Y, Zhou XF, Saier MH., Jr The multidrug/oligosaccharidyl-lipid/polysaccharide (MOP) exporter superfamily. Eur J Biochem. 2003;270:799–813. doi: 10.1046/j.1432-1033.2003.03418.x. [DOI] [PubMed] [Google Scholar]
- 14.Rouquette-Loughlin C, Dunham SA, Kuhn M, Balthazar JT, Shafer WM. The NorM Efflux Pump of Neisseria gonorrhoeae and Neisseria meningitidis Recognizes Antimicrobial Cationic Compounds. J Bacteriol. 2003;185:1101–1106. doi: 10.1128/JB.185.3.1101-1106.2003. [DOI] [PMC free article] [PubMed] [Google Scholar]
- 15.Tseng TT, Gratwick KS, Kollman J, Park D, Nies DH, Goffeau A, Saier MH., Jr The RND permease superfamily: an ancient, ubiquitous and diverse family that includes human disease and development proteins. J Mol Microbiol Biotechnol. 1999;1:107–125. [PubMed] [Google Scholar]
- 16.Schweizer HP. Efflux as a mechanism of resistance to antimicrobials in Pseudomonas aeruginosa and related bacteria: unanswered questions. Genet Mol Res. 2003;31:48–62. [PubMed] [Google Scholar]
- 17.Ma D, Cook DN, Alberti M, Pon NG, Nikaido H, Hearst JE. Genes acrA and acrB encode a stress-induced efflux system of Escherichia coli. Mol Microbiol. 1995;16:45–55. doi: 10.1111/j.1365-2958.1995.tb02390.x. [DOI] [PubMed] [Google Scholar]
- 18.Nikaido H. Multidrug efflux pumps of Gram-negative bacteria. J Bacteriol. 1996;178:5853–5859. doi: 10.1128/jb.178.20.5853-5859.1996. [DOI] [PMC free article] [PubMed] [Google Scholar]
- 19.Zgurskaya HI, Nikaido H. Cross-Linked Complex between Oligomeric Periplasmic Lipoprotein AcrA and the Inner-Membrane-Associated Multidrug Efflux Pump AcrB from Escherichia coli. J Bacteriol. 2000;182:4264–4267. doi: 10.1128/jb.182.15.4264-4267.2000. [DOI] [PMC free article] [PubMed] [Google Scholar]
- 20.Koronakis V, Sharff A, Koronakis E, Luisi B, Hughes C. Crystal structure of the bacterial membrane protein TolC central to multidrug efflux and protein export. Nature. 2000;405:914–919. doi: 10.1038/35016007. [DOI] [PubMed] [Google Scholar]
- 21.Ma D, Alberti M, Lynch C, Nikaido H, Hearst JE. The local repressor AcrR plays a moderating role in the regulation of acrAB genes of Escherichia coli by gobal stress signals. Mol Microbiol. 1996;19:101–112. doi: 10.1046/j.1365-2958.1996.357881.x. [DOI] [PubMed] [Google Scholar]
- 22.Ramos JL, Martinez-Bueno M, Molina-Henares AJ, Teran W, Watanabe K, Zhang XD, Gallegos MT, Brennan R, Tobes R. The TetR family of transcriptional repressors. Microbiol Mol Biol Rev. 2005;69:326–356. doi: 10.1128/MMBR.69.2.326-356.2005. [DOI] [PMC free article] [PubMed] [Google Scholar]
- 23.Schumacher MA, Miller MC, Grkovic S, Brown MH, Skurray RA, Brennan RG. Structural basis for cooperative DNA binding by two dimers of the multidrug-binding protein QacR. EMBO J. 2002;21:1210–1218. doi: 10.1093/emboj/21.5.1210. [DOI] [PMC free article] [PubMed] [Google Scholar]
- 24.Su CC, Rutherford DJ, Yu EW. Characterization of the multidrug efflux regulator AcrR from Escherichia coli. Biochem Biophys Res Comm. 2007;361:85–90. doi: 10.1016/j.bbrc.2007.06.175. [DOI] [PMC free article] [PubMed] [Google Scholar]
- 25.Rodionov DA, Gelfand MS, Mironov AA, Rakhmaninova AB. Comparative approach to analysis of regulation in complete genomes: multidrug resistance systems in gramma-proteobacteria. J Mol Microbiol Biotechnol. 2001;3:319–324. [PubMed] [Google Scholar]
- 26.Hinrichs W, Kisker C, Duvel M, Muller A, Tovar K, Hillen W, Saenger W. Structure of the Tet repressor-tetracycline complex and regulation of antibiotic resistance. Science. 1994;264:418–420. doi: 10.1126/science.8153629. [DOI] [PubMed] [Google Scholar]
- 27.Orth P, Schnappinger D, Hillen W, Saenger W, Hinrichs W. Structural basis of gene regulation by the tetracycline inducible Tet repressor-operator system. Nat Struct Biol. 2000;7:215–219. doi: 10.1038/73324. [DOI] [PubMed] [Google Scholar]
- 28.Schumacher MA, Miller MC, Grkovic S, Brown MH, Skurray RA RA, Brennan RG. Structural mechanisms of QacR induction and multidrug recognition. Science. 2001;294:2158–2163. doi: 10.1126/science.1066020. [DOI] [PubMed] [Google Scholar]
- 29.Natsume R, Ohnishi Y, Senda T, Horinouchi S. Crystal structure of a γ-butyrolactone autoregulator receptor protein in Streptomyces coelicolor A3(2) J Mol Biol. 2003;336:409–419. doi: 10.1016/j.jmb.2003.12.040. [DOI] [PubMed] [Google Scholar]
- 30.Dover LG, Corsino PE, Daniels IR, Cocklin SL, Tatituri V, Besra GS, Futterer K. Crystal structure of the TetR/CamR family repressor Mycobacterium tuberculosis EthR implicated in ethionamide resistance. J Mol Biol. 2004;340:1095–1105. doi: 10.1016/j.jmb.2004.06.003. [DOI] [PubMed] [Google Scholar]
- 31.Frenois F, Engohang-Ndong J, Locht C, Baulard AR, Villeret V. Structure of EthR in a ligand bound conformation reveals therapeutic perspectives against tuberculosis. Mol Cell. 2004;16:301–307. doi: 10.1016/j.molcel.2004.09.020. [DOI] [PubMed] [Google Scholar]
- 32.Gu R, Su CC, Shi F, Li M, McDermott G, Zhang Q, Yu EW. Crystal Structure of the transcriptional regulator CmeR from Campylobacter jejuni. J Mol Biol. 2007;372:583–593. doi: 10.1016/j.jmb.2007.06.072. [DOI] [PMC free article] [PubMed] [Google Scholar]
- 33.Brady GP, Jr, Stouten PFW. Fast prediction and visualization of protein binding pockets with PASS. J Computer-Aided Mol Des. 2000;14:383–401. doi: 10.1023/a:1008124202956. [DOI] [PubMed] [Google Scholar]
- 34.Chang DT, Oyang YJ, Lin JH. MEDock: a web server for efficient prediction of ligand binding sites based on a novel optimization algorithm. Nucl Acids Res. 2005;33:W233–W238. doi: 10.1093/nar/gki586. [DOI] [PMC free article] [PubMed] [Google Scholar]
- 35.Heldwein EEZ, Brennan RG. Crystal structure of the transcriptional activator BmrR bound to DNA and a drug. Nature. 2001;409:378–382. doi: 10.1038/35053138. [DOI] [PubMed] [Google Scholar]
- 36.Zheleznova EE, Markham PN, Neyfakh AA, Brennan RG. Structural basis of multidrug recognition by BmrR, a transcriptional activator of a multidrug transporter. Cell. 1999;96:353–362. doi: 10.1016/s0092-8674(00)80548-6. [DOI] [PubMed] [Google Scholar]
- 37.LeTilly V, CA Royer CA. Fluorescence anisotropy assays implicate protein-protein interactions in regulating trp repressor DNA binding. Biochemistry. 1993;32:7753–7758. doi: 10.1021/bi00081a021. [DOI] [PubMed] [Google Scholar]
- 38.Heyduk T, Lee JC. Application of fluorescence energy transfer and polarization to monitor Escherichia coli camp receptor protein lac promoter interaction. Proc Natl Acad Sci USA. 1990;87:1744–1748. doi: 10.1073/pnas.87.5.1744. [DOI] [PMC free article] [PubMed] [Google Scholar]
- 39.Morris GM, Goodsell DS, Halliday RS, Huey R, Hart WE, Belew RK, Olson AJ. Automated docking using a Lamarckian genetic algorthm and an empirical binding free energy function. J Computat Chem. 1998;19:1639–1662. [Google Scholar]
- 40.Schumacher MA, Miller MC, Brennan RG. Structural mechanism of the simultaneous binding of two drugs to a multidrug-binding protein. EMBO J. 2004;23:2923–2930. doi: 10.1038/sj.emboj.7600288. [DOI] [PMC free article] [PubMed] [Google Scholar]
- 41.Webber MA, Piddock LJV. Absence of mutations in marRAB or soxRS in acrB-overexpressing fluoroquinolone-resistant clinical and veterinary isolates of Escherichia coli. Antimicrob Agents Chemother. 2001;45:1550–1552. doi: 10.1128/AAC.45.5.1550-1552.2001. [DOI] [PMC free article] [PubMed] [Google Scholar]
- 42.Li M, Qiu X, Su C-C, Long F, Gu R, McDermott G, Yu EW. Cloning, Expression, Purification, Crystallization and Preliminary X-ray Diffraction Analysis of the Regulator AcrR from Escherichia Coli. Acta Cryst. 2006;F62:1150–1152. doi: 10.1107/S1744309106042576. [DOI] [PMC free article] [PubMed] [Google Scholar]
- 43.Otwinowski Z, Minor M. Processing of X-ray diffraction data collected in oscillation mode. Methods Enzymol. 1997;276:307–326. doi: 10.1016/S0076-6879(97)76066-X. [DOI] [PubMed] [Google Scholar]
- 44.Weeks CM, Shah N, Green ML, Miller R, Furey H. Automated web- and grid-based protein phasing with BnP. Acta Cryst. 2005;A61:C152. [Google Scholar]
- 45.Terwilliger TC. Maximum-likelihood density modification using pattern recognition of structural motifs. Acta Cryst. 2001;D57:1755–1762. doi: 10.1107/S0907444901013737. [DOI] [PMC free article] [PubMed] [Google Scholar]
- 46.Jones TA, Zou J-Y, Cowan SW, Kjeldgaard M. Improved methods for binding protein models in electron density maps and the location of errors in these models. Acta Cryst. 1991;A47:110–120. doi: 10.1107/s0108767390010224. [DOI] [PubMed] [Google Scholar]
- 47.Brünger AT, Adams PD, Clore GM, DeLano WL, Gros P, Grosse-Kunstleve RW, Jiang JS, Kuszewski J, Nilges M, Pannu NS, Read RJ, Rice LM, Simonson T, Warren GL. Crystallography & NMR system: A new software suite for macromolecular structure determination. Acta Cryst. 1998;D54:905–921. doi: 10.1107/s0907444998003254. [DOI] [PubMed] [Google Scholar]
- 48.Collaborative Computational Project, Number 4. The CCP4 suite programs for protein crystallography. Acta Cryst. 1994;D50:764–767. doi: 10.1107/S0907444994003112. [DOI] [PubMed] [Google Scholar]
- 49.Murshudov A, Vagin A, Dodson EJ. Refinement of macromolecular structures by the maximum-likelihood method. Acta Cryst. 1997;D53:240–255. doi: 10.1107/S0907444996012255. [DOI] [PubMed] [Google Scholar]
- 50.Perrakis A, Morris R, Lamzin VS. Automated protein model building combined with iterative structure refinement. Nature Struct Biol. 1999;6:458–463. doi: 10.1038/8263. [DOI] [PubMed] [Google Scholar]
- 51.ORIGIN Ver. 7.5. OriginLab Corporation, Northampton, Massachusetts, USA.
- 52.DeLano WL. The PyMOL molecular graphics system. 2002 http://www.pymol.sourceforge.net.