

Abstract
Superior canal dehiscence (SCD) is a pathological condition of the ear that can cause a conductive hearing loss. The effect of SCD (a hole in the bony wall of the superior semicircular canal) on chinchilla middle- and inner-ear mechanics is analyzed with a circuit model of the dehiscence. The model is used to predict the effect of dehiscence on auditory sensitivity and mechanics. These predictions are compared to previously published measurements of dehiscence related changes in chinchilla cochlear potential, middle-ear input admittance and stapes velocity. The comparisons show that the model predictions are both qualitatively and quantitatively similar to the physiological results for frequencies where physiologic data are available. The similarity supports the third-window hypothesis of the effect of superior canal dehiscence on auditory sensitivity and mechanics and provides the groundwork for the development of a model that predicts the effect of superior canal dehiscence syndrome on auditory sensitivity and mechanics in humans.
I. INTRODUCTION
Superior canal dehiscence (SCD) syndrome is an inner-ear disorder in which patients develop a hole (a dehiscence) in the bony wall between the superior semicircular canal and the brain case. Patients afflicted with this disorder present to the clinic with vestibular and/or auditory symptoms. The auditory symptoms include a conductive hearing loss (Minor et al., 2003; Mikulec et al., 2004) and abnormal middle-ear mechanics (Rosowski et al., 2004; Songer and Rosowski, 2006; Chien et al., 2007). It has been proposed that the SCD acts as a pathological “third window” into the inner ear (the round window and oval window are the two normal windows) giving rise to both the auditory and vestibular symptoms associated with SCD syndrome (Rosowski et al., 2004; Minor et al., 1998; Songer and Rosowski, 2005). In general, a third window is an additional compressibility located somewhere within the inner ear that leads to changes in the volume velocities at the two normal cochlear windows (the round and oval windows). Depending on its location, the third window can decrease the stimulus to the cochlea. For example, if the third window is opened on the vestibular side of the inner ear (as in SCD, posterior canal dehiscence (Krombach et al., 2003; Brantberg et al., 2006), and enlarged vestibular aqueduct syndrome (Mimura et al., 2005)) we predict that sound energy will be shunted through the new window away from the cochlea. On the other hand, if the new window were opened in the scala tympani near the round window, it should have little effect on hearing.
The purpose of this paper is to assess mechanisms by which an opening in the normally continuous bony wall of the superior canal (i.e., a dehiscence) can affect hearing sensitivity and middle-ear sound conduction. To address these issues we codify the third-window hypothesis of SCD using a simple circuit model (Fig. 1). Specifically, we create a lumped-element model of the superior semicircular canal (SC) including the SC hole or dehiscence (SCD) and combine it with a two-port model of the middle ear (Songer and Rosowski, 2007) to predict the effect of a SCD on auditory sensitivity and mechanics in response to air-conducted sound stimuli in chinchilla. The effect of a SCD on the model volume velocities and pressures is related to changes in auditory sensitivity and middle-ear mechanics and then compared to previously reported data in chinchilla (Songer and Rosowski, 2005, 2006). The specific goal of this work is to test the third-window hypothesis of SCD-induced hearing loss by comparing model predictions with the physiologic effects of the SCD (Songer and Rosowski, 2005, 2006).
FIG. 1.
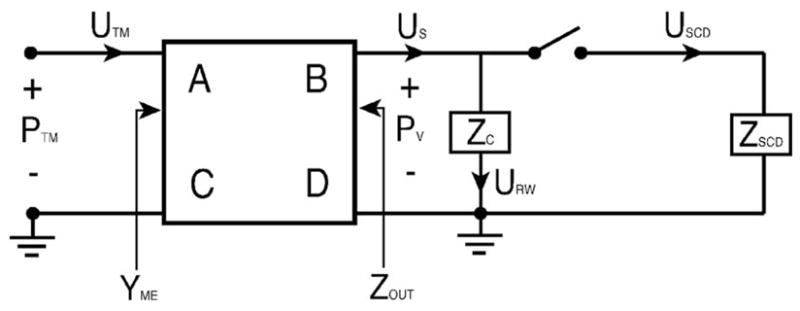
Schematic of the mechano-acoustic model of the effect of SCD on auditory sensitivity. The middle ear is represented by a two port with four transmission matrix parameters (A, B, C, and D), the cochlea by Zc, and the SCD by ZSCD. YME stands for the middle-ear input admittance and Zout stands for the middle-ear output impedance. PTM and Pυ represent the sound pressures at the tympanic membrane and in the vestibule, respectively. UTM, US, URW, and USCD represent the volume velocities of the tympanic membrane, stapes, round window and within the dehiscent canal.
II. ANATOMICALLY BASED MODEL OF ZSCD
The model structure for the chinchilla ear that we used is illustrated in Fig. 1. A model of a dehiscent ear is coupled to a two-port representation of the chinchilla middle ear (Songer and Rosowski, 2007). The structure of the dehiscence model is based upon a codification of the third-window hypothesis, which suggests that the SCD adds a shunt pathway to the inner ear that reduces the stimulus to the cochlea. In order to characterize the impedance of the SCD (ZSCD) we assume that the impedance of this additional pathway is due to fluid flow through the dehiscent SC. Since the wavelengths (in fluid) of the sound stimuli are much much greater than the dimensions of the canal, a lumped-element model characterization of ZSCD is appropriate. To define our lumped-element model, a more complete description of chinchilla SC anatomy was necessary.
A. Anatomical reconstruction
We created a histological reconstruction of one chinchilla inner ear in which the effect of a surgically induced SCD on hearing had been evaluated (Songer and Rosowski, 2006). The reconstruction allowed us to determine the precise size and location of the dehiscence. To create the reconstruction the chinchilla head was fixed, decalcified, embedded in celloidin, and cut into 20 μm sagittal sections. Registered digital photographs of the sections were then created, and every fourth section was imported into Amira®, a program designed for three-dimensional (3D) reconstructions of histological images. Within Amira, we segmented the bone and fluid filled spaces of the inner ear, and produced a scaled 3D reconstruction of the cochlear and vestibular structures. The 3D reconstruction allowed us to measure precisely the size and location of the dehiscence as well as other relevant canal dimensions illustrated in Fig. 2.
FIG. 2.
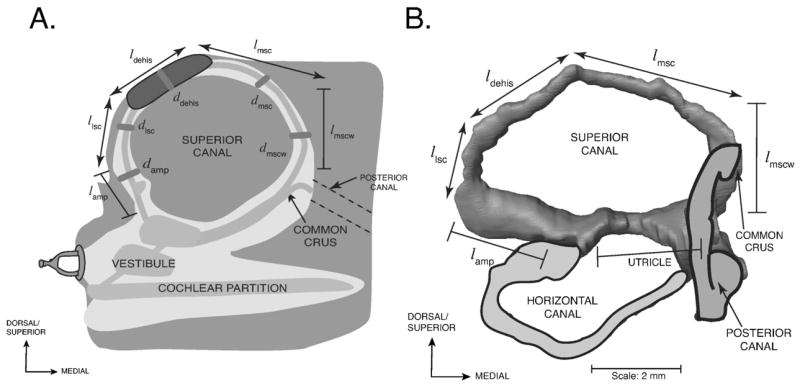
A) A schematic of the reconstructed superior canal (SC) of the left ear of a chinchilla in the canal’s plane. Labels with the first letter l are lengths; the ds are canal diameters. The dimensions are provided in Table I. Lengths with double-sided arrows represent variable dimensions that depend on the size and location of the dehiscence and lengths with bars represent fixed dimensions. The utricle and saccule sit within the vestibule of the inner ear. B) A reconstruction of the chinchilla bony superior semicircular canal illustrating the defined parameter lengths. The outlines of the membranous posterior and horizontal canals as well as the superior portion of the vestibule (near the utricle) are included for reference.
Table I lists the estimates of the anatomical dimensions gathered from the reconstruction of one chinchilla ear. A schematic illustrating how each component was defined is illustrated in Fig. 2. The length of the ampulla (ℓamp) is the distance between the utricle and the narrowing of the canal. The length of the lateral branch of the SC (ℓlsc) is the length of the SC between the end of the ampulla and the dehiscence. The length of the dehiscence (ℓdehis) is the distance from one end of the dehiscence to the other. The length of the wide segment of the medial SC (ℓmscw) is the length from the beginning of the SC at the utricle to the narrowing of the SC (immediately after the common crus). The length of the medial branch of the SC (ℓmsc) is the length of the canal from the medial end of the dehiscence to the beginning of the common crus. The sum of the lengths ℓmsc, ℓdehis, and ℓlsc is 7.7 mm.
TABLE I.
Anatomical parameters determined from the reconstruction of the SC from one ear along with the values used in the model. The lengths are listed showing a range of values where applicable. The radii are listed showing the mean and standard deviations.
| Parameter | Definition | Measurements (mm) | Model (mm) |
|---|---|---|---|
| ℓamp | Length of ampulla | 2.5 | 2.5 |
| aamp | Radius of ampulla | 0.42±0.17 | 0.42 |
| ℓlsc | Length of lateral SC branch | 0.1<ℓlsc<5.0 | 2.5 |
| alsc | Radius of lateral SC branch | 0.18±0.02 | 0.18 |
| ℓdehis | Length of dehiscence | 0.1<ℓdehis<2.0 | 1.0 |
| adehis | Radius of dehiscence | 0<adehis<alsc | 0.18 |
| ℓmsc | Length of medical SC branch | 7.7-ℓlsc-ℓdehis | 4.2 |
| amsc | Radius of medical SC branch | 0.14±0.02 | 0.14 |
| ℓmscw | Length of wide medial SC branch | 3.0 | 3.0 |
| amscw | Radius of wide medial SC branch | 0.55±0.42 | 0.55 |
| ℓbone | Width of the SC wall | 0.18±0.02 | 0.18 |
The length, diameter and location of the dehiscence can vary. The dimensions affected by these variations are: ℓlsc, ℓmsc, and ℓdehis, which are illustrated in Fig. 2 with double-sided arrows. In our surgical preparation ℓlsc could extend about 5.0 mm from the ampulla to where the SC enters the cranial cavity. This 5.0 mm range is the region where it was surgically possible to place a dehiscence. However, our dehiscences were typically located 2.5 mm from the ampulla resulting in an ℓlsc of 2.5 mm and were typically 1.0 mm in length resulting in an ℓdehis of 1.0 mm. This resulted in an ℓmsc value of 4.2 mm (7.7-2.5-1).
The diameter of each bony canal segment was the average diameter of multiple locations (approximately 100 μm intervals). Since the bony canal is not perfectly circular in cross section, the mean of the multiple diameter measurements and the measurements of the diameter in the perpendicular plane were averaged for each tube segment to define the diameter of the segment. These measurements were made in one chinchilla ear and variations between animals may exist. Figure 2 illustrates the measured diameters from which the radii listed in Table I are determined. The radius of the canal near the dehiscence was considered to be equal to alsc with a value of 0.18 mm. The radius of the dehiscence itself could range between 0 and the radius of the canal, 0.18 mm. The surgically induced dehiscences in this study typically had radii, adehis, of 0.18 mm (which was sometimes rounded to 0.2 mm) and lengths, ℓdehis, of 1.0 mm.
B. Model of the SC with dehiscence
Figure 3 shows the model structure of ZSCD. The model consists of three blocks. The first block consists of two two-port tube models (Egolf, 1977) that account for the lateral branch of the SC including the ampulla of the SC (Zamp) and the SC segment lateral to the dehiscence (Zlsc). In parallel with these two ports is the second block, another set of two ports which model sound flow through the medial branch of the SC, first the wide segment (Zmscw) and then the narrower segment (Zmsc). In series with the upper output nodes of the canal segments is the third block representing the impedance of the dehiscence, Zdehis. Zdehis has two parts: the acoustic impedance associated with sound flow through the fluid-filled hole in the bone (Zhole) and the radiation of sound away from the hole (Zrad) into the air-filled middle ear.
FIG. 3.

Model of the SC impedance. Zamp, Zlsc, Zmscw, and Zmsc are transmission matrices used to determine the impedance of both the medial and lateral branches of the SC, each of which extends to the dehiscence. Zdehis, a combination of Zhole, which represents the impedance of the fluid in the hole in the bony canal wall, and Zrad, the radiation impedance from the hole to the air-filled middle-ear space of the chinchilla.
For the purpose of this model we assume that the SC extends from the boundary between the utricle and the wide segment of the medial branch of the SC to the boundary between the ampulla and the utricle. These anatomical boundaries were defined to simplify the tube calculations.
1. Defining Zdehis
The dehiscence itself (Zdehis) is modeled as the series combination of the impedance of the hole in the bone and the radiation of sound from the hole into air. The radiation of sound from the hole depends on the medium outside the hole and the size of the hole. In our chinchilla measurements, this medium is the air within the opened middle-ear cavity. We use a radiation impedance computed for sound in air to account for sound radiation from the hole into the open cavity. The radiation impedance is approximated using the equations for a piston (where the fluid interface inside the hole is considered to act like a piston) in an infinite baffle (Beranek, 1998, p. 121).1 The radiation impedance represents the impedance at the boundary between the inner ear fluid within the dehiscence and the air-filled middle-ear cavities.
The hole in the bone is then modeled as a small-sized fluid-filled tube with a length equal to the thickness of the bony wall surrounding the canal (ℓbone). The radius of the tube (ahole) is the effective radius of the dehiscence, usually an average of adehis (half the width of the dehiscence) and half the length of the dehiscence . Both the width of the dehiscence and the length of the dehiscence have been estimated for each individual ear and the length and width used in the model are typical of those seen in the individual ears. In ears in which we wanted to evaluate the effect of dehiscence size, we also looked at dehiscences where adehis was smaller than the radius of the canal, and in these cases ahole= adehis and ℓdehis= adehis.
Once ahole has been defined, the impedance of the hole is calculated using equations from Beranek, 1998,2 using his small-size tube approximation (p.135) and values for the density and viscosity of water at 37°C. This specification of the hole impedance yields an intuitive result in that smaller holes correspond to larger impedances. Specifically, as the size of the dehiscence approaches zero the sound flow through the dehiscence reduces to zero.
Zdehis is then evaluated as the simple series combination of the fluid-filled hole, Zhole, and the radiation of sound into the air-filled middle ear, Zrad.3
2. Branches of the SC and ZSCD
Two ports are used to model the two branches of the SC resulting from dehiscence. The modeled tube segments are the lateral tube, including the ampulla and the lateral segment of the SC, and the medial tube, including both the wide and narrow portions of the medial segment of the SC (Fig. 3). The two ports are described in terms of lossy transmission matrices that account for the viscosity of the fluids.4,5 The transmission matrix approach allows us to represent the entire length of either the medial or lateral tube as the product of transmission matrices representing smaller tube segments, assuming that neither the cross-sectional area of the tube nor its contents change significantly from one segment to the next. Since the canal diameter does not exhibit any abrupt widenings or narrowings in the regions we are looking at, the first condition is met and since all of the tubes are filled with the same fluid contents, the second condition is also held to be true. We then assume that the cross-sectional dimensions of the vestibule and common crus are large relative to the dimensions of the SC and that these large cross sections contribute little to the impedance associated with fluid motion through the dehiscent canal. Based on these assumptions we model the acoustic effects of the fluid in the vestibule and common crus as an end correction to the length of the SC (Beranek, 1998, p. 132). Specifically, an end correction is added to both ℓmscw and ℓamp.
To calculate ZSCD, Zhole and Zrad are placed in series, and are the load on the parallel combination of impedance of the medial and lateral branches of the superior semicircular canal. We simplified this calculation by replacing the transmission matrix representations of the medial and lateral branches with lumped element impedances equivalent to the input impedance of each tube section. A two port can be replaced with an equivalent lumped element parameter if the current at the input and output terminals are equal (Uin =Uout).6 Using our parameter values, Uout is within 1% of Uin in each branch tube in the 100–8000 Hz frequency range. The equivalent lumped elements of the two canal branches are well approximated by simple acoustic masses over this frequency range.
III. MODEL PREDICTIONS OF THE EFFECT OF SCD ON THE INNER EAR LOAD
When a dehiscence is placed in the SC, ZSCD, which is represented by the model in Fig. 3, is placed in parallel with the normal cochlear input impedance (Fig. 1). This parallel combination defines the load of the dehiscent inner ear on the middle ear. Figure 4 illustrates the Zc for the intact ear, as described by our earlier analysis (Songer and Rosowski, 2007), the ZSCD associated with a 1-mm-long dehiscence located 2.5 mm medial to the ampulla (using the dehiscence parameters described in Table I) and the parallel combination of Zc and ZSCD, Zc||scd. In the case of a 1 mm dehiscence at this location, ZSCD is dominated by the acoustic mass of the fluid within the medial and lateral tube segments; there is little contribution from the hole and the radiation impedance (Zdehis is at least 30 dB less than ZSCD for frequencies between 100 and 8000 Hz). The mass-like ZSCD controls the impedance of the dehiscent inner ear at frequencies below 800 Hz. Above 800 Hz, the impedance of the parallel combination of Zc||scd depends on both the mass-dominated ZSCD and the more resistive Zc. The dehiscence has nearly no effect at frequencies above 4 kHz, where the lower impedance of the cochlea dominates the load of the dehiscent inner ear on the middle ear.
FIG. 4.
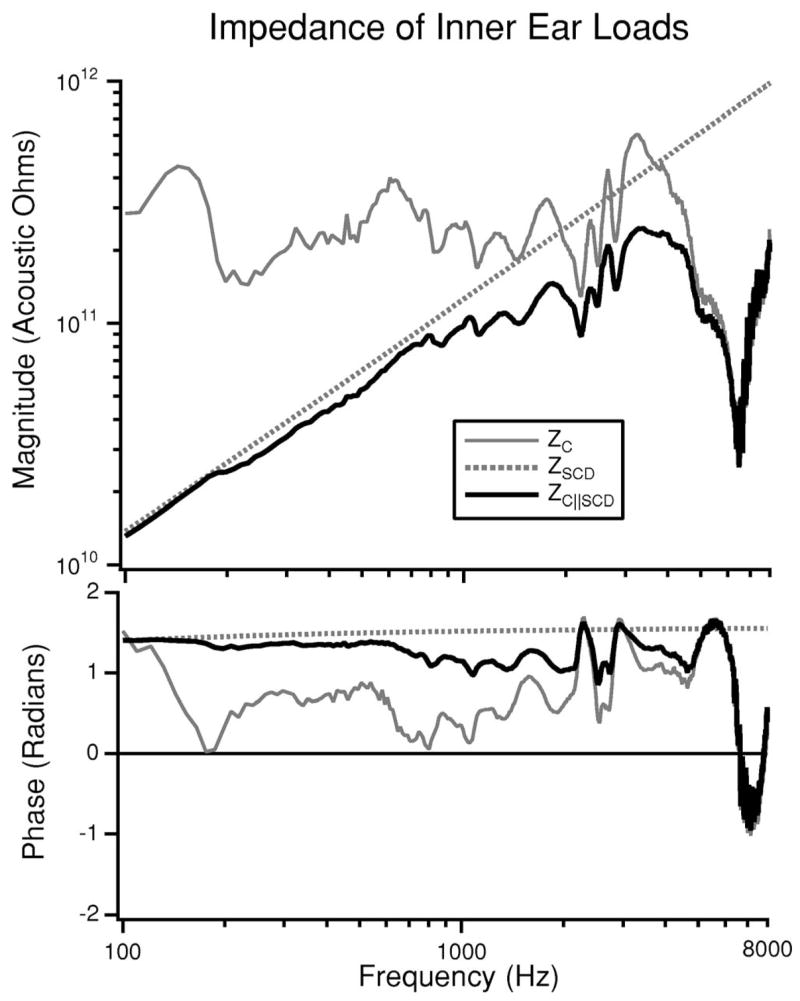
The load on the middle ear due to the inner ear is illustrated both before and after the introduction of a SCD. In the intact ear, the load is Zc (Songer and Rosowski, 2007). After the introduction of the dehiscence the load is the parallel combination of Zc and ZSCD (Fig. 3) and is illustrated as Zc||scd.
IV. MODEL PREDICTIONS OF THE EFFECT OF DEHISCENCE ON MIDDLE-EAR SOUND TRANSMISSION
Our model of the effect of SCD on auditory sensitivity and mechanics uses the lumped-element representation of ZSCD described in the previous sections as well as an experimentally derived representation of the middle ear and Zc (Songer and Rosowski, 2007). In order to establish the validity of the model, predictions are made of the effects of SCD on three model variables and compared to previous measurements of the same: middle-ear input admittance, YME (Songer and Rosowski, 2005), middle-ear transfer function, Hp (Songer and Rosowski, 2006), and cochlear potential normalized by PTM, G (Songer and Rosowski, 2005).7 The model without the dehiscence has previously been demonstrated to fit normal measurements of admittance and middle-ear transfer function (Songer and Rosowski, 2007). In our comparisons here, we concentrate on dehiscence induced changes.
We evaluate the SCD-induced change in YME as the dB difference between YME after the introduction of SCD and YME in the intact ear and refer to this value as ΔYME where and ∠ΔYME= ∠YME|SCD − ∠YME. The model predictions of ΔYME and the ΔYME measured in eight chinchilla ears (Songer and Rosowski, 2006) are illustrated in Fig. 5. The model prediction of ΔYME fit within the 95% confidence intervals for the data over almost the entire frequency range. This suggests that the model accurately predicts dehiscence related changes in middle-ear input admittance.
FIG. 5.
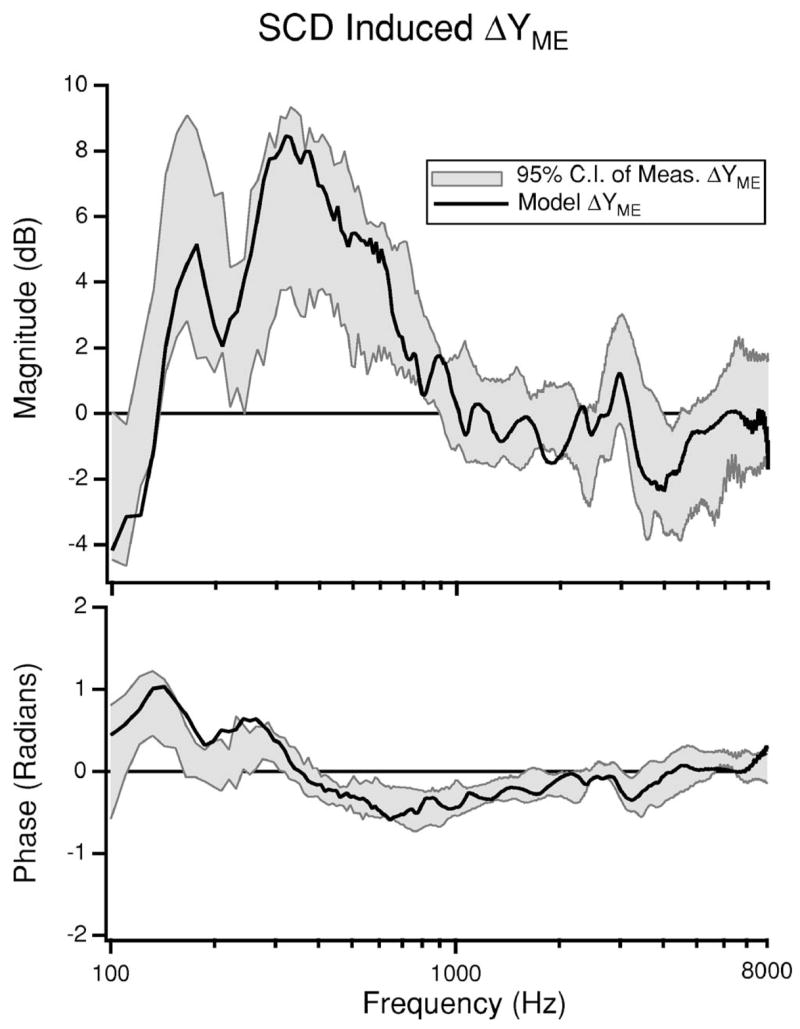
Model prediction of ΔYME resulting from dehiscence presented in dB. The model prediction is plotted with the 95% confidence intervals of the ΔYME measured in eight chinchilla ears (Songer and Rosowski, 2006) for comparison.
The model prediction of SCD-induced change in Hp is represented as ΔHp (the difference in Hp before and after the introduction of an SCD) and is compared to the 95% confidence interval of measurements of ΔHp (n=6) from a previous study (Songer and Rosowski, 2006) (Fig. 6). The model prediction of ΔHP is within the 95% confidence intervals of the measurements over almost the entire frequency range.
FIG. 6.

Model prediction of ΔHp resulting from dehiscence. The 95% confidence intervals from previous measurements of ΔHp in six chinchilla ears (Songer and Rosowski, 2006) are presented for comparison.
The close fit between the model predictions of both ΔYME and ΔHp indicate that our model (Fig. 1) effectively predicts changes in auditory mechanics that result from the introduction of a dehiscence.
In addition to evaluating changes in auditory mechanics, we also evaluate the change in hearing sensitivity predicted by the model and compare it to the measured change in cochlear potential (CP) published previously (Songer and Rosowski, 2006). The effect of SCD on hearing is modeled as the change in volume velocity through Zc normalized by sound pressure at the tympanic membrane . We assume that the changes in volume velocity through Zc reflect changes in the effective stimulus to the cochlea and are proportional to changes in cochlear potential normalized by sound pressure (i.e., ). The model predicted SCD-induced change in G is presented as a dB difference, ΔG, and compared to measurements of ΔG from a previous study (n=6) (Songer and Rosowski, 2005) (Fig. 7).
FIG. 7.
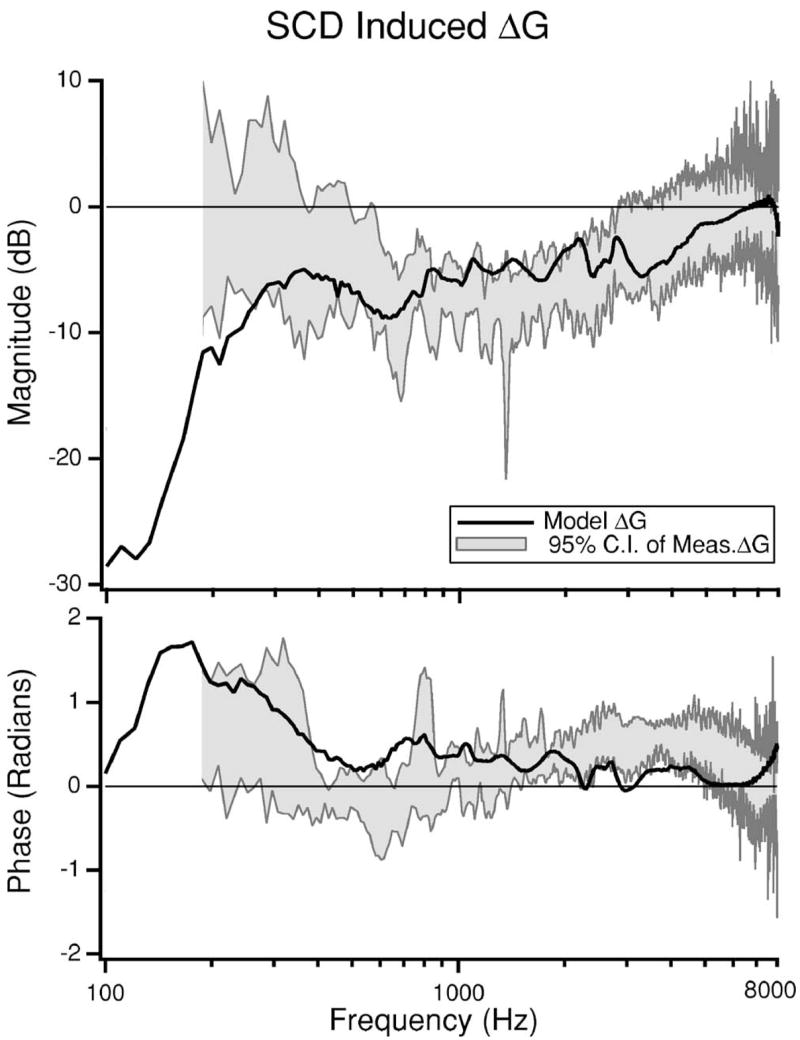
Model prediction of the SCD induced change in auditory sensitivity (ΔG) presented in dB. The 95% confidence intervals of measurements of ΔG from six chinchilla ears made in a previous study are also illustrated (Songer and Rosowski, 2005). Measurement data for frequencies below 200 Hz are near the noise floor and are not illustrated.
Below 200 Hz the measurements of G are close to the noise floor (within 10 dB) and are not plotted. For frequencies above 300 Hz the model prediction fits within the 95% confidence intervals of the data. Below 300 Hz our prediction overestimates the decrease in ΔG resulting from dehiscence. One reason why the model fit might be off for low frequencies is the difficulty in acquiring low-frequency CP data (Songer and Rosowski, 2005) that are not contaminated by noise. Another possible source of discrepancy may arise from inner ear nonlinearities that have been observed between 80 and 300 Hz in chinchilla (Dallos, 1970; Songer and Rosowski, 2006; Rosowski, Ravicz, and Songer, 2006) that may affect the experimental results, but may not be effectively captured by the model. Overall, however, the model succeeds in predicting the observed decrease in auditory sensitivity to air-conducted sound.
V. DISCUSSION
We report a model of the auditory effects of dehiscence in chinchilla. The model predicts a decrease in hearing sensitivity as well as an increase in both middle-ear input admittance and the middle-ear transfer function magnitude associated with SCD. These predictions are a good match to the experimentally observed data (Songer and Rosowski, 2005, 2006) as presented above.
A. Model limitations and adaptations
The model described in this paper consists of three major elements: the middle ear represented as a two port, the cochlea represented by Zc, and the superior semicircular canal, including the dehiscence, represented as ZSCD. Each segment of the model is subject to a number of assumptions that may affect the reliability of the model predictions. One limitation of the model is the frequency range of validity for the transmission matrix representation of the middle ear as well as the calculated value for Zc. As described in detail in Songer and Rosowski, 2007, the physiologic measurements from which they were determined were most reliable for frequencies between 100 and 1500 Hz; it is therefore possible that errors in these model elements could be introduced into our predictions at frequencies above 1500 Hz. Due to the high degree of similarity between the measured and predicted responses for YME, Hp, and auditory sensitivity across the entire frequency range, we do not believe that this potential restriction is negatively influencing our results.
The model structure and layout presented here for chinchilla may be adapted to predict the effect of SCD on auditory parameters in humans. In order to implement a human model of SCD based on this work, an existing middle-ear model could be used in conjunction with the lumped-element model of the SCD presented here, but adapted to reflect human anatomical and physiological parameters. Important anatomical and physiological differences that need to be addressed include: differences in sound transmission through the human middle ear, the addition of closed middle-ear air spaces in human patients, the state of the middle-ear muscles (they have been inactivated in our animal measurements), the dimensions of the semicircular canal, differences in the size and location of the dehiscence, and the fact that the dehiscence in humans opens into the cranial cavity and is bounded by the brain and its surrounding membranes and fluid spaces. Implementing this model structure for humans and accounting for the differences described above will allow us to test the hypothesized mechanism of SCD-induced changes in auditory sensitivity and may provide insight into the variability of patient presentation.
B. Clinical relevance
Previous work has compared the effect of SCD in chinchilla (Songer and Rosowski, 2005, 2006) with clinical data obtained from human patients (Minor et al., 2003; Mikulec et al., 2004) and from temporal bones (Chien et al., 2007). These comparisons demonstrate decreases in our measures of auditory sensitivity in response to SCD that are qualitatively similar: a decrease in auditory sensitivity measured as a decrease in cochlear potential in chinchilla (Songer and Rosowski, 2005) and as an air-bone gap in human patients (Minor et al., 2003; Mikulec et al., 2004). Qualitative comparisons of the effect of SCD on auditory mechanics show increases in both Hp and YME in chinchilla (Songer and Rosowski, 2006), increases in umbo velocity in humans (Rosowski et al., 2004), and increases in stapes velocity in human temporal bones (Chien et al., 2007).
Despite the qualitative similarities between the chinchilla and human physiological data, it is difficult to make quantitative comparisons. Part of this difficulty is due to the wide variation in patient symptoms. Some patients with SCD syndrome have large air-bone gaps and some patients have no auditory symptoms (no air-bone gap). We hypothesize that these differences may be due to differences in the structure and state of the middle ear, the size of the dehiscence, the location of the dehiscence and other anatomical parameters. In the next section we look at how some of these differences (dehiscence size and location) affect auditory sensitivity in chinchilla.
C. Predicted effect of variations in dehiscence size and location
A question relevant to the diagnosis of SCD is “How do patient symptoms vary with dehiscence size and location?” Using our model we can predict the effect of variations in dehiscence size on auditory sensitivity in chinchilla. These effects are modeled by varying the radius and length of the dehiscence, resulting in changes in SCD area and the lengths of the lateral and medial limbs of the canal remnants. In Fig. 8(A) the model predictions of the effect of dehiscence size on the frequency dependence of the hearing loss are plotted along with the 95% confidence intervals from measurements with areas between 0.24 and 1.0 mm2 Songer and Rosowski, 2005. Figure 8(A) demonstrates that small dehiscences have little effect on ΔG, and large dehiscences result in predicted changes similar to those observed experimentally Songer and Rosowski, 2005. Figure 8(A) also suggests that the SCD induced hearing loss is largest at low frequencies. Figure 8(B) plots the predicted change in auditory sensitivity at three frequencies as a function of dehiscence area. Figure 8(B) demonstrates that very small dehiscences have little effect on auditory sensitivity, however, as the dehiscence size approaches the cross-sectional area of the canal auditory sensitivity decreases. Once the dehiscence size exceeds the cross-sectional area of the canal (adehis>0.2 mm, area =0.13 mm2) there is little additional change in ΔG.
FIG. 8.

The predicted effect of SCD size on ΔG. For reference, the estimated cross sectional area of the SC is 0.13 mm2. A) The model predictions as a function of frequency along with the 95% confidence interval (CI) from measurements (areas between 0.24 and 1.0 mm2) (Songer and Rosowski, 2005) are illustrated for comparison. Note that the curves for areas of 0.13 and 1.0 mm2 are difficult to distinguish because there is little difference between them. B) The model predictions at select frequencies (250, 500, and 1000 Hz) plotted as a function of SCD area. The arrow indicates the cross-sectional area of the canal.
The effect of dehiscence location can also be predicted using the model. Figure 9 shows the predicted effect of dehiscence location on ΔG where the size of the SCD is fixed at ahole = 0.2 mm, ℓdehis = 1 mm. It predicts that as the SCD gets closer to the ampulla, the decrease in ΔG resulting from the dehiscence gets slightly larger. These changes are small and most of the curves fall within the 95% confidence interval of the measured data indicating that they fall within predicted inter-animal differences.
FIG. 9.

Predicted effect of dehiscence location on ΔG. All the predictions are for dehiscences that are 0.4 mm in diameter and 1.0 mm in length; ℓlsc refers to the distance between the ampulla and the dehiscence and is varied as illustrated in the figure. The 95% CI from the previously reported measured ΔG (Songer and Rosowski, 2005) is illustrated for comparison.
All of the dehiscences reported in human patients with SCD syndrome are large, typically with short dimensions equal to the radius of the canal and lengths on the order of millimeters. Our model predictions suggest that slight variations in these large dehiscence sizes are not expected to account for the wide variations in hearing sensitivity observed in human patients with SCD syndrome. The model does suggest small changes in auditory sensitivity resulting from variations in dehiscence location, but such small changes cannot account for large variations observed in the presentation of auditory symptoms in patients (Minor et al., 2003; Mikulec et al., 2004). One caveat is that we only tested the effect of dehiscence location within the range where we had surgical access to the SC through the chinchilla middle-ear air space. These results suggest that developing a model of SCD in humans where dehiscence location can be manipulated may lead to a better understanding of the potential effect of dehiscence location on auditory sensitivity. The model does not predict whether changes in size and location of dehiscence would affect vestibular symptoms.
VI. CONCLUSIONS
We created a histological reconstruction of the chinchilla inner ear and used it to define anatomical parameters for a lumped-element model of the chinchilla superior semicircular canal, including dehiscence. The model was then used to predict the effects of a SC hole or dehiscence on both auditory sensitivity and mechanics. These predictions are consistent with previous physiological data showing decreases in the magnitude of cochlear potential in response to dehiscence as well as increases in both middle-ear input admittance and middle-ear transfer function magnitude in response to dehiscence. Additionally, the model predicts the effect of dehiscence location and size on auditory sensitivity and mechanics and provides a framework for generating a model of the effect of SCD on human patients.
Acknowledgments
This work has been supported by a NSF graduate student fellowship, NIH training grant, and additional NIH grants. S. N. Merchant, C. A. Shera, W. T. Peake, M. E. Ravicz, and M. L. Wood provided insights and suggestions.
Footnotes
The radiation impedance we use is described by Beranek, 1998, p. 121, and is defined below:
The impedance of the hole as defined by Beranek, 1998, p. 135, is calculated as follow:
Note that as dehiscence size approaches zero, Zdehis approaches infinity, effectively closing the third window. The appropriateness of the small-size tube approximation was evaluated by comparing it to the exact solution. Differences between the exact solution and the above approximation were less than 2.5 dB in magnitude.
In these ears the membranous labyrinth and endosteum are typically still intact, which could lead to a membranous covering over the hole. This is not explicitly accounted for in the model. The decision not to include these membranes was based on observations that presence or absence of a membrane at the interface between the fluid and air did not impact our measured results and we wanted to keep the model as simple as possible.
The lossy transmission-line models of tube segments that we use were first described by Egolf, 1977, and adapted for fluid filled tubes by Dickens, 1986, as follows:
J1()and J0()are Bessel functions of order 1 and 0 and ω refers to 2π times the frequency. The arguments to the Bessel functions are dimensionless: and . which is the thermal diffusivity of the medium; zo is the terminating impedance of the tube.
The medium of interest for this work is inner ear lymph at body temperature. We assume that lymph is approximated by water and has the following physical properties:
γ = 1,
c = 1560 m/s,
ρ = 993 kg/m3,
κ = 0.6340 W/(m − K),
μ = 2 × 10⁻³ kg/(m − s),
cp = 4.16 × 10⁻³ J/(kg μ K).
γ is ratio of specific heats of the fluid medium, c is the speed of sound in water, ρ is the density of water, κ is the thermal conductivity of water, μ is the absolute viscosity and cp is the specific heat.
The equality of Uin and Uout depends on the transmission matrix parameters A(ω) and D(ω) of the two port equaling 1 throughout the frequency range of interest.
All of the previously reported data referred to here had dehiscence sizes that were approximately 0.4 mm, in diameter and 1.0 mm in length.
PACS number(s): 43.64.Ha, 43.64.Tk, 43.64.Bt, 43.80.Lb [BLM]
Contributor Information
Jocelyn E. Songer, Eaton-Peabody Laboratory of Auditory Physiology, Massachusetts Eye and Ear Infirmary, 243 Charles St., Boston, Massachusetts 02114, and Speech and Hearing Bioscience and Technology, Health Sciences and Technology, Harvard-MIT, Cambridge, Massachusetts 02138.
John J. Rosowski, Eaton-Peabody Laboratory of Auditory Physiology, Massachusetts Eye and Ear Infirmary, 243 Charles St., Boston, Massachusetts 02114, Speech and Hearing Bioscience and Technology, Health Sciences and Technology, Harvard-MIT, Cambridge, Massachusetts 02138, and Department of Otology and Laryngology, Harvard Medical School, Boston, Massachusetts 02114
References
- Beranek LL. Acoustics. American Institute of Physics; New York: 1998. [Google Scholar]
- Brantberg K, Bagger-Sjoback D, Mathiesen T, Witt H, Pansell T. Posterior canal dehiscence syndrome caused by an apex cholesteatoma. Otol Neurotol. 2006;27(4):531–534. doi: 10.1097/01.mao.0000201433.50122.62. [DOI] [PubMed] [Google Scholar]
- Chien W, Ravicz ME, Rosowski JJ, Merchant SN. Measurements of human middle- and inner-ear mechanics with dehiscence of the superior semicircular canal. Otol Neurotol. 2007;28:250–257. doi: 10.1097/01.mao.0000244370.47320.9a. [DOI] [PMC free article] [PubMed] [Google Scholar]
- Dallos P. Low-frequency auditory characteristics: Species dependence. J Acoust Soc Am. 1970;48:489–499. doi: 10.1121/1.1912163. [DOI] [PubMed] [Google Scholar]
- Egolf D. Mathematical modeling of a probe-tube microphone. J Acoust Soc Am. 1977;61:200–205. [Google Scholar]
- Krombach GA, DiMartino E, Schmitz-Rode T, Prescher A, Haage P, Kinzel S, et al. Posterior semicircular canal dehiscence: A morphological cause of vertigo similar to superior canal dehiscence. Eur Radiol. 2003;13:1444–1450. doi: 10.1007/s00330-003-1828-5. [DOI] [PubMed] [Google Scholar]
- Mikulec A, McKenna M, Ramsey M, Rosowski JJ, Herrmann B, Rauch S, et al. Superior semicircular canal dehiscence presenting as conductive hearing loss without vertigo. Otol Neurotol. 2004;25:121–129. doi: 10.1097/00129492-200403000-00007. [DOI] [PubMed] [Google Scholar]
- Mimura T, Sato E, Sugiura M, Yoshino T, Naganawa S, Nakashima N. Hearing loss in patients with enlarged vestibular aqueduct: Air-bone gap and audiological bing test. Int J Audiol. 2005;44(8):466–469. doi: 10.1080/14992020500057665. [DOI] [PubMed] [Google Scholar]
- Minor L, Carey J, Cremer P, Lustig L, Streubel S. Dehiscence of bone overlying the superior canal as a cause of apparent conductive hearing loss. Otol Neurotol. 2003;24(2):270–278. doi: 10.1097/00129492-200303000-00023. [DOI] [PubMed] [Google Scholar]
- Minor L, Solomon D, Zinreich J, Zee D. Sound- and/or pressure-induced vertigo due to bone dehiscence of the superior semicircular canal. Arch Otolaryngol Head Neck Surg. 1998;124:249–258. doi: 10.1001/archotol.124.3.249. [DOI] [PubMed] [Google Scholar]
- Rosowski JJ, Ravicz ME, Songer JE. Structures that contribute to middle-ear admittance in chinchilla. J Comp Physiol. 2006;192(12):1287–1311. doi: 10.1007/s00359-006-0159-9. [DOI] [PMC free article] [PubMed] [Google Scholar]
- Rosowski JJ, Songer JE, Nakajima HH, Brinsko KM, Merchant SN. Investigations of the effect of superior semicircular canal dehiscence on hearing mechanisms. Otol Neurotol. 2004;25:323–332. doi: 10.1097/00129492-200405000-00021. [DOI] [PubMed] [Google Scholar]
- Songer JE, Rosowski JJ. The effect of superior canal dehiscence on cochlear potential in response to air-conducted stimuli in chinchilla. Hear Res. 2005;210:53–62. doi: 10.1016/j.heares.2005.07.003. [DOI] [PMC free article] [PubMed] [Google Scholar]
- Songer JE, Rosowski JJ. The effect of superior-canal opening on middle-ear input admittance and air-conducted stapes velocity in chinchilla. J Acoust Soc Am. 2006;120(1):258–269. doi: 10.1121/1.2204356. [DOI] [PMC free article] [PubMed] [Google Scholar]
- Songer JE, Rosowski JJ. Transmission matrix analysis of the chinchilla middle ear. J Acoust Soc Am. 2007;122(2) doi: 10.1121/1.2747157. [DOI] [PMC free article] [PubMed] [Google Scholar]