

Abstract
Previously, we described a mouse model where the well-known reproductive carcinogen with estrogenic activity, diethylstilbestrol (DES), caused uterine adenocarcinoma following neonatal treatment. Tumor incidence was dose-dependent reaching >90% by 18 mo following neonatal treatment with 1000 μg/kg/d of DES. These tumors followed the initiation/promotion model of hormonal carcinogenesis with developmental exposure as initiator, and exposure to ovarian hormones at puberty as the promoter. To identify molecular pathways involved in DES-initiation events, uterine gene expression profiles were examined in prepubertal mice exposed to DES (1, 10, or 1000 μg/kg/d) on days 1–5 and compared to controls. Of more than 20 000 transcripts, approximately 3% were differentially expressed in at least one DES treatment group compared to controls; some transcripts demonstrated dose–responsiveness. Assessment of gene ontology annotation revealed alterations in genes associated with cell growth, differentiation, and adhesion. When expression profiles were compared to published studies of uteri from 5-d-old DES-treated mice, or adult mice treated with 17β estradiol, similarities were seen suggesting persistent differential expression of estrogen responsive genes following developmental DES exposure. Moreover, several altered genes were identified in human uterine adenocarcinomas. Four altered genes [lactotransferrin (Ltf), transforming growth factor beta inducible (Tgfb1), cyclin D1 (Ccnd1), and secreted frizzled-related protein 4 (Sfrp4)], selected for real-time RT-PCR analysis, correlated well with the directionality of the microarray data. These data suggested altered gene expression profiles observed 2 wk after treatment ceased, were established at the time of developmental exposure and maybe related to the initiation events resulting in carcinogenesis.
Keywords: early development, estrogen-regulated genes, endocrine disruptors, neonatal imprinting, epigenetics, carcinogenesis, hormonal carcinogenesis
INTRODUCTION
Diethylstilbestrol (DES) was prescribed for pregnant women to prevent miscarriage from the 1940s to the late 1970s. Today, the unfortunate effects of such treatment are well known; daughters and sons exposed in utero to DES exhibit numerous abnormalities in reproductive tract development and function, and daughters experience a low but significant increase in vaginal and breast cancer [1–6]. Moreover, transgenerational neoplastic effects of DES have been recently reported [7].
Perinatal exposure to DES also induced reproductive tract abnormalities in laboratory rodents including mice [8–12], rats [13,14], hamsters [15] and guinea pigs [16]. For example, when mice were treated neonatally with 2 μg DES/pup/d (approximately 1000 μg/kg/d) for the first 5 d of life, greater than 90% developed uterine adenocarcinoma by 18 mo of age [10,17]; the tumor incidence increased with increasing doses of DES [18]. These tumors followed an initiation/promotion model of hormonal carcinogenesis with developmental exposure as the initiating event, and exposure to ovarian hormones at puberty as a promoting factor [10]. Interestingly, the susceptibility for tumors was shown to be transmitted through the maternal lineage to subsequent generations of both female and male descendants. The underlying mechanisms by which developmental DES exposure causes permanent reproductive tract abnormalities and neoplasia have been proposed to involve both estrogen-dependant and epigenetic pathways [19–21].
Previous studies from our laboratory and others showed that exposure to DES during neonatal life leads to persistent elevation of certain estrogen-regulated genes including lactotransferrin (lactoferrin, Ltf), epidermal growth factor (Egf) and proto-oncogenes such as c-fos, c-jun, and c-myc [22–26]. Perinatal DES exposure also caused transient repression of Hoxa-10 and Hoxa-11 resulting in structural abnormalities [27,28], as well as, altered expression of Wnt-7a involved in cellular differentiation in the reproductive tract [29]. There was no clear evidence, however, that perinatal DES exposure-induced genetic mutations linked to later deformity or tumor development [30,31]. Although the expression of a number of genes was disturbed by developmental exposure to DES, the molecular mechanisms underlying these developmental anomalies are poorly understood.
DES is no longer prescribed for use during pregnancy, however, it remains a useful prototype estrogenic chemical to study the effects of other environmental estrogens especially if exposures occur during critical stages of development. It has been suggested that exposure to estrogenic chemicals in our environment is contributing to progressive increases in subfertility, infertility, early puberty, and hormone-related cancers [32–34]. With the neonatal DES exposure model, we showed that developmental exposure of mice to tamoxifen [35], genistein [36], and numerous other estrogenic compounds [10,37] caused uterine neoplasia later in life similar to DES. These data support the idea that DES is not a unique estrogenic chemical in causing carcinogenic effects.
To identify genes and gene networks targeted in DES-induced reproductive tract disease and dysfunction, we examined global gene expression patterns in the prepubertal mouse uterus after neonatal treatment with varying doses of DES administered on days 1–5. We chose to study the prepubertal animal rather than the neonate directly after treatment because any observed changes in the neonate could indicate transiently rather than permanently altered developmental programming. Furthermore, adult mature mice were not used because fluctuations in the estrous cycle would complicate interpretation of the data. Finally, microscopic evaluation of the 19-d-old prepubertal animal showed no morphological changes in response to the estrogens of puberty, and no preneoplastic or neoplastic changes which would include secondary gene transcript changes resulting from cell transformation rather than those involved in the etiology of the disease.
In this study, we compared our data in CD-1 mice to previous reports in 5-d-old similarly treated mice [38] and to estrogen responsive genes in the adult C57 Bl/6 murine uterus [39]; as a further comparison, we looked at differentially expressed genes in human uterine adenocarcinoma samples [40]. Data from the global expression analysis in the current study and the cross-comparisons of altered gene expression patterns in other studies provide insight into the etiology of DES-associated neoplasia.
MATERIALS AND METHODS
Animals and Neonatal Treatment
Adult CD-1 [Crl:CD-1 (ICR) BR] mice were obtained from Charles River Breeding Laboratories (Raleigh, NC) and bred to male mice of the same strain in the breeding facility at the National Institute of Environmental Health Sciences (NIEHS; Research Triangle Park, NC). Vaginal plug detection was considered day 0 of pregnancy. Pregnant mice were housed under controlled lighting (12 h light and 12 h dark) and temperature (21–22°C) conditions. Mice were housed in polysulfone-ventilated cages (Technoplast, Inc., Exton, PA) and provided with NIH-31 laboratory mouse chow and fresh water ad libitum. Mouse chow was tested for estrogenic activity [41] and found to be below the levels of detection. All animals were handled according to NIEHS/NIH guidelines and in compliance with an approved NIEHS/NIH animal care protocol.
Pregnant mice delivered their young on day 19 of gestation, pups were separated according to sex and then randomly standardized to eight female pups per litter; male pups were used in another experiment. Female pups were treated on days 1–5 with DES (Sigma, St. Louis, MO) by subcutaneous injection at doses of 1, 10, or 1000 μg/kg/d dissolved in corn oil or treated with corn oil alone as controls (n = 24 mice per treatment group). These mice are referred to throughout the remainder of the manuscript as DES-1, DES-10, DES-1000 or controls. Pups were sacrificed by CO2 asphyxiation at 19 d of age, prior to puberty, and uteri were collected and snap frozen in liquid nitrogen for RNA isolation.
RNA Isolation
Frozen tissues were pulverized and RNA was prepared with RNeasy Mini kits (Qiagen, Valencia, CA) following the manufacturer’s protocol (n = 16 mice per treatment group). The quality of the RNA was assessed by running the RNA on a 1% agarose gel and visualizing the 18S and 28S bands by ethidium bromide. RNA (5 μg) was then pooled from the 10 highest quality RNA samples in each treatment group and assayed again for quality with the Agilent 2100 Bioanalyzer. All RNA preparations were stored at −70°C until further use.
Microarray Analysis
Gene expression profiling was conducted with Agilent Mouse Oligo arrays with ~20 000 genes represented (Agilent Technologies, Palo Alto, CA). One microgram of total RNA per sample was amplified and labeled with the Agilent Low RNA Input Fluorescent Linear Amplification Kit, according to manufacturer’s protocol. For each two color comparison, 750 ng of each Cy3- and Cy5-labeled cRNA were mixed and fragmented with the Agilent In Situ Hybridization Kit (Palo Alto, CA) protocol. Hybridizations were performed for 17 h in a rotating hybridization oven according to the Agilent 60-mer oligo microarray processing protocol prior to washing and scanning with an Agilent Scanner (Agilent Technologies, Wilmington, DE). Each DES and control group was represented by a pool of 10 animals as described in “RNA isolation” and each DES dose was matched with its own control sample. Dye-flipped hybridization replicates were performed for each paired comparison.
Data were obtained with the Agilent Feature Extraction software (v7.5), with defaults for all parameters. The Feature Extraction Software performs error modeling before data are loaded into a database system. Images and GEML files, including error and P-values, were exported from the Agilent Feature Extraction software and deposited into Rosetta Resolver (version 5.0, build 5.0.0.2.48) (Rosetta Biosoftware, Kirkland, WA).
Data Analysis
Statistical significance of the microarrays utilized in this study was gained through the use of technology-specific error-modeling for estimating array variance. The Rosetta Resolver system combines data from replicate (dye flip) hybridizations using an error-weighted average that adjusts for additive and multiplicative noise. The resultant ratio profiles were combined into ratio experiments as described in Dai et al. [42] and Weng et al. [43]. A P-value is calculated and represents the probability that a gene is differentially expressed. The Resolver system allows users to set thresholds to identify differentially expressed genes. For the global analysis of differential gene expression at any dose, the thresholds were set to log (ratio) P-value <0.001 and an absolute fold change >1.5. For consistent differential gene expression changes, a log (ratio) P-value <0.01 at all three doses was the requirement.
Common biological themes in the DES treatment doses were identified with High-Throughput GOMiner [44]. First, genes with log (ratio) P-value <0.001 for each DES dose were selected as an input for gene ontology enrichment analysis. Any gene ontology category with an enrichment P < 0.01 (FDR P < 0.05) at any one dose was considered significant. The corresponding P-values for that category across all doses were examined by hierarchical clustering and visually used to identify common biological themes across at least two of the DES doses.
Microarray data from the current study at the DES-1000 dose were compared to a recent study of mice treated neonatally on days 1–5 with DES at a dose of 2 μg/pup/d, which is equivalent to DES-1000. The genes determined to be significant in the published manuscript were identified on the Agilent Mouse Oligo microarray by mapping Genbank accession numbers between the two data sets [38]. Genes with a log (ratio) P-value <0.01 in both studies were reported in common.
Microarray data from the current study with all three DES doses were also compared to mature ovariectomized female mice stimulated with estradiol for 24 h [39]. Genes with a log (ratio) P-value <0.001 in the 24-h estradiol exposure data and at least one of the DES doses were selected for subsequent analysis. Genes identified in common were analyzed for enrichment in any gene ontology category by EASE v2.0 (http://david.niaid.nih.gov/david/ease.htm [45]). Bootstrapping was utilized to correct for multiple comparisons and a P < 0.05 was used to define enriched gene categories.
Microarray data from the current mouse study with all three DES doses were compared to genes altered in human uterine adenocarcinomas [40]. Of the 191 genes determined to be significant in that study, there were 238 probes which were representative of these genes on the Agilent Mouse Oligo microarray. The genes with P < 0.01 in at least one of the DES treatments were selected for closer examination.
Verification of Microarray Results by Real-Time RT-PCR
RNA (1 μg) from individual mice used to generate the pooled sample for microarray was reverse transcribed with the Superscript II kit following the manufacturer’s instructions to assess Ltf transcript levels. Uteri from additional mice from each treatment group (a minimum of eight per treatment group) were also collected and RNA isolated as described for the microarray analysis to generate the real-time reverse transcription (RT)-polymerase chain reaction (PCR) data for transforming growth factor inducible (Tgfbi), cyclin D1 (Ccnd1), and secreted frizzled-related protein 4 (Sfrp4). Table 1 lists primer sets used for RT-PCR; Ltf and 18S primers were graciously provided by Vickie Walker, NIEHS and the other primers were purchased from Amersham (Piscataway, NJ). Control and DES-treated uterine cDNA (20 ng) were added to a 96-well plate in duplicate with SYBR green and primers described in Table 1. Amplification was carried out with 7900 HT Sequence Detection System (Applied Biosystems, Foster City, CA). Relative expression levels were determined with the mathematical model previously described [46]. Expression ratios were calculated by dividing the level of expression of the gene of interest by the 18S (housekeeping gene) expression level for each mouse. As a negative control, a sample containing RNA but no reverse transcriptase (minus RT) was also included.
Table 1.
Primers Used in Real-Time RT-PCR
| Gene name | Forward primer | Reverse primer |
|---|---|---|
| 18S | 5′-GAACTGCGAATGGCTCATTAA | 5′-GAATCACCACAGTTATCCAAGTAGGA |
| Lactotransferrin | 5′-CAGCAGGATGTGATAGCCACAA | 5′-CACTGATCACACTTGCGCTTCT |
| Tgfbi | 5′-TCCTTGCCTGCGGAAGTG | 5′-GTGGTAGCGGAGAGCATTGAG |
| Cyclin D1 | 5′-CCTTGACTGCCGAGAAGTTGT | 5′-TTGTTCACCAGAAGCAGTTCCA |
| Sfrp4 | 5′-TGAAAAGTGGAGAGATCAACTCAGTAG | 5′-TCTGCTTCTTGTCCTGAATTGTTC |
RESULTS
Global Gene Analysis
Gene expression profiles of mouse uteri were compared between each of the three DES dose treatments (1, 10, or 1000 μg/kg/d) and control mice. With the Rosetta Resolver error model, a P-value less than 0.001 was selected to define statistical significance for differentially expressed genes. A total of 232 genes out of >20 000 were defined as being differentially expressed with at least a 1.5-fold difference between DES exposed and control animals in any one dose. The complete data set can be found at http://www/ncbi.nlm.nih.gov/geo/info/linking.html under the GEO accession number GSE5825. Hierarchical clustering of the expression values for these transcripts revealed that the two lowest doses are most similar in their gene expression changes. The DES-1000 dose exhibited the most pronounced differences and clustered independently (Figure 1A). The dataare also shown ina Venndiagram (Figure 1B). There are 10 genes that are found to be differentially expressed in all three DES doses.
Figure 1.
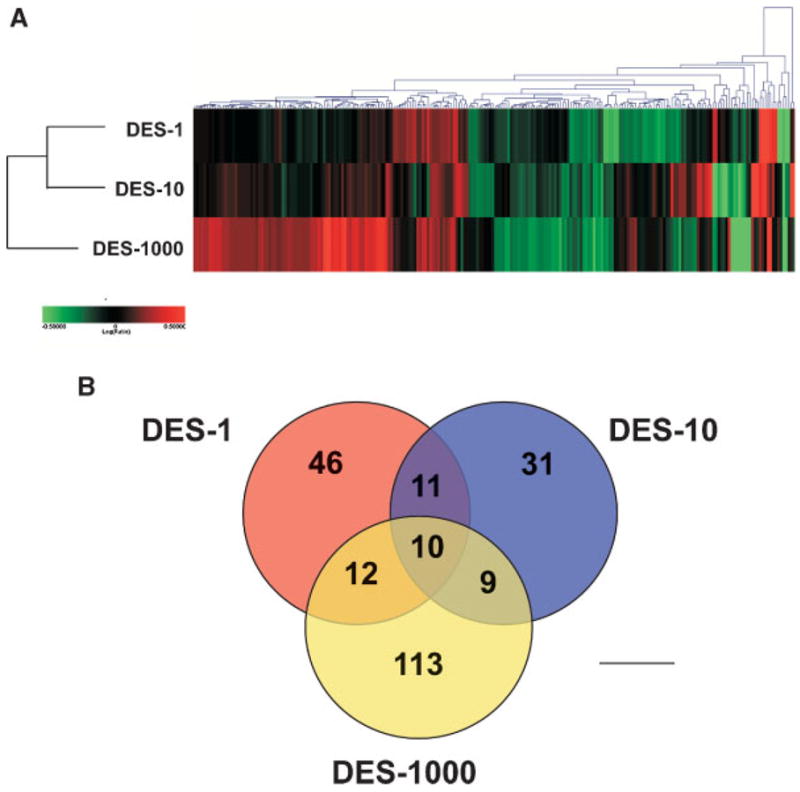
Global differential gene expression cluster analysis. Panel A: Hierarchical agglomerative clustering (cosine correlation similarity measure) was performed on genes exhibiting a log (ratio) P < 0.001 and fold change of 1.5 between DES-treated uteri and vehicle control at any DES dose. Two hundred thirty-two genes met this criteria and when clustered demonstrate a dose-related dependency on gene expression. The DES-1000 dose exhibits the strongest gene expression differences compared to control. Red indicates higher and green indicates lower transcript levels relative to control, log (ratio) = 0.5 (threefold) shows color saturation. Panel B: Data are plotted as a Venn diagram.
To identify genes demonstrating consistent differences resulting from DES exposure across all three doses (independent of dose), a slightly less restrictive P-value was employed (P < 0.01), identifying a total of 34 genes [Table 2 (14 genes were increased in DES exposed tissues) and Table 3 (20 genes were decreased in DES exposed tissues)]. Several genes involved in cell adhesion and Wnt signaling (indicated by *) were increased (Table 2) and several transcripts for cytoskeletal proteins were decreased (indicated by **, Table 3). Genes reported to be estrogen regulated are also indicated in both Tables 2 and 3 (indicated by ***).
Table 2.
Differentially Expressed Genes: Increased Independent of DES Dose
| Gene symbol | Description | DES-1 | DES-10 | DES-1000 |
|---|---|---|---|---|
| Clca3 | Chloride channel, Ca2+-activated 3 | 3.00 | 1.73 | 5.26 |
| Ltf*** | Lactotransferrin | 2.78 | 1.42 | 2.81 |
| Sfrp4* | Secreted frizzled-related sequence protein 4 | 1.27 | 1.21 | 2.45 |
| Cdh16* | Cadherin 16 | 1.30 | 1.26 | 2.22 |
| Mglap | Matrix γ-carboxyglutamate protein | 1.23 | 1.21 | 2.09 |
| Scx | Scleraxis | 2.04 | 1.64 | 2.04 |
| Cpm | RIKEN E030045M14 | 1.57 | 1.57 | 1.96 |
| Cxcl14 | Chemokine (C-X-C motif) ligand 14 | 1.73 | 1.27 | 1.65 |
| Six1 | Sine oculis-related homeobox 1 homolog | 1.54 | 1.58 | 1.68 |
| Tspan8*** | Tetraspanin 8 | 1.54 | 1.51 | 1.39 |
| Msx2* | Homeobox, msh-like 2 | 1.59 | 1.30 | 1.52 |
| H2-bf | Histocompatibility 2, complement component factor B | 1.58 | 1.51 | 1.39 |
| Hmga1 | High Mobility Group AT-hook 1 | 1.36 | 1.36 | 1.38 |
| Cst3 | Cystatin C | 1.22 | 1.19 | 1.31 |
P < 0.01 in all three doses and increased.
Indicates genes involved in cell adhesion and Wnt signaling.
Indicates genes that were shown to be estrogen regulated in previous studies 39.
Table 3.
Differentially Expressed Genes: Decreased Independent of DES Dose
| Gene symbol | Description | DES-1 | DES-10 | DES-1000 |
|---|---|---|---|---|
| Tnnt2** | Troponin T2, cardiac | −1.56 | −2.00 | −7.37 |
| Krt1-23** | Keratin complex 1, acidic, gene 23 | −2.48 | −2.80 | −3.74 |
| S100g | Calbindin-D9K | −2.92 | −1.78 | −3.17 |
| Vit** | Vitrin | −1.52 | −2.40 | −3.12 |
| Coch*** | Coagulation factor C homolog | −1.77 | −1.81 | −2.57 |
| Calb1*** | Calbindin-28K | −2.48 | −1.33 | −1.68 |
| Hdc*** | Histidine decarboxylase | −2.42 | −1.38 | −1.84 |
| Fxyd4*** | FXYD domain-containing ion transport regulator 4 | −2.27 | −1.41 | −1.52 |
| Acta1** | Actin, alpha 1, skeletal muscle | −1.32 | −1.65 | −2.05 |
| Bc023373 | Similar to angiopoietin-like factor | −1.64 | −1.56 | −2.00 |
| Atp1b1 | ATPase, Na+/K+ transporting, beta 1 | −1.20 | −1.46 | −1.91 |
| Emb** | Embigin | −1.86 | −1.52 | −1.71 |
| Wfdc1 | WAP four-disulfide core domain 1 | −1.26 | −1.35 | −1.80 |
| Gsto1 | Glutathione S-transferase omega 1 | −1.63 | −1.25 | −1.57 |
| Tgfbi*** | Transforming growth factor, beta induced | −1.59 | −1.26 | −1.22 |
| Erdr1*** | Erythroid differentiation regulator 1 | −1.26 | −1.26 | −1.57 |
| Aard | Alanine and arginine rich domain containing protein | −1.22 | −1.39 | −1.36 |
| Slc39a4 | Solute carrier family 39, zinc transporter, member 4 | −1.74 | −1.45 | −1.34 |
| Maob | Monoamine oxidase B | −1.37 | −1.20 | −1.37 |
| Tcfcp2l1*** | Tcfcp2-related transcriptional repressor 1 | −1.33 | −1.26 | −1.28 |
P < 0.01 in all three doses and decreased.
Indicates cytoskeletal genes.
Indicates genes that were shown to be estrogen regulated in previous studies 39.
Alterations in Gene Ontological Categories
Common gene ontology themes across the doses were determined with clustering of GOMiner results. Significant changes in genes associated with cell adhesion (GO:0007155), growth and development (GO:0007275, GO:0001558), and cell differentiation (GO:0030154) were observed. These data are presented in Figure 2. Cell adhesion genes that were differentially expressed following exposure to DES are shown in Figure 2A. Some of the altered genes include collagen-encoding transcripts as well as integrins. Genes involved in regulation of developmental processes are shown in Figure 2B. These include homeobox genes (Hoxd4, Hoxb6, Hoxd8, and Msx2), Wnt genes (Wnt9a) and other transcription factors. Genes involved in cellular differentiation such as Sfrp1, Sfrp2, and Sfrp4 are shown in Figure 2C with the highest dose showing the largest effect.
Figure 2.
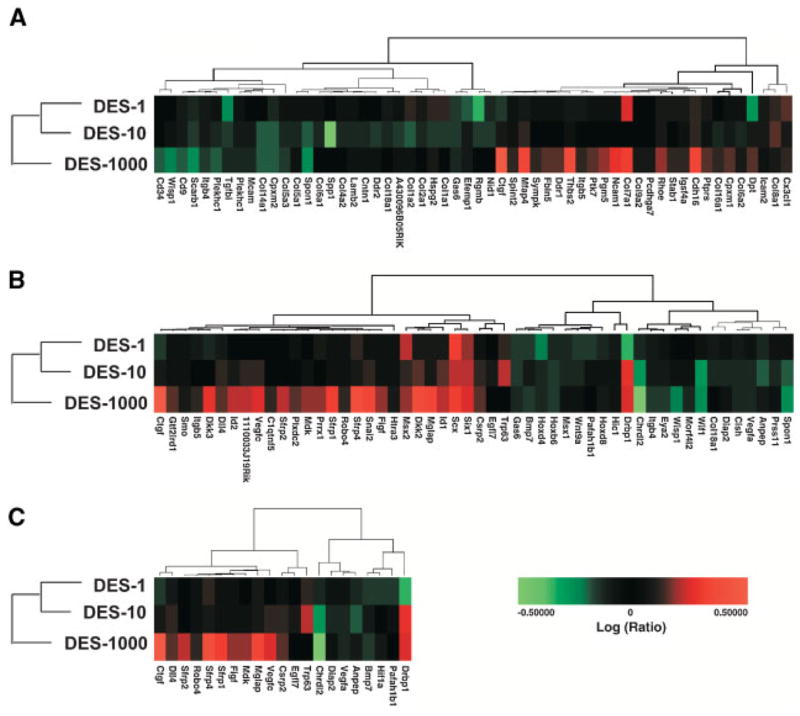
Enrichment for genes involved in cell adhesion, development and cell differentiation. High throughput GOMiner was used to determine common biological themes across at least two of the three DES doses. Significant changes were seen in genes involved in cell adhesion (Panel A); genes involved in growth and development (Panel B); and genes involved in cell differentiation (Panel C).
Comparison With Gene Expression in 5-D-Old DES-Treated Uteri
Previous work from Huang et al. [38] observed 183 decreased and 244 increased genes in the uterus at 5 d of age directly following neonatal exposure to DES-1000. These genes were compared in our corresponding dose group (DES-1000 = 2 μg/pup/d) and 36 were identified in common (Table 4); 15 genes were increased in both studies; 10 were decreased in both studies and 11 were increased in one study but decreased in the other. These genes included Ltf, complement C3 (C3) and Sprr2f which are increased in both studies and Tgfbi and Ccnd1 which were decreased in both studies. Although the fold change varied between the two studies (Table 4) because of differences in platforms etc., the trend of change was similar.
Table 4.
Comparison with Day 5 Neonatal DES-Treated Mice Uteri
| Gene symbol | Gene description | DES vs. controla | DES vs. controlb |
|---|---|---|---|
| Increased in both studies | |||
| Phactr1 | Phosphatase and actin regulator 1 | 1.47792 | 1.93 |
| Sprr2f | Small proline-rich protein 2F | 1.49124 | 25.04672 |
| Prap1 | Uterine-specific proline-rich acidic protein | 1.94399 | 54.35551 |
| Lox | Lysyl oxidase | 2.24916 | 2.34985 |
| 1600029D21Rik | RIKEN cDNA 1600029D21 gene | 2.59831 | 3.16 |
| Ggtla1 | Gamma-glutamyltransferase-like activity 1 | 2.12011 | 2.10 |
| H2-bf | Histocompatibility 2, complement component factor B (H2-Bf) | 1.39295 | 13.59 |
| Sftpd | Surfactant associated protein D | 2.48405 | 47.88565 |
| C3 | Complement component 3 (C3) | 1.44457 | 17.56 |
| Slc40a1 | Solute carrier family 40 (iron-regulated transporter), member 1 | 1.96846 | 4.83 |
| Ltf | Lactotransferrin | 2.81429 | 51.40792 |
| Clca3 | Chloride channel calcium activated 3 | 5.25591 | 5.41375 |
| Mafb | V-maf musculoaponeurotic fibrosarcoma oncogene family, protein B (avian) | 1.9308 | 3.93444 |
| C1qa | Complement component 1, q subcomponent, alpha polypeptide | 1.47699 | 2.17873 |
| Car2 | Carbonic anhydrase 2 | 1.7509 | 7.31 |
| Decreased in both studies | |||
| Aard | Alanine and arginine rich domain containing protein | −1.35682 | 0.42 |
| Bex4 | brain expressed, X-linked 4 | −1.34846 | 0.31272 |
| Eppb9 | Endothelial precursor protein B9 | −1.27199 | 0.49982 |
| C330017I15Rik | RIKEN cDNA C330017I15 gene | −1.20045 | 0.42440 |
| Ccnd1 | Cyclin D1 | −1.77797 | 0.36667 |
| Adamts8 | A disintegrin-like and metalloprotease (reprolysin type) with thrombospondin type 1 motif, 8 | −1.7731 | 0.39 |
| Tgfbi | Transforming growth factor, beta induced | −1.22347 | 0.07 |
| Trpc3 | Transient receptor potential cation channel, subfamily C, member 3 | −1.92774 | 0.07 |
| Slc22a3 | Solute carrier family 22 (organic cation transporter), member 3 | −1.32147 | 0.04 |
| Car3 | Carbonic anhydrase 3 | −1.81675 | 0.10 |
| Increased in one study but decreased in the other | |||
| S100g | Calbindin-D9K | −3.16655 | 8.52 |
| Emb | Embigin | −1.70963 | 2.70968 |
| Gsto1 | Glutathione S-transferase omega 1 | −1.57445 | 4.98 |
| Pcp4l1 | Purkinje cell protein 4-like 1 | −1.39547 | 2.88 |
| Fxyd4 | FXYD domain-containing ion transport regulator 4 | −1.52039 | 6.64 |
| Cited4 | Cbp/p300-interacting transactivator, with Glu/Asp-rich carboxy-terminal domain, 4 | −1.79137 | 9.09 |
| Tcfcp2l1 | Tcfcp2-related transcriptional repressor 1 | −1.27906 | 4.77641 |
| Klf4 | Kruppel-like factor 4 (gut) (Klf4) | −1.17433 | 8.87 |
| Gpx3 | Glutathione peroxidase 3 | −1.53402 | 4.00 |
| Igsf4a | Immunoglobulin superfamily, member 4A (Igsf4a), transcript variant 2 | 1.32691 | 0.46005 |
| Cdh16 | Cadherin 16 | 2.22285 | 0.02 |
Data presented as fold change from 19-d-mouse uteri treated neonatally with DES-1000 compared to controls.
Data are taken from Huang et al. 38 from 5-d-mouse uteri treated neonatally with DES-1000 compared to controls.
Comparison With Gene Expression in Mature 17β-Estradiol Uteri
Previous work performed in collaboration with the NIEHS Microarray Group assessed gene expression changes in adult C57 Bl/6 mouse uteri after acute exposure to a single injection of 17β-estradiol [39]. Subsequently, these experiments were repeated with the Agilent Mouse Oligo arrays as described in the Materials and Methods. Genes with P < 0.001 were selected from the 24-h estradiol treatment and compared to all three DES doses; 173 genes show common directionality in regulated expression when comparing the estradiol response and at least one of the DES doses. Figure 3A shows these genes in a hierarchical cluster and includes Sprr2f, Ltf, Msx1, Hoxd4, and Tgfbi; Figure 3B shows the data in a Venn diagram. The cluster also depicts a high correlation between the 24-h estradiol treatment and the DES-1 dose. Of the 173 genes showing a common direction in differential gene expression, over 50% of them were exclusively in common between the 24-h estradiol treatment and the DES-1 dose. Gene ontology analysis of these genes revealed significantly increased enrichment of biological processes associated with cell cycle, specifically M phase and mitotic cell-cycle associations (P < 0.01, found within the yellow box in Figure 3A) such as Ccnb2, Cdc20, Cenpf, Chaf1b, Plk1, Pole, and Prc1.
Figure 3.
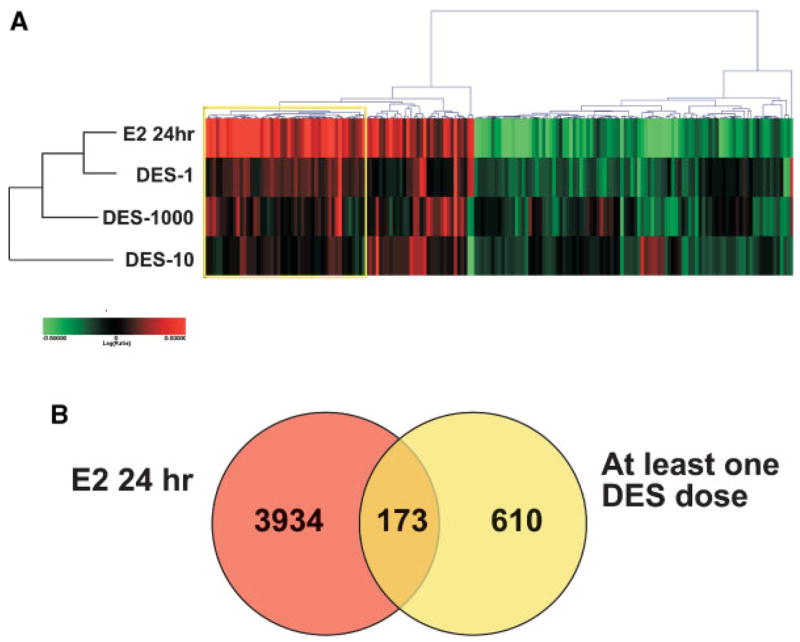
Comparison of permanently altered DES genes with estrogen regulated genes. Panel A: Genes in common between 24-h estradiol treatment (E, 24 h) and any one dose of DES (P < 0.001) were selected and hierarchical agglomerative cluster (cosine correlation similarity measure) was performed. Red indicates increased and green indicates decreased expression levels relative to control, log (ratio) = 0.5 (threefold) shows color saturation. With gene ontology analysis, the yellow box includes genes involved in biological processes associated with cell cycle, specifically M phase and mitotic spindle formation associations. Panel B: Data are plotted as a Venn diagram.
Comparison With Gene Expression in Human Uterine Adenocarcinomas
Previous work from Risinger et al. [40] observed approximately 191 genes which could be used to categorize human uterine adenocarcinomas into different histological groups. These genes were examined across all three DES doses; 26 genes also demonstrated differential expression of transcripts in at least one dose of DES at a log (ratio) P < 0.01 (Figure 4). These include Sfrp1, Sfrp4, Igf1, and Txnip.
Figure 4.
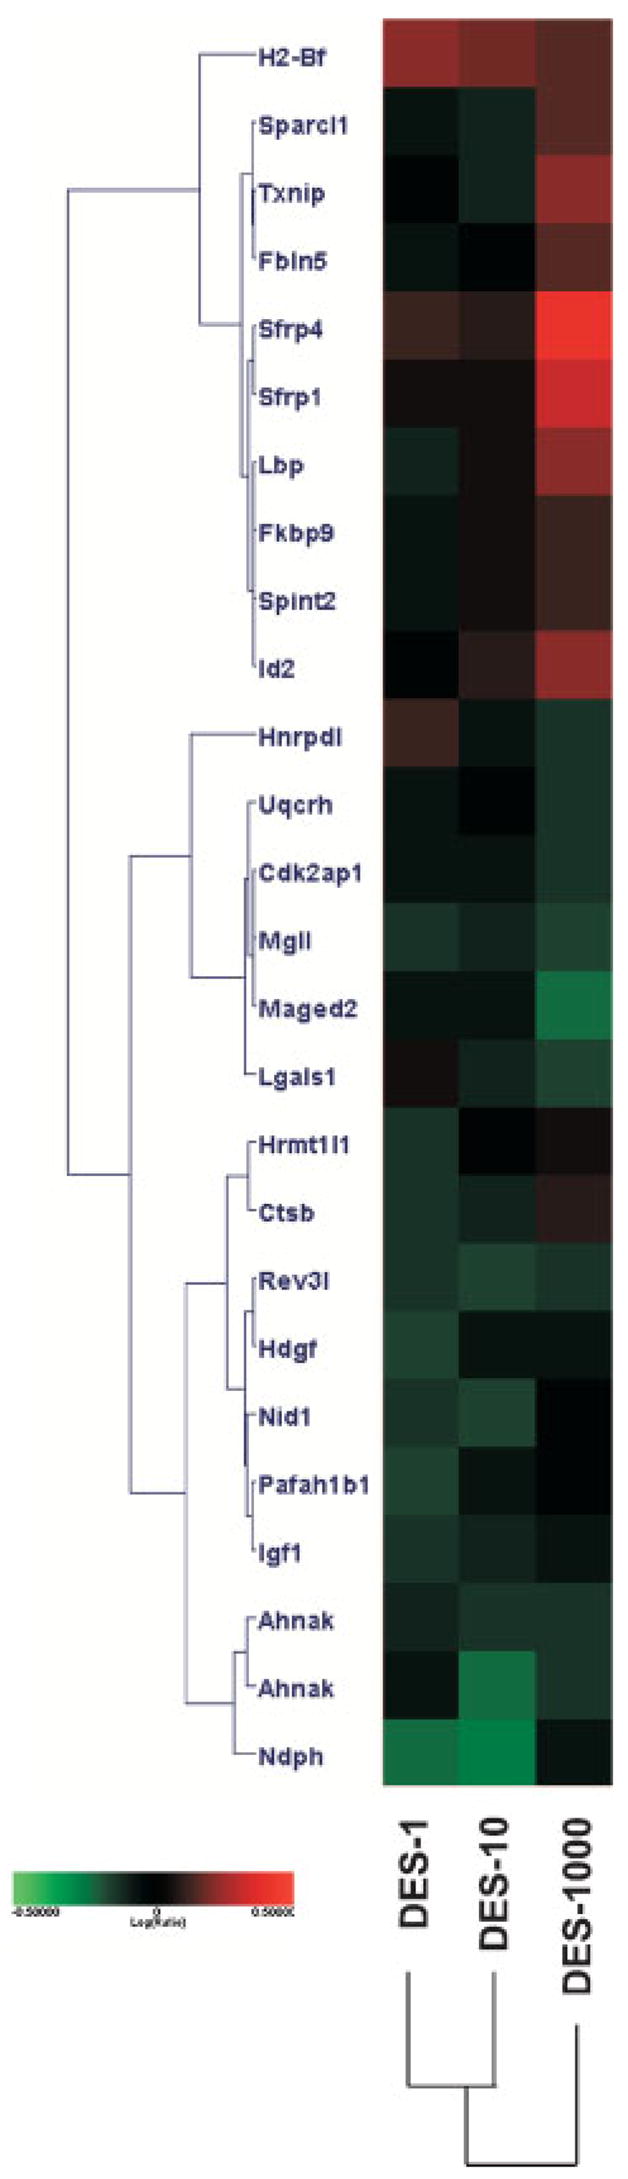
Comparison of permanently altered DES genes with genes expressed in human uterine adenocarcinoma. Genes found significant in human uterine adenocarcinoma were compared to the three DES doses. Twenty-six genes were found in common. Red indicates increased and green indicates decreased expression levels relative to control, log (ratio) = 0.5 (threefold) shows color saturation.
Verification of Microarray Analysis With Real-Time RT-PCR
Four genes that appeared in multiple comparisons (Ltf, Tgfbi, Ccnd1, and Sfrp4) were selected for further analysis. Real-time RT-PCR expression levels of the four genes in individual control and DES-treated uteri are shown in Figure 5A–D. The average expression levels are shown in Table 5. Overall, the real-time RT-PCR results demonstrated good correlation with the directionality of the microarray data, though some compression of fold change values is observed with the microarray data (Table 6). Ltf and Sfrp4 are increased while Ccnd1 and Tgfbi are decreased with both techniques. The relative transcript levels within a given dose group were more variable when individuals were assayed as opposed to pools of individual mice, as was used to generate the microarray data. In some instances (Ltf and Sfrp4), exposure to DES resulted in increasing variability in transcript levels within individuals of a given dose group, but the reverse was also observed with Tgfbi and Ccnd1.
Figure 5.
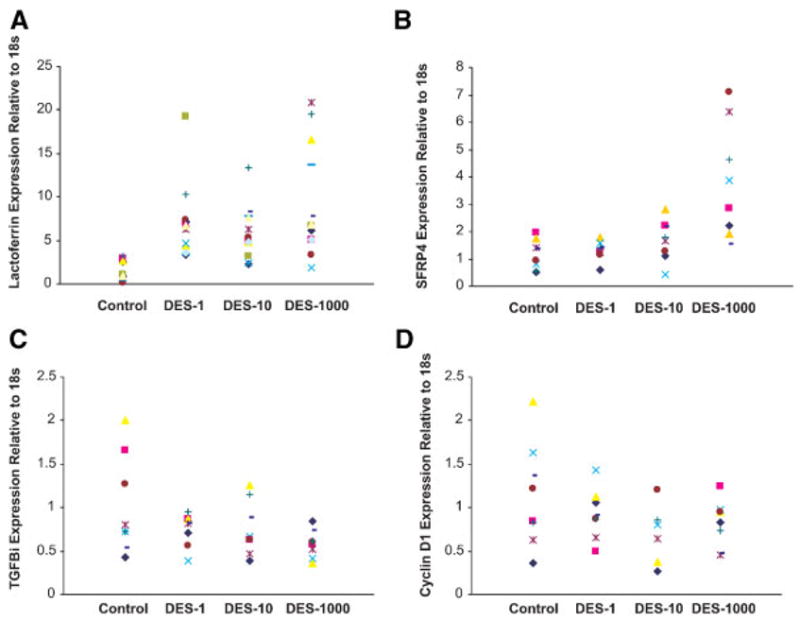
Verification of microarray analysis with real-time RT-PCR. Scatter plots of Ltf (Panel A), Sfrp4 (Panel B), Tgfb1 (Panel C), and Ccnd1 (Panel D) expression relative to the housekeeping gene18S as determined by RT-PCR. From the left, the doses were control, DES-1, DES-10, and DES-1000 μg/kg/d. Each point represents an individual mouse.
Table 5.
Real-Time RT-PCR Expression Following Neonatal DES Exposure
| Control | DES-1 | DES-10 | DES-1000 | |
|---|---|---|---|---|
| Ltf | 1.44 ± 0.29 | 6.94 ± 1.17* | 5.90 ± 0.82* | 9.43 ± 1.72* |
| Sfrp4 | 1.16 ± 0.19 | 1.31 ± 0.12 | 1.67 ± 0.26 | 3.82 ± 0.73* |
| Tgfbi | 1.02 ± 0.20 | 0.75 ± 0.66 | 0.76 ± 0.11 | 0.58 ± 0.06* |
| Ccnd1 | 1.14 ± 0.21 | 0.93 ± 0.10 | 0.69 ± 0.14 | 0.83 ± 0.09 |
Numbers represent the average expression levels ± SEM. Individual values are plotted in Figure 4.
Denotes statistical significance as determined by Dunnett’s test (P < 0.05).
Table 6.
Comparison of Microarray Analysis and Real-Time RT-PCR
| DES-1 vs. control
|
DES-10 vs. control
|
DES-1000 vs. control
|
||||
|---|---|---|---|---|---|---|
| Microarray | RT-PCR | Microarray | RT-PCR | Microarray | RT-PCR | |
| Ltf | 2.8a | 4.8 | 1.4 | 4.1 | 2.8 | 6.5 |
| Sfrp4 | 1.3 | 1.1 | 1.2 | 1.4 | 2.5 | 3.3 |
| Tgfb1 | −1.6 | −1.4 | −1.3 | −1.3 | −1.2 | −1.7 |
| Ccnd1 | 1.0 | −1.2 | −1.2 | −1.6 | −1.8 | −1.4 |
Numbers represent the average expression level of DES-treated mice divided by the average expression level of controls.
DISCUSSION
The results presented in this study showed significant alterations in uterine gene expression following neonatal DES treatment at 1, 10, and 1000 μg/kg/d that occur at least 2 wk after treatment ceased. We have previously reported that neonatal DES exposure at these same doses caused uterine adenocarcinoma at 12 mo of age in 19%, 29%, and 63% of the mice treated with the respective doses [18]; the tumor incidence reached >90 % at 18 mo at the highest DES dose [10]. These tumors were dependent on ovarian hormones at puberty because mice ovariectomized before puberty did not develop uterine tumors [10]. Our current data support the idea that early exposure to DES changes the transcriptional profile of the uterus so that it responds abnormally to ovarian hormones at puberty which may then lead to the development of uterine cancer later in life. The changes in gene expression that we identified in the uterus were consistent with developmental DES exposure being an initiating event in an initiation/promotion model of hormonal carcinogenesis because the alterations were detected before puberty. Gene categories which showed significantly enriched differential expression in ontological biological processes include cell cycle, adhesion, growth and development, as well as cell differentiation. Because multiple gene categories are represented, this suggests complex mechanisms are involved in uterine hormonal carcinogenesis.
We compared our data from 19-d-old prepubertal mice exposed neonatally to DES to previously published data obtained from 5-d-old DES-treated mice [38]. Although we examined changes that occurred in response to three increasing doses of DES, we only compared data from our dose of DES-1000 (2 μg/kg/d) which was the same as that published by Huang et al. [38]. There were numerous changes in common between the two studies with 15 genes showing increased expression and 10 genes showing decreased expression. Our findings suggest that these genes may be particularly important because they represent a subset of genes that are permanently altered, not just transiently altered in response to DES immediately following DES treatment. Some of these genes include estrogen-regulated proteins such as Ltf, C3, and Ccnd1 as well as Sprr2f which have been shown to be involved in epithelial cell differentiation. Further, we identified 11 genes that were increased in one study but decreased in the other. These genes probably represent genes that are transiently altered by DES treatment or are differentially regulated by other factors active in uterine differentiation processes. In addition to these genes, Huang et al. [38] described decreased expression of Msx-2, a homoeodomain transcription factor and a member of the Wnt signaling pathway although it was not consistently decreased across all of their samples. In a more recent study, they also reported repression of Msx-2 by DES and a role for the gene in female reproductive tract differentiation [47]. In our study, the expression of the Msx-2 gene was increased in all three DES dose groups. This difference between studies can probably be explained by the time after DES treatment. While it has been shown that Msx-2 is involved in uterine differentiation, the contribution to the etiology of uterine cancer remains to be determined. Previously, we have also shown that other genes and their proteins such as c-fos and p21 [48] were increased during the time of DES treatment but then returned to control levels by puberty supporting the idea that some genes like Ltf, C3, Ccnd1, and Sprr2f are permanently imprinted, but others like Msx-2 are not. This points out that the timing of gene expression is very important and can be altered by exposure to DES resulting in abnormal uterine differentiation whether genes are permanently imprinted or not.
We further compared our data from CD-1 mice to a previous report with C57 Bl/6 mice that examined the direct response of the mature uterus to an estrogenic stimulus [39]. A remarkable similarity was found between the 24-h estradiol treatment and our DES-1 treatment group which was collected 2 wk after neonatal treatment at 19 d of age. Of all the genes that were considered statistically significant, over half were commonly increased or decreased in our lowest DES-treated group (DES-1) and the adult estradiol group. These two groups are probably the most similar because estrogen responsiveness of the uterus can be demonstrated in the DES-1 treatment group whereas, the DES-10 and DES-1000 treated mice often exhibit limited ability to respond to estrogen, as well as, exhibit altered uterine cellular differentiation [20,49]. The overall similarities between the two studies suggest that a substantial estrogenic component remains present long after the last DES treatment on day 5. From the gene ontology analysis, many of these genes were involved in cell-cycle regulation.
For example, expression of Ccnd1, a cell-cycle regulatory gene important in the G1/S phase of the cell cycle, was decreased in the neonatally DES-treated uterus at 19 d as well as at 5 d directly following treatment [38] and in the mature uterus 4 h following estrogen treatment [39]. Further analysis of Ccnd1 expression with real-time RT-PCR showed the decreased expression of this gene in individual DES-treated animals. The alteration of cell-cycle genes, like Ccnd1, may contribute to abnormal cell division and hormone responses at puberty thus resulting in neoplasia later in life.
Expression of Ltf, an estrogen regulated gene, was increased as expected in the mature estradiol stimulated uterus and the 5-d-old DES-treated uterus as determined by microarray analysis; it was also increased in all three of our DES dose groups. Real-time RT-PCR supported these findings although there were variable responses in individual mice. Several studies have shown that the mRNA for this gene, as well as, the protein were over-expressed during the time of neonatal DES treatment [38,50]. Further, mice treated developmentally with DES showed high levels of lactotransferrin (also referred to as lactoferrin) protein later in life even in the absence of estrogen stimulation [25]. Our current study is consistent with these findings. In addition, we have previously shown that the promoter region of the Ltf gene has an altered methylation pattern following DES exposure suggesting that DES permanently imprints this gene [51]. Interestingly, our current data show a dose responsive increase in Ltf expression which correlates with a dose responsive increase in uterine cancers seen later in life [18]. Whether lactoferrin plays a direct role in the initiation and/or promotion of uterine cancer is an ongoing investigation but it is interesting that it has been reported to have growth promoter effects in uterine cells [52].
In addition to Ltf, the expression of another estrogen regulated gene, C3 [53] was increased 1.5-fold in the DES-1000 group. While, our analysis did not identify all estrogen-responsive genes as reported in the mature uterus [39], this may be due to the age of the tissues, differences in mouse strains, time differential of 2 wk following DES treatment, or the differences in the threshold of our analysis. Estrogen-regulated genes that did not show a significant difference in our study but were reported to be responsive by others include epidermal growth factor (Egf) [54], EGF receptors (Egfr) [55], progester-one receptor (Pr) [56], and heat shock protein 27 (Hsp27) [57]. Further, another group of estrogen-regulated genes not found to be significantly changed in our study include c-fos, c-jun, and c-myc but this is most probably because of the transient expression of these genes because they are expressed minutes to hours after estrogen exposure [58,59] and not likely to be present 2 wk after treatment. Our findings do not lessen the role of these genes in the development of neoplasia but it does suggest that the expression of these genes is not permanently altered in the initiation phase of uterine hormonal carcino-genesis, although the response to hormone stimulation later in life may be altered.
A large category of differentially expressed genes following neonatal DES treatment included genes involved in cell adhesion. Many of the genes and gene products in this category are involved in cell–cell communication which can be disrupted in the progression to cancer. We identified several collagens and integrins found in this category. These genes showed the highest expression level in the highest dose of DES treatment supporting disruption of tissue architecture, which we have previously described [10]. For example, we have previously shown that high doses of DES exhibit alterations in uterine morphology such as squamous metaplasia which indicates abnormal cellular differentiation [20]. Another gene involved in cell adhesion Tgfbi is decreased at the highest dose of DES. Further study of this gene with real-time RT-PCR confirmed the microarray data suggesting that this gene may play an important role in the initiation event.
Cell growth and development as well as cellular differentiation pathways were also altered following neonatal DES treatment. Genes in these categories include those involved in Wnt signaling and Homeo-box (Hox) genes. These have been previously reported to be altered following developmental exposure to DES [28,29]. These genes are involved in reproductive tract tissue patterning and cellular differentiation. Alterations in Hox gene expression are molecular mechanisms by which DES can affect reproductive tract differentiation [27]. Another interesting gene is Sfrp4 which has been shown to function as a modulator of Wnt signaling through direct interaction with Wnt genes [60]; Sfrp4 is also increased following estrogen treatment [60]. Our data with real-time RT-PCR analysis clearly demonstrates the increased expression of this gene, especially following the highest dose of DES. Alterations in the expression of this gene in the uterus may lead to disruption of the Wnt signaling pathways resulting in tissue dysmorphogenesis such as malformation early in life [29] and/or uterine neoplasia later in life.
A striking overlap in differentially expressed genes was revealed when comparing the murine neonatal DES response with altered genes found in human uterine endometrial cancer [40]. Of the genes found in common, Sfrp4 and Igf-1 were particularly interesting because they were also identified in the estrogen-regulated set of genes. The altered expression of these genes in the prepubertal mouse prior to uterine cancer formation and in human uterine cancer implicates their role in hormonal carcinogenesis.
Another interesting observation was the variability in gene expression of individual mice following neonatal DES exposure as seen in the real-time RT-PCR data. As we have previously reported, lactoferrin expression in the uterus of control 19-d-old mice was low and did not vary among animals [50]. However, in this study, the expression of several genes including lactoferrin was quite variable at 19 d of age following neonatal exposure to DES. This was not probably caused by endogenous ovarian hormones of puberty because the controls had very low levels of lactoferrin at this age and none of the mice showed morphological signs of puberty. The varying levels of lactoferrin observed following neonatal DES treatment were probably because of early altered imprinting, therefore some animals would be expected to be more affected than others.
In summary, developmental exposure to DES resulted in altered gene expression pathways which included an estrogen-regulated component. Because uterine tumors do not occur in animals that are ovariectomized before puberty, this implies that the induction of tumors arises from the combination of neonatal exposure to DES and subsequent pubertal exposure to endogenous estrogens [10]. The current data suggest that DES acts during development by altering estrogen-regulated pathways and subsequent tissue response to estrogen signaling later in life, possibly resulting in cancer. It appears that neonatal DES treatment alters uterine cell proliferation and differentiation by controlling genes normally regulated by estrogen. Although the majority of the morphological and pathological effects of DES in the uterus have been shown to be mediated through estrogen receptor (ER)α (Esr1) mechanisms [61], little is known about the downstream targets of ERα in this process especially those involved in the development of uterine adenocarcinoma. This study identifies some early molecular events that DES alters which may be associated with an abnormal hormonal response resulting in neoplasia later in life.
The mechanisms involved in abnormal cellular responses of the uterus following neonatal DES treatment are not well understood but the information from the current study may prove useful in elucidating the pathways involved in the initiation events of uterine hormonal carcinogenesis. Further, data from this study will help develop a molecular fingerprint that can be used to predict the long-term effects of DES exposure including neoplasia which is transmitted to subsequent generations [18].
Acknowledgments
We thank Sylvia Hewitt for generously providing access to data from samples previously reported which were re-assayed with Agilent arrays. We would also like to thank her and Astrid Haugen for critical review of this manuscript. This research was supported by the Intramural Research Program of the NIH, National Institute of Environmental Health Sciences.
Abbreviations
- DES
diethylstilbestrol
- Ltf
lactotransferrin
- C3
complement C3
- Sfrp4
secreted frizzled-related protein 4
- Tgfbi
transforming growth factor inducible
- Ccnd1
cyclin D1
- NIEHS
National Institute of Environmental Health Sciences
- RT
reverse transcription
- PCR
polymerase chain reaction
References
- 1.Herbst AL, Ulfelder H, Poskanzer DC. Adenocarcinoma of the vagina. Association of maternal stilbestrol therapy with tumor appearance in young women. N Engl J Med. 1971;284:878–881. doi: 10.1056/NEJM197104222841604. [DOI] [PubMed] [Google Scholar]
- 2.Hammes B, Laitman CJ. Diethylstilbestrol (DES) update: Recommendations for the identification and management of DES-exposed individuals. J Midwifery Womens Health. 2003;48:19–29. doi: 10.1016/s1526-9523(02)00370-7. [DOI] [PubMed] [Google Scholar]
- 3.NIHDES Research Update. NIH Publication No. 00-4722. Bethesda, MD: NIH; 1999. Report nr NIH Publication No.00-4722. [Google Scholar]
- 4.Herbst AL, Bern HA. Developmental effects of diethylstilbes-trol (DES) in pregnancy. New York: Thieme-Stratton; 1981. [Google Scholar]
- 5.Giusti RM, Iwamoto K, Hatch EE. Diethylstilbestrol revisited: A review of the long-term health effects. Ann Intern Med. 1995;122:778–788. doi: 10.7326/0003-4819-122-10-199505150-00008. [DOI] [PubMed] [Google Scholar]
- 6.Palmer JR, Hatch EE, Rosenberg CL, et al. Risk of breast cancer in women exposed to diethylstilbestrol in utero: Prelimiinary results (United States) Cancer Causes Control. 2002;13:753–758. doi: 10.1023/a:1020254711222. [DOI] [PubMed] [Google Scholar]
- 7.Blatt J, Van Le L, Weiner T, Sailer S. Ovarian carcinoma in an adolescent with transgenerational exposure to diethylstil-bestrol. J Pediatr Hematol Oncol. 2003;25:635–636. doi: 10.1097/00043426-200308000-00009. [DOI] [PubMed] [Google Scholar]
- 8.Plapinger L, Bern HA. Adenosis-like lesions and other cervicovaginal abnormalities in mice treated perinatally with estrogen. J Natl Cancer Inst. 1979;63:507–518. [PubMed] [Google Scholar]
- 9.McLachlan JA, Newbold RR, Bullock BC. Long-term effects on the female mouse genital tract associated with prenatal exposure to diethylstilbestrol. Cancer Res. 1980;40:3988–3999. [PubMed] [Google Scholar]
- 10.Newbold RR, Bullock BC, McLachlan JA. Uterine adenocarcinoma in mice following developmental treatment with estrogens: A model for hormonal carcinogenesis. Cancer Res. 1990;50:7677–7681. [PubMed] [Google Scholar]
- 11.Iguchi T, Takase M, Takasugi N. Development of vaginal adenosis-like lesions and uterine epithelial stratification in mice exposed perinatally to diethylstilbestrol. Proc Soc Exp Biol Med. 1986;181:59–65. doi: 10.3181/00379727-181-42224. [DOI] [PubMed] [Google Scholar]
- 12.Forsberg JG, Kalland T. Neonatal estrogen treatment and epithelial abnormalities in the cervicovaginal epithelium of adult mice. Cancer Res. 1981;41:721–734. [PubMed] [Google Scholar]
- 13.Rothschild TC, Calhoon RE, Boylan ES. Effects of diethyl-stilbestrol exposure in utero on the genital tracts of female ACI rats. Exp Mol Pathol. 1988;48:59–76. doi: 10.1016/0014-4800(88)90046-9. [DOI] [PubMed] [Google Scholar]
- 14.Branham WS, Zehr DR, Chen JJ, Sheehan DM. Uterine abnormalities in rats exposed neonatally to diethylstilbestrol, ethynylestradiol, or clomiphene citrate. Toxicology. 1988;51:201–212. doi: 10.1016/0300-483x(88)90150-3. [DOI] [PubMed] [Google Scholar]
- 15.Hendry WJ, III, Sheehan DM, Khan SA, May JV. Developing a laboratory animal model for perinatal endocrine disruption: The hamster chronicles. Exp Biol Med (Maywood) 2002;227:709–723. doi: 10.1177/153537020222700904. [DOI] [PubMed] [Google Scholar]
- 16.Davies J, Lefkowitz J. Delayed effects of prenatal or postnatal exposure to diethylstilbestrol in the adult female guinea pig. Acta Anat (Basel) 1987;130:351–358. doi: 10.1159/000146470. [DOI] [PubMed] [Google Scholar]
- 17.Newbold RR. Lessons learned from perinatal exposure to diethylstilbestrol. Toxicol Appl Pharmacol. 2004;199:142–150. doi: 10.1016/j.taap.2003.11.033. [DOI] [PubMed] [Google Scholar]
- 18.Newbold RR, Padilla-Banks E, Jefferson WN. Adverse effects of the model environmental estrogen diethylstilbestrol are transmitted to subsequent generations. Endocrinology. 2006;147:S11–S17. doi: 10.1210/en.2005-1164. [DOI] [PubMed] [Google Scholar]
- 19.Ruden DM, Xiao L, Garfinkel MD, Lu X. Hsp90 and environmental impacts on epigenetic states: A model for the trans-generational effects of diethylstibesterol on uterine development and cancer. Hum Mol Genet. 2005;14:R149–155. doi: 10.1093/hmg/ddi103. Spec No 1. [DOI] [PubMed] [Google Scholar]
- 20.Newbold RR, Jefferson WN, Padilla-Banks E, Haseman J. Developmental exposure to diethylstilbestrol (DES) alters uterine response to estrogens in prepubescent mice: Low versus high dose effects. Reprod Toxicol. 2004;18:399–406. doi: 10.1016/j.reprotox.2004.01.007. [DOI] [PubMed] [Google Scholar]
- 21.Li S, Hursting SD, Davis BJ, McLachlan J, Barrett JC. Environmental exposure, DNA methylation, and gene regulation. Ann NY Acad Sci. 2003;983:161–169. doi: 10.1111/j.1749-6632.2003.tb05971.x. [DOI] [PubMed] [Google Scholar]
- 22.Falck L, Forsberg JG. Immunohistochemical studies on the expression and estrogen dependency of EGF and its receptor and C-fos proto-oncogene in the uterus and vagina of normal and neonatally estrogen-treated mice. Anat Rec. 1996;245:459–471. doi: 10.1002/(SICI)1097-0185(199607)245:3<459::AID-AR2>3.0.CO;2-N. [DOI] [PubMed] [Google Scholar]
- 23.Hebert CD, Endo S, Korach KS, et al. Characterization of murine cell lines from diethylstilbestrol-induced uterine endometrial adenocarcinomas. In Vitro Cell Dev Biol. 1992;28A:327–336. doi: 10.1007/BF02877056. [DOI] [PubMed] [Google Scholar]
- 24.Kamiya K, Sato T, Nishimura N, Goto Y, Kano K, Iguchi T. Expression of estrogen receptor and proto-oncogene messenger ribonucleic acids in reproductive tracts of neonatally diethylstilbestrol-exposed female mice with or without post-puberal estrogen administration. Exp Clin Endocrinol Diabetes. 1996;104:111–122. doi: 10.1055/s-0029-1211432. [DOI] [PubMed] [Google Scholar]
- 25.Nelson KG, Sakai Y, Eitzman B, Steed T, McLachlan J. Exposure to diethylstilbestrol during a critical developmental period of the mouse reproductive tract leads to persistent induction of two estrogen-regulated genes. Cell Growth Differ. 1994;5:595–606. [PubMed] [Google Scholar]
- 26.Yamashita S, Takayanagi A, Shimizu N. Effects of neonatal diethylstilbestrol exposure on c-fos and c-jun protooncogene expression in the mouse uterus. Histol Histopathol. 2001;16:131–140. doi: 10.14670/HH-16.131. [DOI] [PubMed] [Google Scholar]
- 27.Block K, Kardana A, Igarashi P, Taylor HS. In utero diethylstilbestrol (DES) exposure alters Hox gene expression in the developing mullerian system. FASEB J. 2000;14:1101–1108. doi: 10.1096/fasebj.14.9.1101. [DOI] [PubMed] [Google Scholar]
- 28.Ma L, Benson GV, Lim H, Dey SK, Maas RL. Abdominal B (AbdB) Hoxa genes: Regulation in adult uterus by estrogen and progesterone and repression in mullerian duct by the synthetic estrogen diethylstilbestrol (DES) Dev Biol. 1998;197:141–154. doi: 10.1006/dbio.1998.8907. [DOI] [PubMed] [Google Scholar]
- 29.Sassoon D. Wnt genes and endocrine disruption of the female reproductive tract: A genetic approach. Mol Cell Endocrinol. 1999;158:1–5. doi: 10.1016/s0303-7207(99)00170-7. [DOI] [PubMed] [Google Scholar]
- 30.Boyd J, Takahashi H, Waggoner SE, et al. Molecular genetic analysis of clear cell adenocarcinomas of the vagina and cervix associated and unassociated with diethylstilbestrol exposure in utero. Cancer. 1996;77:507–513. doi: 10.1002/(SICI)1097-0142(19960201)77:3<507::AID-CNCR12>3.0.CO;2-8. [DOI] [PubMed] [Google Scholar]
- 31.Barrett JC, Wong A, McLachlan JA. Diethylstilbestrol induces neoplastic transformation without measurable gene mutation at two loci. Science. 1981;212:1402–1404. doi: 10.1126/science.6262919. [DOI] [PubMed] [Google Scholar]
- 32.Colborn T, Dumanski D, Myers JP. Our stolen future. New York: Penguin Books, Inc; 1996. [Google Scholar]
- 33.Colborn T, Clement C. Chemically-induced alterations in sexual and functional development: The wildlife/human connection. Princeton: Princeton Scientific; 1992. [Google Scholar]
- 34.Colborn T, vom Saal FS, Soto AM. Developmental effects of endocrine-disrupting chemicals in wildlife and humans [see comments] Environ Health Perspect. 1993;101:378–384. doi: 10.1289/ehp.93101378. [DOI] [PMC free article] [PubMed] [Google Scholar]
- 35.Newbold RR, Jefferson WN, Padilla-Burgos E, Bullock BC. Uterine carcinoma in mice treated neonatally with tamoxifen. Carcinogenesis. 1997;18:2293–2298. doi: 10.1093/carcin/18.12.2293. [DOI] [PubMed] [Google Scholar]
- 36.Newbold RR, Banks EP, Bullock B, Jefferson WN. Uterine adenocarcinoma in mice treated neonatally with genistein. Cancer Res. 2001;61:4325–4328. [PubMed] [Google Scholar]
- 37.Newbold RR, Liehr JG. Induction of uterine adenocarcinoma in CD-1 mice by catechol estrogens. Cancer Res. 2000;60:235–237. [PubMed] [Google Scholar]
- 38.Huang WW, Yin Y, Bi Q, et al. Developmental diethylstilbestrol exposure alters genetic pathways of uterine cytodifferentiation. Mol Endocrinol. 2005;19:669–682. doi: 10.1210/me.2004-0155. [DOI] [PubMed] [Google Scholar]
- 39.Hewitt SC, Deroo BJ, Hansen K, et al. Estrogen receptor-dependent genomic responses in the uterus mirror the biphasic physiological response to estrogen. Mol Endocrinol. 2003;17:2070–2083. doi: 10.1210/me.2003-0146. [DOI] [PubMed] [Google Scholar]
- 40.Risinger JI, Maxwell GL, Chandramouli GV, et al. Microarray analysis reveals distinct gene expression profiles among different histologic types of endometrial cancer. Cancer Res. 2003;63:6–11. [PubMed] [Google Scholar]
- 41.Thigpen JE, Setchell KD, Ahlmark KB, et al. Phytoestrogen content of purified, open- and closed-formula laboratory animal diets. Lab Anim Sci. 1999;49:530–536. [PubMed] [Google Scholar]
- 42.Dai H, Meyer M, Stepaniants S, Ziman M, Stoughton R. Use of hybridization kinetics for differentiating specific from non-specific binding to oligonucleotide microarrays. Nucleic Acids Res. 2002;30:e86. doi: 10.1093/nar/gnf085. [DOI] [PMC free article] [PubMed] [Google Scholar]
- 43.Weng L, Dai H, Zhan Y, He Y, Stepaniants SB, Bassett DE. Rosetta error model for gene expression analysis. Bioinformatics. 2006;22:1111–1121. doi: 10.1093/bioinformatics/btl045. [DOI] [PubMed] [Google Scholar]
- 44.Zeeberg BR, Qin H, Narasimhan S, et al. High-Throughput GoMiner, an ‘industrial-strength’ integrative gene ontology tool for interpretation of multiple-microarray experiments, with application to studies of Common Variable Immune Deficiency (CVID) BMC Bioinformatics. 2005;6:168. doi: 10.1186/1471-2105-6-168. [DOI] [PMC free article] [PubMed] [Google Scholar]
- 45.Hosack DA, Dennis G, Jr, Sherman BT, Lane HC, Lempicki RA. Identifying biological themes within lists of genes with EASE. Genome Biol. 2003;4:R70. doi: 10.1186/gb-2003-4-10-r70. [DOI] [PMC free article] [PubMed] [Google Scholar]
- 46.Pfaffl MW. A new mathematical model for relative quantification in real-time RT-PCR. Nucleic Acids Res. 2001;29:e45. doi: 10.1093/nar/29.9.e45. [DOI] [PMC free article] [PubMed] [Google Scholar]
- 47.Yin Y, Lin C, Ma L. MSX2 promotes vaginal epithelial differentiation and wolffian duct regression and dampens the vaginal response to diethylstilbestrol. Mol Endocrinol. 2006;20:1535–1546. doi: 10.1210/me.2005-0451. [DOI] [PMC free article] [PubMed] [Google Scholar]
- 48.Yoshida A, Newbold RR, Dixon D. Abnormal cell differentiation and p21 expression of endometrial epithelial cells following developmental exposure to diethylstilbestrol (DES) Toxicol Pathol. 2000;28:237–245. doi: 10.1177/019262330002800203. [DOI] [PubMed] [Google Scholar]
- 49.Yoshida A, Newbold RR, Dixon D. Effects of neonatal diethylstilbestrol (DES) exposure on morphology and growth patterns of endometrial epithelial cells in CD-1 mice. Toxicol Pathol. 1999;27:325–333. doi: 10.1177/019262339902700308. [DOI] [PubMed] [Google Scholar]
- 50.Newbold RR, Hanson RB, Jefferson WN. Ontogeny of lactoferrin in the developing mouse uterus: A marker of early hormone response. Biol Reprod. 1997;56:1147–1157. doi: 10.1095/biolreprod56.5.1147. [DOI] [PubMed] [Google Scholar]
- 51.Li S, Washburn KA, Moore R, et al. Developmental exposure to diethylstilbestrol elicits demethylation of estrogen-responsive lactoferrin gene in mouse uterus. Cancer Res. 1997;57:4356–4359. [PubMed] [Google Scholar]
- 52.Yanaihara A, Toma Y, Saito H, Yanaihara T. Cell proliferation effect of lactoferrin in human endometrial stroma cells. Mol Hum Reprod. 2000;6:469–473. doi: 10.1093/molehr/6.5.469. [DOI] [PubMed] [Google Scholar]
- 53.Sundstrom SA, Komm BS, Ponce-de-Leon H, Yi Z, Teuscher C, Lyttle CR. Estrogen regulation of tissue-specific expression of complement C3. J Biol Chem. 1989;264:16941–16947. [PubMed] [Google Scholar]
- 54.DiAugustine RP, Petrusz P, Bell GI, et al. Influence of estrogens on mouse uterine epidermal growth factor precursor protein and messenger ribonucleic acid. Endocrinology. 1988;122:2355–2363. doi: 10.1210/endo-122-6-2355. [DOI] [PubMed] [Google Scholar]
- 55.Gardner RM, Verner G, Kirkland JL, Stancel GM. Regulation of uterine epidermal growth factor (EGF) receptors by estrogen in the mature rat and during the estrous cycle. J Steroid Biochem. 1989;32:339–343. doi: 10.1016/0022-4731(89)90205-7. [DOI] [PubMed] [Google Scholar]
- 56.Manni A, Baker R, Arafah BM, Pearson OH. Uterine oestrogen and progesterone receptors in the ovariectomized rat. J Endocrinol. 1981;91:281–287. doi: 10.1677/joe.0.0910281. [DOI] [PubMed] [Google Scholar]
- 57.Ciocca DR, Oesterreich S, Chamness GC, McGuire WL, Fuqua SA. Biological and clinical implications of heat shock protein 27,000 (Hsp27): A review. J Natl Cancer Inst. 1993;85:1558–1570. doi: 10.1093/jnci/85.19.1558. [DOI] [PubMed] [Google Scholar]
- 58.Weisz A, Cicatiello L, Persico E, Scalona M, Bresciani F. Estrogen stimulates transcription of c-jun protooncogene. Mol Endocrinol. 1990;4:1041–1050. doi: 10.1210/mend-4-7-1041. [DOI] [PubMed] [Google Scholar]
- 59.Weisz A, Bresciani F. Estrogen induces expression of c-fos and c-myc protooncogenes in rat uterus. Mol Endocrinol. 1988;2:816–824. doi: 10.1210/mend-2-9-816. [DOI] [PubMed] [Google Scholar]
- 60.Fujita M, Ogawa S, Fukuoka H, et al. Differential expression of secreted frizzled-related protein 4 in decidual cells during pregnancy. J Mol Endocrinol. 2002;28:213–223. doi: 10.1677/jme.0.0280213. [DOI] [PubMed] [Google Scholar]
- 61.Couse JF, Dixon D, Yates M, et al. Estrogen receptor-alpha knockout mice exhibit resistance to the developmental effects of neonatal diethylstilbestrol exposure on the female reproductive tract. Dev Biol. 2001;238:224–238. doi: 10.1006/dbio.2001.0413. [DOI] [PubMed] [Google Scholar]