

SUMMARY
Tor proteins are global regulators situated at the top of a signal transduction pathway conserved from yeast to humans. Specific inhibition of the two S. cerevisiae Tor proteins by rapamycin alters many cellular processes and the expression of hundreds of genes. Among the regulated genes are those whose expression is activated by the GATA-family transcription activator, Gln3. The extent of Gln3 phosphorylation has been thought to determine its intracellular localization, with phosphorylated and dephosphorylated forms accumulating in the cytoplasm and nucleus, respectively. Data presented here demonstrate that rapamycin and the glutamine synthetase inhibitor, methionine sulfoximine (MSX), although eliciting the same outcomes with respect to Gln3-Myc13 nuclear accumulation and NCR-sensitive transcription, generate diametrically opposite effects on Gln3-Myc13 phosphorylation. MSX increases Gln3-Myc13 phosphorylation while rapamycin decreases it. Gln3-Myc13 phosphorylation levels are regulated by at least three mechanisms: (i) one, observed during carbon starvation, depends on Snf1 kinase, (ii) another, observed during both carbon-starvation and MSX-treatment, is Snf1-independent, and (iii) the last is rapamycin-induced dephosphorylation. MSX and rapamycin act additively on Gln3-Myc13 phosphorylation, but MSX clearly predominates. These results suggest that MSX- and rapamycin-inhibited proteins are more likely to function in separate regulatory pathways than they are to function tandemly in a single pathway as previously thought. Further, Gln3 phosphorylation/dephosphorylation, that we and others have detected thus far, is not a demonstrably required step in achieving Gln3 nuclear localization and NCR-sensitive transcription in response to MSX- or rapamycin-treatment.
INTRODUCTION
The potential utility of rapamycin and its derivatives as drugs that diminish tissue rejection in transplant patients and cell division in some forms of cancer, particularly those associated with defects in the pTEN tumor suppressor gene, have stimulated interest and research into the mechanisms through which the drug’s target, the Tor protein, regulates cellular processes (1–4). Moreover, studies in Saccharomyces cerevisiae are contributing significantly to our understanding of the Tor signal transduction pathway in eukaryotic cells. These studies have identified many of the downstream targets of Tor1/2 control as well as participants in the yeast signal transduction pathway itself, including peptidyl prolyl isomerase/rotomase, Frp1 (5, 6), protein kinase Tap42 (7–15a), Tip41 (11, 15), type-2A protein phosphatases, Pph21/22 (8, 14), Sit4 (7,8, 14, 16–18), and Pph3 (16), Sit4-associated proteins or Saps (11, 17, 19, 20), Lst8, which participates in protein trafficking (21–23), and proteins found in complexes with Tor1/2, Kog1, Avo1–3, Tco89, and Bit6 (21, 22).
The transcription factor often used as a downstream reporter of the Tor1/2 signal transduction pathway in S. cerevisiae is Gln3, the transcription activator responsible for nitrogen catabolite repression- (NCR-) sensitive expression of the nitrogen catabolic genes (24–27). It is through NCR-sensitive Gln3 regulation that S. cerevisiae selectively utilize good nitrogen sources in preference to poor ones. When cells are provided with good nitrogen sources, such as glutamine or (in some strains) ammonia, Gln3 is localized in the cytoplasm and NCR-sensitive transcription is minimal. In contrast, when poor nitrogen sources, such as proline, are available, Gln3 is nuclear and NCR-sensitive transcription is high (see 24–27 for reviews of the physiology and regulation). The correlations, that Gln3 is nuclear with a poor nitrogen source (28) or in rich medium containing rapamycin (9, 16) were consistent with the suggestion that Tor1/2 transmit the signal of nitrogen excess to Gln3. The observations that rapamycin-induces Gln3 dephosphorylation and that this dephosphorylation depends on Sit4, a Type-2A serine/threonine phosphatase regulated by Tor1/2, Tap42 and Tip41, further connected Gln3 intracellular localization to the upper portion of the Tor1/2 pathway (9, 11, 16, 29, 30, see ref. 31 for a large group of reviews on Tor and rapamycin). Recently, treating cells with the glutamine synthetase inhibitor, L-methionine sulfoximine (MSX) has been reported to increase Gln3 dephosphorylation, nuclear accumulation, and Gln3-activated transcription (32). MSX data also led to the conclusion that the nitrogen nutrient sensed by the Tor pathway is glutamine or a glutamine-metabolite (32). In sum, rapamycin-treatment, nitrogen-limitation, glutamine-starvation and MSX-treatment all generate the same outcomes, nuclear localization of Gln3 and increased Gln3-mediated gene expression. In bare outline, the Tor pathway has been envisioned as glutamine levels positively regulating Tor1/2, which in turn positively regulate Tip41 and/or Tap42, the latter negatively regulating Sit4 phosphatase activity, preventing it from dephosphorylating Gln3, which thereby restricts Gln3 to the cytoplasm. Addition of either MSX, which inhibits production of the positive input signal sensed by Tor1/2 (glutamine) or rapamycin, which inhibits Tor1/2 themselves, frees Sit4, and perhaps a second Type-2A phosphatase (Pph3) (16), to dephosphorylate Gln3. Dephosphorylated Gln3, being capable of nuclear localization, can now function as a transcription activator (9, 16).
In addition to the two type-2A phosphatases, two protein kinases, Tor1/2 and Snf1, are also associated with Gln3 regulation. Both the Tor proteins and Snf1 phosphorylate Gln3 in vitro and interact with Gln3 in two-hybrid interaction and co-immunoprecipitation experiments (16, 33). However, the actions of these kinases appear to regulate Gln3 localization differently. Tor1/2-dependent, i.e., rapamycin-sensitive, Gln3 phosphorylation correlates with its cytoplasmic localization, whereas Snf1-dependent Gln3 phosphorylation correlates with its nuclear accumulation during glucose starvation. Phosphorylation events regulated by the two kinases were concluded to be distinct because glucose-starvation-induced Gln3 phosphorylation could be elicited in the presence of rapamycin (16, 33).
Although much of the available data support the existing view of Tor regulation, several observations suggest that we do not yet fully understand how Tor1/2 regulate Gln3 intracellular localization. (i) The results of genetic studies with tap42 mutants are more consistent with the suggestion of Tap42 functioning as a positive rather than a negative regulator of Sit4 activity (7, 8 13, 14). (ii) Gln3 phosphorylation levels do not correlate with intracellular Gln3 localization in cells provided with a range of nitrogen sources and during nitrogen and carbon starvation in the same way as they do with rapamycin-treatment (34). (iii) Nuclear accumulation of phosphorylated Gln3 during carbon starvation derives not from starvation for glucose, but for nitrogen. Nitrogen starvation occurs because glucose-starved cells cannot produce the α-ketoglutarate needed to assimilate the nitrogen source (ammonia) used in the experiment. Therefore, both phosphorylated Gln3, generated by α-ketoglutarate-mediated nitrogen starvation, and dephosphorylated Gln3, in response to rapamycin addition, accumulate in the nucleus (35). This occurs in spite of the fact that nitrogen starvation and rapamycin are both thought to regulate Gln3 through their inhibition of Tor1/2 (9, 16, 29, 30).
This study was initiated in an effort to rectify instances in which available data cited above are not congruent with expectations derived from the current model describing how the S. cerevisiae Tor proteins regulate Gln3. The report of MSX triggering dephosphorylation and nuclear localization of Gln3 provided a new way of perturbing Gln3 regulation (32), and prompted us to employ MSX in our investigations. Here, we confirm the earlier report that MSX-treatment elicits nuclear localization of Gln3-Myc13 and high level NCR-sensitive gene expression. But to our surprise, MSX markedly increased rather than decreased Gln3-Myc13 phosphorylation. Our results demonstrate Gln3-Myc13 phosphorylation occurs by at least two mechanisms: one is Snf1-dependent and the other Snf1-independent. MSX-induced Gln3 phosphorylation is Snf1-independent, whereas both mechanisms function to increase Gln3 phosphorylation during carbon starvation. Further, the effects of MSX and rapamycin-treatment on Gln3 phosphorylation are additive, but those of MSX clearly predominate. Although MSX- and rapamycin-treatment generate the same final outcome, nuclear localization of Gln3, the phosphorylation data are more consistent with MSX and rapamycin acting in parallel pathways to achieve that outcome than they are with their inhibiting tandem steps in a single regulatory pathway as previously proposed. These observations also suggest that something more or other than the Gln3 phosphorylation/dephosphorylation levels, detected thus far, determine the intracellular localization of Gln3.
MATERIALS AND METHODS
Strains and media
Saccharomyces cerevisiae strains TB123 (MATa leu2–3,112, ura3–52, rme1, trp1, his4, GAL+, HMLa, GLN3-Myc13[KanMX]) (10) and RR181 (MATa leu2-3,112, ura3-52, rme1, trp1, his4, GAL+, HMLa GLN3-Myc13[KanMX] snf1::TRP1) were grown at 30° C to mid-log phase (A600 nm = 0.5) in YNB (without ammonium sulfate or amino acids) medium, containing 2% glucose, required auxotrophic supplements (120 μg/ml leucine, 20 μg/ml uracil, 20 μg/ml histidine, 20 μg/ml tryptophan, 20 μg/ml arginine), and the nitrogen source (0.1% final concentration) indicated in the figure legends. Cells in Fig. 2B were cultured in SD medium prepared as described earlier (32, 36). Rapamycin (dissolved in 10% Tween 20 + 90% ethanol) was added to the cultures, where indicated, at a final concentration of 0.2 μg/ml. L-methionine sulfoximine (MSX) (Sigma) was dissolved in water and added to the cultures, where indicated, at a final concentration of 2 mM. When yeast were transferred into carbon- or nitrogen-starvation media, the starvation media were pre-warmed, pre-aerated, and contained required auxotrophic supplements.
Figure 2.

Effects of growth conditions, MSX-treatment, and method of cell harvest on the electrophoretic mobility of Gln3-Myc13. Wild type (TB123) cells were cultured in YNB-ammonia 0.1% or 0.5% (+NH4), YNB-glutamine (0.1%) (GLN) or synthetic dextrose (SD) medium. Where indicated, cells were incubated with 2 mM MSX (MSX +) or 200 ng/ml rapamycin (RAP +) for 30 min. prior to harvest. Cells were harvested by the filtration (Filter) (panels A–C) or centrifugation (Centrifuge) (panels B, C) procedures described in Methods. Protein was isolated and the electrophoretic mobility of Gln3-Myc13 assayed by western blot analysis as described in Methods.
Strain Construction
Strain RR181 was constructed as follows. A fragment containing the SNF1 gene and its flanking sequences was amplified by high fidelity PCR (Stratagene PFU Turbo DNA polymerase) using DNA from TCY1 as template. An EcoRI-SpeI fragment from the PCR product was cloned into pBS(KS+), yielding pRR576. The 2.2 kb, SNF1-containing, PstI-HpaI fragment from pRR576 was replaced with the 0.8 kb, TRP1-containing, PstI- HpaI fragment from pRR496, yielding pRR578. The 1.7 kb EcoRI-SpeI fragment from pRR578 was used to transform strain TB123. Trp+ recombinants were selected by growth in minimal medium. Genomic Southern blot and mRNA analyses were used to confirm the presence of the snf1Δ in RR181.
Northern Blot Analysis
RNA was isolated and Northern blots performed as described earlier (37, 38). Hybridization probes, other than that for SNF1 were described earlier (39, 40). The SNF1 probe was prepared by PCR, using primers 5′-AGCAGCCCAGATAACGATGAA-3′ and 5′-AATCCTCTTCAGATGGCTTGG-3′.
Western Analysis
Cells were harvested in one of two ways: In the first method, the flask containing the culture was swirled in an ice-water bath for 1 min. (9). The culture was then transferred to a sterile 40 ml Nalgene tube and the cells pelleted at 3,000 rpm for 5 mins. (4° C). The supernatant was removed, the cell pellet resuspended in 300 μl of ice cold protein extraction buffer [120 mM NaCl, 50 mM Tris pH 7.5, 2 mM EDTA, 2 mM PMSF, 10 mM NaF, 10 mM p-nitrophenylphosphate, 10 mM sodium pyrophosphate, 10 mM β-glycerophosphate, and a commercial cocktail of protease inhibitors, (Roche, Minicomplete) (9, 34)], transferred to a microfuge tube and the cells collected by centrifugation (30 sec. at 3000 rpm). The cells were resuspended in 200 μl of fresh, ice-cold extraction buffer and further processed as described earlier (34).
Alternatively, cells were harvested by filtration onto a type HA, 0.45μm Millipore filter. Cells were quickly scraped from the filter, placed in a sterile 1.5 ml microfuge tube, and flash-frozen by submerging the microfuge tube and cells in liquid nitrogen for 20–30 seconds. The total time for cell harvest was 45–50 sec. The tube, still containing liquid nitrogen, was then quickly transferred to −80° C until further processing of the cells was required. As with the centrifugation method, the frozen cells were resuspended in 200 μl of cold protein extraction buffer, cold glass beads were added and the cells processed as described in Cox et al. (34). Except where otherwise indicated, cells were harvested throughout this work using the filtration-flash-freezing method. Conditions of electrophoresis, immunochemical staining and visualization were also as described earlier (34).
Although the method of cell harvest was not indicated in previous reports (9, 16), the data presented are the same as we obtained when we harvested cells using the centrifugation method (34). It may also be pertinent that centrifugation, along with chilling the cells on ice for ~10 min., was used when cells in one report were transferred to new nutrient conditions (9).
In some experiments we observed spurious lane-to-lane variation in signal strength that we were unable to eliminate. Therefore, we felt it more prudent to assess the relative amounts of various species within a lane, and to compare the pattern of data observed in that lane to the pattern observed in another lane, than to quantitatively compare the amounts of specific Gln3 species observed in one lane to those in another. Also in many cases, control extracts derived from glutamine-grown cells were placed in the outside lanes of the gel as done earlier (34).
Phosphatase treatment
Crude protein extracts were prepared as described above with the following extraction buffer: 120 mM Tris-HCl pH 7.5, 50 mM NaCl, 2 mM EDTA and 2 mM PMSF and a commercial cocktail of protease inhibitors (Roche). Extracts were incubated with 20 U of calf intestional alkaline phosphatase (CIP) (Roche Diagnostics) or 20 U of CIP + phosphatase inhibitor, 40 mM sodium pyrophophate, for 15 min. (ammonia) or 30 min. (urea) at 30° C. Just prior to CIP addition, we added 0.9 mM MgCl2 and 0.1 mM ZnCl2 (final concentrations), to alleviate inhibition of CIP by EDTA that was present in the extraction buffer. Following incubation, samples were boiled 5 min. and then loaded onto the gel. We noted that the presence of pyrophosphate in a sample adversely affected the strength of the immunofluorescent signal.
Indirect Immunofluorescence
Immunofluorescence staining was carried out as described by Cox et al. (34, 35).
RESULTS
MSX-induces decreased Gln3-Myc13 mobility suggesting increased phosphorylation
Rapamycin-inhibition of Tor1/2 has been useful both in the study of Tor function and Gln3 regulation. Analogously, MSX appears to be an even more useful perturbant for investigating control of Gln3. This inhibitor is more specific than rapamycin in that it altered nuclear localization of Gln3 and Rtg1, but not Gat1, Msn2, Msn4, and an unknown factor involved in the regulation of ribosomal protein gene expression (32).
Our studies were initiated with control experiments testing whether MSX elicited the same response in our hands as previously reported (32). In support of that earlier work, we observed that treating cells with MSX markedly increased both Gln3- and Rtg3-mediated expression of DAL5 and CIT2, respectively (Fig. 1). Moreover, increased expression occurred with each nitrogen source tested except glutamine. The data, however, exhibited a somewhat unexpected characteristic. DAL5 expression increased more in glutamate-grown cells treated with MSX than when induced by rapamycin (Fig. 1A, lanes C–E). This was exceptional because rapamycin inhibits proteins (Tor1,2) considered to be downstream of the nutrient-sensing signal altered by MSX-inhibition of glutamine synthetase in the current model of Tor regulation (32).
Figure 1.

Northern blot analysis of the effects of 2 mM L-methionine sulfoximine- (MSX +) or 200 ng/ml rapamycin- (RAP +) treatment on NCR-sensitive (DAL5) and retrograde (CIT2) gene expression in wild type (TB123) or snf1Δ (RR181). S. cerevisiae cells, growing in YNB medium, were provided with 0.1% proline (PRO), glutamate (GLU), urea, ammonia (+NH4), or glutamine (GLN) as sole nitrogen source. Inhibitors, where indicated (+) were present for 30 min. prior to samples being collected. Radiolabelled, PCR products for DAL5, CIT2, DAL80, HHT-1 (H3) and ACT1 were used as hybridization probes with H3 and ACT1 serving as controls to assess RNA loading and transfer.
Given these positive results, we assessed the effect of MSX on Gln3 phosphorylation, and were surprised that MSX-treatment decreased Gln3-Myc13 mobility rather than increasing it (Fig. 2A, lanes B, C). This change in mobility suggested Gln3-Myc13 phosphorylation was increased rather than decreased by MSX-treatment, a finding unaccountably opposite to the observations of Crespo et al. (32).
Effects of culture medium and method of cell harvest on Gln3-Myc13 mobility
The striking difference in MSX-induced Gln3-Myc13 mobility we observed compared to that reported earlier prompted us to look more carefully at the experimental conditions used in present and past experiments. The first difference was the concentration of ammonia provided in the medium; we used 0.1% compared to 0.5% used in the earlier analysis (32). This, however, did not account for the differing results. MSX-treatment decreased Gln3-Myc13 mobility irrespective of the ammonia concentration (Fig. 2A, lanes B–E). Minor differences did, however, occur in the migration rates of minor Gln3-Myc13 species derived from untreated cells grown at the two ammonia concentrations. Gln3-Myc13 migrated slightly faster with glutamine than low (0.1%) ammonia as nitrogen source; this difference was greater at the higher (0.5%) concentration of ammonia (compare Fig. 2A, lanes A, B and E, F).
Present and past experiments technically differed in two further respects. YNB medium was used in current experiments whereas those reported earlier used SD. Although the two media are similar in composition, they are not identical and differences in results obtained with them have been noted in the past (T.G. Cooper and J. Bossinger, unpublished results). In the present instance, however, media differences were not important; MSX-treatment elicited decreased Gln3-Myc13 mobility in both media (Fig. 2B, lanes B, C and D, E). The second difference was the method of cell harvest. In previous experiments, centrifugation was used to harvest the cells (34), whereas filtration and flash-freezing was used here. We changed our protocol because Wilson et al. reported Snf1 kinase is activated by centrifugation (41), and Snf1 is required for Gln3 phosphorylation during glucose starvation (33). As shown in Fig. 2C (lanes A, B and D, E), centrifugation decreased Gln3-Myc13 mobility. The uppermost band (upper black dot) in lanes A and D (prepared by centrifugation) is absent in lanes B and E (filtration). Further, although not as clear in the photograph as the original films, Gln3-Myc13 is about equally distributed between the two predominant bands in lanes B and E. In contrast, in lanes A and D, where centrifugation was used, more of the protein is situated in the uppermost of these two bands (lower black dot). In cells treated with rapamycin, the method of harvest seemed to make less difference in Gln3-Myc13 mobility (lanes C and F).
Decreased MSX-induced Gln3-Myc13 mobility derives from increased phosphorylation
Since differences we could identify between current and past experimental techniques did not account for differences in our results with MSX compared to those reported earlier, we determined whether the electrophoretic behavior of Gln3-Myc13 from MSX-treated cells (i) was an artifact created during extract preparation, or (ii) derived from verifiable hyper-phosphorylation. We tested the first possibility using an in vitro mixing experiment. Four wild type cultures were prepared. The first two were treated with rapamycin for 30 min., while the third and fourth were similarly incubated with MSX. The first and third cultures were harvested by filtration and processed normally (Fig. 3A, lanes B, C, respectively). The second culture (rapamycin-treated) was harvested, flash-frozen and held in liquid nitrogen until the fourth cell sample (MSX-treated) was harvested, added to it, and frozen as well (Fig. 3A, lane A and repeated in D). In other words, the third experimental sample contained two sets of cells that were harvested and frozen separately but contained in the same tube. This protocol prevented the cell samples from being exposed to a second drug before or during harvest. The three samples were subsequently thawed, the cells immediately broken and the extracts subjected to electrophoresis. Gln3-Myc13 from the extract of rapamycin-treated cells exhibited significantly greater mobility than the one from MSX-treated cells (Fig. 3A, lanes B, C). The third sample, containing a mixture of cells separately treated with the two inhibitors, yielded a profile that was very nearly the sum of the profiles observed in lanes B and C (Fig. 3A, lanes A, D). This indicated it was unlikely that significant artifacts occurring after the cells were broken had generated the profile seen in extracts from MSX-treated cells. If there was a difference of the profiles in lanes B and C vs. A, D, it was a small amount of artifactual, in vitro dephosphorylation of the slowly migrating Gln3-Myc13 species generated by MSX-treatment in lanes A and D.
Figure 3.

Panel A. Effect of in vitro mixing of frozen cells treated with MSX or rapamycin on the electrophoretic mobility of Gln3-Myc13. Wild type cells were cultured in YNB- urea (0.1%) in the presence (+) or absence (−) of MSX or rapamycin. In lanes B and C, cells were harvested by filtration and processed normally for western blot analysis. The combined cell samples in panel A, lanes A and D (one from rapamycin-treated cells and the other from MSX-treated cells) were harvested and frozen separately, but with freezing taking place in the same microfuge tube as described in the text. Thereafter, all of the cell samples were processed normally for western blot analysis. By this procedure, the extracts in lanes A and D derived from cells and extracts that were mixed only during the process of cell breakage.
Panels B and C. Effects of phosphatase treatment on the electrophoretic mobility of Gln3-Myc13 derived from cells cultured under various conditions. Wild type cells were cultured in YNB-urea (0.1%) or YNB-ammonia (0.1%) (+NH4) media to mid log phase. Cultures were then incubated in the presence (+) or absence (−) of MSX or rapamycin for 30 min. and harvested by filtration and flash freezing. Cells were broken in the phosphatase buffer described in Methods and the indicated samples (+) were incubated with either calf intestional alkaline phosphatase (CIP) or CIP plus 40 mM sodium pyrophosphate (Inh). Following this incubation, the extracts were processed for western blot analysis as described in Methods.
To determine whether decreased Gln3-Myc13 mobility observed with extracts from MSX-treated cells derived from increased phosphorylation, we tested its sensitivity to calf intestine alkaline phosphatase (CIP). Incubating extracts from urea-grown, MSX-treated cells with CIP prior to electrophoresis, increased the mobility of Gln3-Myc13 such that it nearly co-migrated with that from rapamycin-treated cells (Fig. 3B, lanes D–F). The CIP-dependent increase in Gln3-Myc13 mobility was prevented by including 40 mM sodium pyrophosphate, a CIP inhibitor, in the reaction mixture (lanes C–E). Extracts derived from similarly treated ammonia-grown cells yielded the same results (Fig. 3C). It is not clear why Gln3-Myc13 was dephosphorylated by CIP to a level one band above that observed with rapamycin-treatment rather than to the same level, but we did encounter some inhibition of CIP by our extraction buffer.
Three conclusions derived from these experiments: (i) Gln3 phosphorylation levels are sensitive to even minor differences in culture conditions and method of cell harvest, (ii) centrifugation, as reported for other substrates of Snf1 (41), increases Gln3 phosphorylation, and (iii) treating cells with MSX markedly increases rather than decreases Gln3 phosphorylation irrespective of technical differences evaluated above.
Increased nuclear localization of Gln3-Myc13 induced by MSX occurs with all nitrogen sources tested but glutamine
Increased Gln3-Myc13 phosphorylation in MSX-treated cells prompted two questions: (i) did MSX- and rapamycin-treatment differentially affect Gln3 nuclear localization, and (ii) were the effects of MSX-treatment influenced by the nitrogen source? The pertinence of these questions derived from the fact that MSX and rapamycin were reported to affect Gln3 phosphorylation, nuclear localization and Gln3-mediated gene expression in the same way, i.e., through their influence on Tor1/2 activity (32).
As previously reported, treating ammonia-grown cells with MSX resulted in strong nuclear accumulation of Gln3-Myc13 similar to that seen in rapamycin-treated cells (Fig. 4A, microscopic images). This accumulation correlated well with high level Gln3-mediated DAL5 expression under the same conditions (Fig. 4A, images and Fig. 1A, lanes H, I). On the other hand, little Gln3-Myc13 nuclear localization or DAL5 expression occurred in MSX-treated, glutamine-grown cells (Fig. 4F, images and Fig. 1A, lanes J, K). This contrasts with the response of glutamine-grown cells to rapamycin (Fig. 4F, images and Fig. 1A, lanes J, L). Glutamine, however, was unique in its ability to prevent nuclear accumulation of Gln3-Myc13. With all of the other nitrogen sources we assayed (urea, proline and glutamate), Gln3-Myc13 nuclear accumulation and DAL5 expression was elicited by MSX-treatment, albeit with some quantitative differences (Fig. 4B, D, E and Fig. 1A).
Figure 4.

Panels A, B, D–F. The effects of MSX- and rapamycin-treatment on the electrophoretic mobility and intracellular localization of Gln3-Myc13 derived from cells cultured with various nitrogen sources. Cells were grown in YNB medium with 0.1% ammonia (+NH4), glutamine (GLN), urea, proline (PRO), or glutamate (GLU), as sole nitrogen source. Cells were treated with MSX or rapamycin as described in Fig. 2. Samples were harvested by filtration and processed as described in methods for western blot analysis (top portions of each panel). Gln3-Myc13 intracellular localization was assessed by indirect immunofluorescence imaging (bottom microscopic images of each panel). Gln3-Myc13 (red) is shown in columns A, C and E. Gln3-Myc13 merged with DAPI-positive material (magenta) is shown in columns B, D and F. Solid lines connect western blots and microscopic images derived from cells cultured under the same conditions.
Panel C. Effect of MSX or rapamycin on Gln3-Myc13 mobility in wild type cells grown in YNB-urea medium. Inhibitor conditions were as in Fig. 2 and the cultures harvested by filtration.
The close correlation described above was not, however, observed in Gln3-Myc13 phosphorylation. Gln3-Myc13 phosphorylation, in preparations derived from ammonia- or urea-grown cells treated with MSX vs. rapamycin, behaved oppositely. Gln3-Myc13 phosphorylation increased upon MSX-treatment and overall, decreased in the presence of rapamycin (Fig. 4A, B, lanes B, C and F, G). To insure that we were not misinterpreting the behavior of Gln3-Myc13 phosphorylation, we compared experimental extracts flanked on either side by controls (Fig. 4C). MSX-treatment increased Gln3-Myc13 phosphorylation relative to wild type (lanes A–C), while rapamycin-treatment decreased it (lanes D–F). The difference was even more dramatic when Gln3-Myc13 from MSX-treated cells was electrophoresed between samples from rapamycin-treated cells (lanes G–I).
Gln3-Myc13 phosphorylation in untreated vs. MSX-treated cells provided with proline or glutamate as nitrogen source overall behaved similarly to ammonia- and urea-grown cells, with the exception that the increase in phosphorylation, relative to untreated cells, was not as great (compare Figs. 4A and B with 4D and E). This derives from the fact that Gln3-Myc13 in untreated cells already exhibits greater phosphorylation with both proline and glutamate than observed with ammonia or urea (compare with Gln3-Myc13 derived from control Gln-grown cells, lanes A, D, E and H) as reported earlier (34). MSX had no demonstrable effect on phosphorylation levels in glutamine-grown cells (Fig. 4F).
Beyond major changes of Gln3-Myc13 phosphorylation in MSX-treated cells, additional more subtle differences were also noted in Fig. 4. When using the filtration method of cell harvest, the most rapidly migrating Gln3-Myc13 species seen in rapamycin-treated cells frequently migrated similarly to the most rapidly migrating species of Gln3-Myc13 from untreated samples. In other words, we did not always see the marked increase in electrophoretic mobility in Gln3-Myc13 species often, but not always, observed when we used the centrifugational method of harvest (34) and in earlier reports of phosphorylation experiments (9, 16). This is clearly observed in cells provided with ammonia, urea and glutamine as nitrogen source (Fig. 4A, B, lanes F–H and Fig. 4F, lanes C, D). The effect is not seen with glutamate or proline, because rapamycin-treatment of cells provided with these nitrogen source does not increase mobility of Gln3-Myc13; this is in agreement with our earlier observations (34).
Since MSX-treatment of urea-grown cells produced the largest change in Gln3-Myc13 mobility, we chose this nitrogen source for subsequent experiments. However, experiments using ammonia-grown cells were also performed in most cases to insure the results we observed did not derive from using urea as the nitrogen source.
Snf1-dependent and -independent Gln3-Myc13 phosphorylation during carbon-starvation
Increased Gln3-Myc13 phosphorylation following MSX-treatment was similar to that observed earlier during carbon starvation of ammonia-grown cells (33, 34). Moreover, as occurs with MSX treatment above, Gln3-Myc13 localizes to the nuclei of ammonia-grown, carbon-starved cells (33–35). These correlations raised the possibility that carbon-starvation-activated Snf1 kinase (42–44) might play a role in MSX-mediated Gln3-Myc13 phosphorylation. To evaluate this possibility, we determined whether deletion of SNF1 affected NCR-sensitive Gln3-mediated gene expression, and whether all of the increased Gln3-Myc13 phosphorylation observed during carbon-starvation was Snf1-dependent. Wild type and snf1Δ strains are equally NCR-sensitive (Fig. 5A, lanes A–D). However, strains in this genetic background are overall less NCR-sensitive than M970 in the Σ 1278b background; this is more clearly evident in the case of DAL80 expression (compare data in this work with analogous experiments in refs. 39, 40). Similarly, the CIT2 expression profile with various conditions is not identical to that in M970 (39, 40). SNF1 expression was not demonstrably affected by NCR and the message was totally absent, as expected, in the snf1Δ (Fig. 5A, lanes E–H). Furthermore, Gln3-Myc13 accumulated in the nuclei of snf1Δ cells treated with either rapamycin or MSX in nearly the same ways as wild type (Fig. 5B). There did appear, however, to be greater Gln3-Myc13 nuclear localization in the glutamine-grown, MSX-treated snf1Δ.
Figure 5.
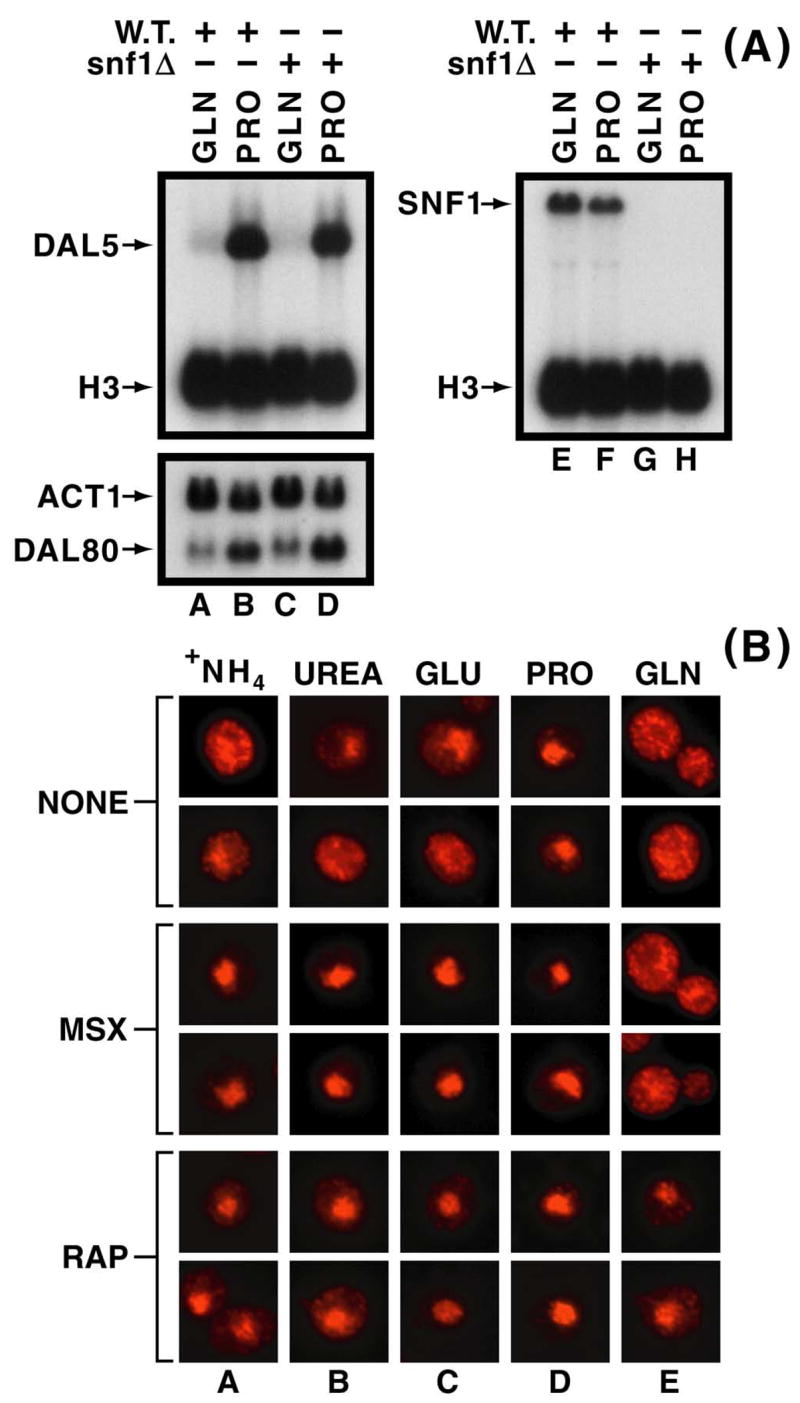
The effects of MSX- and rapamycin-treatment on Gln3- and Rtg3-mediated transcription in wild type (TB123) and snf1Δ (RR181) as well as intracellular Gln3-Myc13localization in a snf1Δ. Experimental details for Northern blots in Panel A and microscopic images in Panel B were as described in Figs. 1 and 4, respectively. Images of DAPI-positive material were collected but were not merged for publication with those of the Gln3-Myc13 signal in Panel B (data not shown).
We next measured Gln3-Myc13 phosphorylation in carbon-starved wild type and snf1Δ cells. As quickly as 30 mins. following onset of carbon-starvation, Gln3-Myc13 phosphorylation in the wild type strain increased (Fig. 6A, compare lane B to lanes C–F) as reported by Bertram et al. and subsequently ourselves (33, 34). In addition, the heterogeneity of Gln3-Myc13 species increased compared to the unstarved sample. When the above experiment was repeated in a snf1Δ, carbon-starvation increased Gln3-Myc13 phosphorylation, but to a lesser degree than wild type (compare Fig. 6B, lanes A–F with equivalent lanes in Fig. 6A). In addition, phosphorylated Gln3-Myc13 species were less heterogeneous in the snf1Δ; there were three major species (Fig. 6B, lane D, black dots). Characteristic differences in Gln3-Myc13 phosphorylation between carbon-starved wild type and snf1Δ cells are more clearly seen in Fig. 6C, lanes C–E. These results suggest that carbon-starvation elicits both Snf1-dependent and -independent Gln3-Myc13 phosphorylation.
Figure 6.

The effects of carbon starvation on the mobility of Gln3-Myc13 in wild type (W.T.) (TB123) and snf1Δ (RR181) cells. Cells were cultured in YNB medium containing the indicated nitrogen source (0.1%). Extracts from glutamine-grown cells (GLN) were used as a control. In instances of starvation, cells were permitted to grow to an A600 nm = 0.5, the cultures quickly filtered and the cells transferred to pre-warmed, pre-aerated YNB-urea medium devoid of glucose. Following starvation for the times indicated (in min.), cells were harvested by filtration and processed as described in Methods for western blot analysis.
The expected phenotype of deleting a protein kinase gene is decreased phosphorylation of its target substrates, as observed with Gln3-Myc13 phosphorylation in carbon-starved snf1Δ vs. wild type (Fig. 6C, lanes C–E). However, in addition, we observed a slight increase in Gln3-Myc13 phosphorylation (by one band, black dot) in the snf1Δ grown in high glucose (Fig. 6C, lanes A, B). The effect is most clearly seen by comparing Gln3-Myc13 phosphorylation in glutamine- vs. urea-grown wild type cells (Fig. 6A, lanes A, B) with those in the snf1Δ (Fig. 6C, lanes A, B and F, G). This suggests Snf1, in high glucose medium, indirectly influences Gln3-Myc13 phosphorylation in a way opposite to that seen in carbon-starved cells.
MSX-induced Gln3-Myc13 phosphorylation is Snf1-independent
Given that both Snf1-dependent and -independent Gln3-Myc13 phosphorylation occurred, we wanted to ascertain which mechanism was associated with MSX-elicited Gln3-Myc13 phosphorylation. Therefore, an extract from MSX-treated cells was placed between two extracts from carbon-starved, wild type (Fig. 7A, lanes C–E) or snf1Δ (Fig. 7B, lanes C-E) cells. The Gln3-Myc13 phosphorylation profile in MSX-treated, wild type cells resembled that observed in a carbon-starved snf1Δ more than it did wild type, suggesting phosphorylation was Snf1-independent. This was confirmed by demonstrating Gln3-Myc13 phosphorylation increased in unstarved snf1Δ cells treated with MSX compared with untreated snf1Δ cells (Fig. 7D, lanes A–C; also observed in Fig. 7B, lanes B, D). Consistent with these results, the Snf1-dependent heterogeneity of hyper-phosphorylated Gln3-Myc13 species observed in carbon-starved wild type cells was lacking in MSX-treated cell extracts (Fig. 7A, lanes C–E and Fig. 7B, lanes C–E). The question remained, however, whether or not Gln3-Myc13 phosphorylation levels observed in MSX-treated wild type and snf1Δ cells were the same. Data in Fig. 7C (lanes D and E), argue that Gln3-Myc13 species from the two cell samples co-migrate. The slight apparent lag in mobility of the upper-most band in lane E (black dot) relative to that in lane D derives from “blooming” of the more intense signal in lane E. On the other hand, the small increase in Gln3-Myc13 phosphorylation previously seen in snf1Δ relative to wild type is also present in Fig. 7C, lanes B, C. Note that the bottom band in lane B is missing in lane C. Together these data suggest that (i) Gln3 is phosphorylated during carbon-starvation by both Snf1-dependent and independent mechanisms, and (ii) MSX-elicits Snf1-independent Gln3 phosphorylation.
Figure 7.

Comparison of the effects elicited by MSX-treatment, rapamycin-treatment, or carbon starvation on the mobility of Gln3-Myc13 from wild type (W.T.) or snf1Δ cells provided with urea as nitrogen source. Growth conditions were as described in Fig. 6. 2 mM MSX or 200 ng/ml rapamycin was provided, where indicated (+) for 30 min. Carbon starvation was for 180 min. Cells were then harvested by filtration and processed normally for western blot analysis.
During these and other experiments we also noticed that Gln3-Myc13 phosphorylation did not respond in quite the same way to rapamycin-treatment of wild type vs. snf1Δ cells (Fig. 7D, lanes D–F; data not shown). The extent of Gln3-Myc13 dephosphorylation in response to rapamy-cin was greater (by one band) in the wild type than in a snf1Δ, i.e., there was less dephosphorylation in the snf1Δ. Recall the same observation was made above in untreated snf1Δ extracts (Fig. 6C, lanes A, B, and F, G vs. 6A, lanes A, B). This again argued in favor of Snf1 kinase indirectly influencing Gln3-Myc13 dephosphorylation.
Data in Fig. 4A and 4B indicated that increased Gln3-Myc13 phosphorylation was similarly observed in both ammonia and urea-grown cells. To insure this similarity extended to the responses elicited by carbon starvation and snf1Δ, we carbon starved ammonia-grown cells. MSX-induced Gln3-Myc13 phosphorylation occurred in ammonia-grown cells just as it had with urea (Fig. 8A). In both cases, the bottom band in extracts from MSX-treated cells was lost and the signal in the top band increased (carefully compare black dots in Fig. 8A, lanes A, C with Fig. 7A lanes B, D). Similarly, the three phosphorylated species observed in MSX-treated, urea-grown snf1Δ cells were also observed in snf1Δ ammonia-grown samples (Fig. 8B, lanes B and E). Increased heterogeneity of Gln3-Myc13 phosphorylation observed when ammonia-grown wild type cells were starved for carbon was similar to that seen with urea, as was disappearance of the heterogeneity in the snf1Δ (Fig. 8B, lanes C, D).
Figure 8.

Panels A and B. Comparison of the effects elicited by MSX-treatment or carbon starvation on the mobility of Gln3-Myc13 from wild type (W.T.) or snf1Δ cells provided with ammonia as nitrogen source. Except for the nitrogen source, growth conditions were as described in Fig. 6. 2 mM MSX was provided where indicated (+) for 30 min. Carbon starvation was for 30 and/or 180 min.
Panel C. Evaluation of the effects caused by the method of cell harvest on the mobility of Gln3-Myc13 observed following carbon starvation in wild type cells pregrown in YNB-ammonia medium. The length of carbon starvation (in min.) is indicated. Cells were harvested either by centrifugation (Centrifuge) or filtration and flash-freezing (Filter) and processed for Western blot analysis as described in Methods.
Although results with ammonia as nitrogen source were very similar to those observed with urea, one observation in the experiment with ammonia-grown cells was unsettling. In our earlier studies, Gln3-Myc13 phosphorylation increased much more dramatically in ammonia-grown, carbon-starved cells (180’) than we observed here (compare the right panel of Fig. 7B, lanes C, D in ref. 34 with Fig. 8A, lanes A, D of the present work). However, upon comparison, we found the two experiments differed in one important respect, i.e., filtration was used to harvest cells in the present case, whereas we previously used centrifugation (34). This technical difference clearly accounts for the markedly different observations. Gln3-Myc13 was phosphorylated to a much greater extent in the centrifuge-harvested, carbon-starved cells than those collected by filtration (Fig. 8C, compare lanes A, C, D, F).
MSX and nitrogen starvation-induced Gln3-Myc13 phosphorylation
MSX is suggested to elicit increased NCR-sensitive transcription by starving cells of the signal for nitrogen excess (32), predicting the Gln3-Myc13 phosphorylation profiles of MSX-treated and nitrogen-starved cells should be the same. Testing this prediction, we observed that nitrogen starvation of ammonia-grown cells only modestly increased Gln3-Myc13 phosphorylation levels (Fig. 9B, lanes A, F, C, D). Similar results were observed when cells were pre-grown in YNB-urea medium (Fig. 9A, lanes A, F, C, D). In contrast, Gln3-Myc13 phosphorylation increased substantially in MSX-treated cells (Fig. 9A, B, lanes B, E). There was a modest increase in Gln3-Myc13 phosphoryla-tion after 60 min. of nitrogen starvation, but it was still significantly less than observed with MSX (Fig. 9A, B, lanes B–E). Similarly modest, nitrogen source-dependent differences were observed earlier (34). Finally, deletion of SNF1 had no detectable effect on the Gln3-Myc13 phos-phorylation profile generated by nitrogen starvation (data not shown).
Figure 9.

The effects elicited by MSX-treatment or nitrogen starvation on the mobility of Gln3-Myc13 from extracts of wild type cells. Nitrogen starved cells were pregrown in YNB-urea (panel A) or ammonia (panel B) medium prior to starvation. Cultures were then either filtered and cells shifted to pre-warmed, pre-aerated nitrogen-free media or alternatively treated with MSX. After incubation for the indicated times (in min.), samples were harvested and processed for western blot analysis.
Effect of sequential MSX- and rapamycin-treatment on Gln3-Myc13 phosphorylation
Extracts of MSX- and rapamycin-treated cells exhibit clearly distinguishable Gln3-Myc13 phosphorylation profiles, permitting us to test whether MSX and rapamycin inhibit tandem steps in a single regulatory pathway. In the best circumstance, treating cells with these inhibitors might generate the same effects as null mutations of the proteins they inhibit. MSX-treatment is thought to generate the signal that is received by and inhibits Tor1/2 function just as does rapamycin (32). Therefore, rapamycin-induced dephosphorylation of Gln3 should be downstream of and hence predominate over MSX-generated Gln3 phosphorylation.
Two experiments were performed to test this prediction. In the first experiment, MSX and rapamycin were added either alone or together and the cultures harvested after 30 min of incubation. The combination of inhibitors generated nearly the same result as MSX alone (Fig. 10A, lanes B-E), arguing that (i) the MSX-inhibited step was downstream of the one inhibited by rapamycin, (ii) the inhibited steps did not occur in tandem with the MSX-inhibited step being either the later or predominant of the two, or (iii) MSX somehow inhibited rapamycin action by preventing uptake or interfering with its inhibition of Tor1/2.
Figure 10.
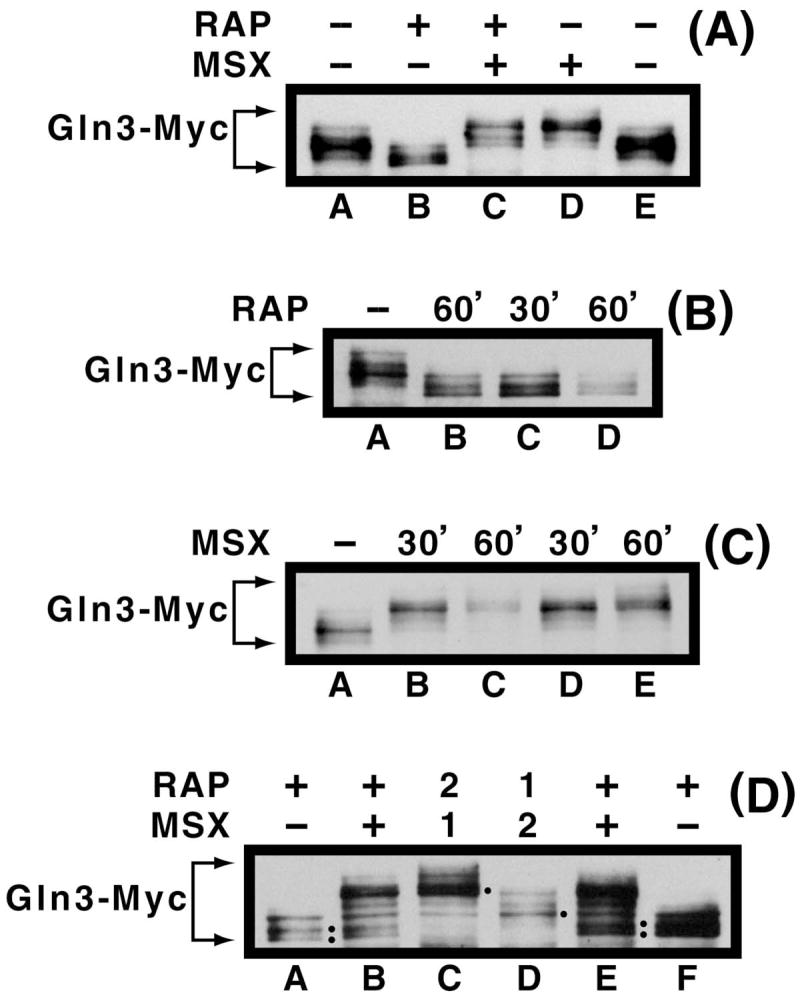
Gln3-Myc13 mobilities in extracts prepared following simultaneous or sequential treatment of urea-grown, wild type cells with MSX and rapamycin. In panel A, the inhibitors were added separately (lanes B, D) or together (lane C) and the cells incubated for 30 min. prior to harvest by filtration. Inhibitors were not added to cells from which extracts in lanes A and E were prepared. In panels B and C, only single inhibitors were added to the cultures. The duration of incubation in the presence of the inhibitor is indicated in min. (top of panel). In panel D, the inhibitors were added sequentially (lanes C and D) using the protocol described in the text. The numbers 1 and 2, at the top of the panel, indicate the order in which the inhibitors were added to the culture, as described in the text. For lanes A and F, cells were treated with only rapamycin. For lanes B and E, cells were treated separately with MSX or rapamycin and then separately harvested but frozen in the same microfuge tube as described for Fig. 3A. These samples were included as controls.
The second experiment consisted of treating cells sequentially with rapamycin and MSX. In the first phase, MSX was added to a log phase culture and following a 30 min. incubation, rapamycin was added. 30 min. later, the cells were harvested and Gln3-Myc13 phosphorylation assayed. In the second phase, the order of inhibitor addition was reversed. We could not perform the ordered addition experiment by transferring cells from a medium containing one inhibitor to medium containing the other, because merely transferring cells to a fresh sample of the same medium, with no other change at all, generates marked differences in Gln3-Myc13 localization (ref. 45, Fig. 1B).
Since, in these experiments, the first inhibitor added to the cells would be present for 60 min., it was necessary to assure that treating cells with MSX or rapamycin for 30 min. vs. 60 min. generated the same Gln3-Myc13 phosphorylation profiles. This was found to be the case, except that Gln3-Myc13 phosphorylation was a little greater at 60 min. of MSX-treatment than 30 min (Fig. 10B, C, lanes B–D; note greater mobility of minor species in Fig. 10C, lane C, E). In any case, we felt these control experiments were sufficiently positive to proceed. Two control extracts were electrophoresed on either side of samples from the ordered addition protocol: (i) cells treated with rapamycin alone, and (ii) a 1:1 mixture of cells that had been treated separately with rapamycin or MSX and frozen separately in the same tube as occurred for the experiment in Fig. 3A, lanes A and D. These control samples appear in Fig. 10D, lanes A, B, E, and F.
Results from the first phase of the ordered inhibitor addition experiment, i.e., MSX added before rapamycin, are shown in Fig. 10D, lane C. Gln3-Myc13 was highly phosphorylated and the two faster migrating, dephosphorylated species of Gln3-Myc13 characteristic of rapamycin-treated cells (two black dots in Fig. 10D, lanes A, E, F) were absent. In the second phase of the experiment, i.e., rapamycin was added before MSX, hyper-phosphorylated Gln3-Myc13 was still observed as was the continued absence of dephosphorylated Gln3-Myc13 species characteristic of rapamycin-treated cells (Fig. 10D, lane D). These results occurred in spite of the fact that Gln3-Myc13 had been dephosphorylated by rapamycin-treatment (Fig. 10B, lane C and Fig. 10D, lanes A, F) prior to MSX being added to the cells. In other words, Gln3-Myc13 was hyper-phosphorylated even though Tor1/2 kinase activities were inhibited by rapamycin. This result argued that Tor1/2 were not responsible for the MSX-induced increase in Gln3-Myc13 phosphorylation (Fig. 10D, lane D vs. A, F).
Although results of the ordered addition experiment were clear, they were not absolute, i.e., Gln3-Myc13 was not as extensively phosphorylated in the second phase of the experiment as when MSX was added before or in combination with rapamycin (Fig. 10D, lane D). Note that Gln3-Myc13 was more uniformly distributed between the bands in Fig. 10D, lane D than in lane C. The species in Fig. 10D, lane D that slightly predominated (black dot) was two species lower than the predominant pair of species in lane C (black dot). Also note as a point of reference that the uppermost species observed during rapamycin treatment alone co-migrates with the lowermost species observed after MSX-treatment (Fig. 3A, lanes A–D). In the first experiment (Fig. 10A), the effects of MSX clearly predominated over those of rapamycin, whereas in the second experiment (Fig. 10D) there was detectable additivity of the effects even though the MSX-generated Gln3-Myc13 species again predominated. In neither experiment were the data those expected if the proteins inhibited by rapamycin are downstream of the nitrogen excess signal whose generation is posited to be inhibited by MSX.
DISCUSSION
The above data demonstrate that MSX and rapamycin, though eliciting the same outcomes with respect to Gln3-Myc13 nuclear accumulation and NCR-sensitive transcription, generate opposite effects on Gln3-Myc13 phosphorylation, i.e., MSX increases it while rapamycin decreases it. The additive effects of the two inhibitors on Gln3-Myc13 phosphorylation favor them functioning non-tandemly in different pathways or in different branches of one pathway more than they support the current model positing them to function tandemly in a single pathway (32). Further, inhibitors oppositely affecting Gln3-Myc13 phosphorylation, but eliciting the same outcomes on its intracellular localization suggest that Gln3-Myc13 phosphorylation/dephosphorylation, detected thus far in this and the work of others, is likely associated with something other than determining Gln3 intracellular localization. This suggestion is also consistent with the lack of correlation observed between Gln3-Myc13 phosphorylation and intracellular localization in cells provided with various nitrogen sources (34).
We also showed that Gln3-Myc13 phosphorylation levels are regulated by at least three separate mechanisms: the first depends on the carbon regulatory kinase, Snf1, while the second is independent of it; MSX-induced phosphorylation occurs via the Snf1-independent mechanism. Finally, Gln3-Myc13 is dephosphorylated in response to rapamycin inhibition of Tor1,2. The existence of Snf1-dependent Gln3-Myc13 phosphorylation is not surprising as it had been observed earlier in response to carbon-starvation of ammonia-grown cells (33, 34). The novel observation of the present work is that carbon starvation also triggers Gln3-Myc13 phosphorylation in a snf1Δ. This phosphorylation level increases to even higher levels in the presence of wild type Snf1. However, the profile of Snf1-dependent and -independent phosphorylation responses differ. Snf1-independent phosphorylation appears to generate three characteristic Gln3-Myc13 species, whereas the Snf1-dependent Gln3-Myc13 species are more heterogeneous; appearing largely as a fainter, slower-mobility smear. This would be an expected result if the Snf1-independent mechanism possessed greater substrate specificity. However, given the number of phosphory-lated Gln3-Myc13 species we can detect, in addition to those in the smear that we can’t individually resolve, such an interpretation is probably speculative.
While our experiments demonstrate increased Gln3-Myc13 phosphorylation derives from at least two distinguishable regulatory pathways, they cannot identify the kinases directly responsible for it. The literature supports Snf1 and Tor1/2 as the most likely candidates: (i) both kinases interact with Gln3 in two-hybrid assays (16, 33) and (ii) both Tor1/2 and Snf1 phosphorylate Gln3 in vitro (16, 33). Consistent with Snf1 phosphorylating Gln3-Myc13 during carbon starvation is the correlation that Snf1 activity is activated by centrifugation (41), a characteristic also observed in our Snf1-dependent data (Fig. 8C). Concluding that Tor1/2 phosphorylate Gln3-Myc13 is more difficult. First, the data in Fig. 10D demonstrate that MSX induces Gln3-Myc13 phosphorylation in the presence of rapamycin which inactivates Tor1/2. Second, if Tor1/2 are responsible for Gln3-Myc13 phosphorylation, a dilemma arises in trying to reconcile current data with the earlier model of Tor regulation (9, 32). The dilemma arises from the fact that both MSX-treatment and carbon starvation of ammonia-grown cells (urea is also degraded solely to ammonia) are thought to generate nitrogen starvation, but yet unlike rapamycin-treatment, increase Gln3-Myc13 phosphorylation. According to the existing model, nitrogen starvation, MSX- and rapamycin-treatment, are all envisioned to inhibit Tor1/2 kinase activities which in turn should all result in dephosphorylation of Gln3-Myc13 (32). By this reasoning we can account for present data only by suggesting (i) Tor1/2 mediate Gln3 phosphorylation in their inactive form or (ii) Tor1/2 are not directly responsible for MSX- and/or nitrogen starvation-induced Gln3 phosphorylation. Although we do not favor it, one possibility that data in Fig. 10D do not eliminate is that Tor1/2 were responsible for the most highly phosphorylated species of Gln3-Myc13 in lane C (where Tor1/2 were not inhibited by rapamycin for the first 30 min.) that were missing in lane D.
The final dilemma generated by the above experiments is that MSX- and rapamycin-treatment, in our hands, elicit effects on Gln3-Myc13 phosphorylation opposite to those previously reported (32). Since the strains used here were the same as those used earlier (9, 32), we searched for differences in culture conditions. Although such differences were found, they do not affect the results obtained. Our failed attempts to rectify the differing observations notwithstanding, there is clearly one or more differences between present and earlier experiments that remain to be identified.
Another question that arose during this work was whether MSX-treatment elicited Gln3-Myc13 phosphorylation profiles similar to those that occur in response to nitrogen starvation as expected if MSX-treatment inhibits glutamine formation, the signal of excess nitrogen proposed earlier to be relayed to Tor1/2 (32). Our MSX-induced Gln3-Myc13 phosphorylation profiles share characteristics with profiles generated both by carbon and nitrogen starvation. To conclude the Gln3-Myc13 phosphorylation profile resembles that of nitrogen starvation, however, would require that MSX-treatment generates a more extreme case of nitrogen starvation than incubating cells in nitrogen free medium for 60 min. Although certainly not difficult to imagine, if this were the case, then one would also expect Gat1 to be accumulated in the nucleus following MSX-treatment, because like Gln3, Gat1-mediated transcription is NCR-sensitive. Furthermore, Gat1 has been proposed to be subject to the same phosphorylation/dephosphorylation regulatory mechanism as Gln3 (9). This expectation contrasts with the report that MSX does not elicit nuclear localization of Gat1 (32). On the other hand, MSX-elicited Gln3-Myc13 phosphorylation does possess a profile similar to the one seen in carbon-starved, wild type cells and identical to the one caused by carbon starvation of a snf1Δ mutant. This suggests MSX-treatment directly or indirectly triggers responses shared by those that occur with carbon-starvation.
Most importantly, the MSX data reported above argue that both phosphorylated and dephosphorylated forms of Gln3-Myc13 can be accumulated in the nucleus, a conclusion also reported in studies of the effects of carbon starvation on Gln3 regulation (33). These observations make it difficult to understand how data concerning Gln3 phosphorylation levels, that we and others have detected thus far, can be rectified with the current regulatory model. At the same time, we must hasten to emphasize that these difficulties would quickly disappear if the phosphorylated species detected so far are not the ones associated with nitrogen-dependent Gln3 regulation. Current data also prompt a new question, i.e., if phosphorylation levels we detect are not regulating Gln3 intracellular localization, then what is their function(s)? The importance of this question to future work is emphasized both by the variety of environmental perturbations that can trigger Gln3 phosphorylation and the number of regulatory systems that are involved in the process.
Finally, the data emphasize the importance of Snf1’s ability to influence Gln3 phosphorylation both in the presence of high glucose and during carbon starvation. The ramifications of this observation may extend to the technical design of phosphorylation/dephosphorylation experiments in general, especially those involving carbon-starvation or limitation. Centrifugation-mediated activation of Snf1 kinase was originally reported with respect to carbon regulation (41), but the above data suggest cell harvest methods could influence the data obtained with other proteins as well. Such artifacts appear to be avoided, or at least decreased, when cells are harvested by filtration rather than centrifugation.
Acknowledgments
We thank Dr. Michael Hall for strain TB123, Tim Higgins for preparing the artwork, and the UT Yeast Group for suggestions to improve the manuscript. This work was supported by NIH grant GM-35642.
References
- 1.Fingar DC, Blenis J. Oncogene. 2004;23:3151–3171. doi: 10.1038/sj.onc.1207542. [DOI] [PubMed] [Google Scholar]
- 2.Neuhaus P, Klupp J, Langrehr JM. Liver Transplantation. 2001;7:473–484. doi: 10.1053/jlts.2001.24645. [DOI] [PubMed] [Google Scholar]
- 3.Majumder PK, Febbo PG, Bikoff R, Berger R, Xue Q, McMahon LM, Manola J, Brugarolas J, McDonnell TJ, Golub TR, Loda M, Lane HA, Sellers WR. Nat Med. 2004;10:594–601. doi: 10.1038/nm1052. [DOI] [PubMed] [Google Scholar]
- 4.Neshat MS, Mellinghoff IK, Tran C, Stiles B, Thomas G, Petersen R, Frost P, Gibbons JJ, Wu H, Sawyers CL. Proc Natl Acad Sci USA. 2001;98:10314–10319. doi: 10.1073/pnas.171076798. [DOI] [PMC free article] [PubMed] [Google Scholar]
- 5.Koltin Y, Faucette L, Bergsma DJ, Levy MA, Cafferkey R, Koser PL, Johnson RK, Livi GP. Mol Cell Biol. 1991;11:1718–1723. doi: 10.1128/mcb.11.3.1718. [DOI] [PMC free article] [PubMed] [Google Scholar]
- 6.Heitman J, Movva NR, Hiestand PC, Hall MN. Proc Natl Acad Sci USA. 1991;88:1948–1952. doi: 10.1073/pnas.88.5.1948. [DOI] [PMC free article] [PubMed] [Google Scholar]
- 7.Di Como CJ, Arndt KT. Genes Dev. 1996;10:1904–1916. doi: 10.1101/gad.10.15.1904. [DOI] [PubMed] [Google Scholar]
- 8.Jiang Y, Broach JR. EMBO J. 1999;18:2782–2792. doi: 10.1093/emboj/18.10.2782. [DOI] [PMC free article] [PubMed] [Google Scholar]
- 9.Beck T, Hall MN. Nature. 1999;402:689–692. doi: 10.1038/45287. [DOI] [PubMed] [Google Scholar]
- 10.Shamji AF, Kuruvilla FG, Schreiber SL. Curr Biol. 2000;10:1574–1581. doi: 10.1016/s0960-9822(00)00866-6. [DOI] [PubMed] [Google Scholar]
- 11.Jacinto E, Guo B, Arndt KT, Schmelzle T, Hall MN. Mol Cell. 2001;8:1017–1026. doi: 10.1016/s1097-2765(01)00386-0. [DOI] [PubMed] [Google Scholar]
- 12.Cherkasova VA, Hinnebusch AG. Genes Dev. 2003;17:859–872. doi: 10.1101/gad.1069003. [DOI] [PMC free article] [PubMed] [Google Scholar]
- 13.Duvel K, Santhanam A, Garrett S, Schneper L, Broach JR. Mol Cell. 2003;11:1467–1478. doi: 10.1016/s1097-2765(03)00228-4. [DOI] [PubMed] [Google Scholar]
- 14.Wang H, Wang X, Jiang Y. Mol Biol Cell. 2003;14:4342–4351. doi: 10.1091/mbc.E03-02-0072. [DOI] [PMC free article] [PubMed] [Google Scholar]
- 15.Santhanam A, Hartley A, Duvel K, Broach JR, Garrett S. Eukaryotic Cell. 2004;3:1261–1271. doi: 10.1128/EC.3.5.1261-1271.2004. [DOI] [PMC free article] [PubMed] [Google Scholar]
- 15a.Zheng Y, Jiang Y. Mol Biol Cell. 2005 doi: 10.1091/mbc.E04-09-0797. [DOI] [PMC free article] [PubMed] [Google Scholar]
- 16.Bertram PG, Choi JH, Carvalho J, Ai W, Zeng C, Chan TF, Zheng XFS. J Biol Chem. 2000;275:35727–35733. doi: 10.1074/jbc.M004235200. [DOI] [PubMed] [Google Scholar]
- 17.Rohde JR, Campbell S, Zurita-Martinez SA, Cutler NS, Ashe M, Cardenas ME. Mol Cell Biol. 2004;24:8332–8341. doi: 10.1128/MCB.24.19.8332-8341.2004. [DOI] [PMC free article] [PubMed] [Google Scholar]
- 18.Shirra MK, Rogers SE, Alexander DE, Arndt KM. Genetics 2005 [Google Scholar]
- 19.Luke MM, Della Seta F, Di Como CJ, Sugimoto H, Kobayashi R, Arndt KT. Mol Cell Biol. 1996;16:2744–2755. doi: 10.1128/mcb.16.6.2744. [DOI] [PMC free article] [PubMed] [Google Scholar]
- 20.Das BK, Xia L, Palandjian L, Gozani O, Chyung Y, Reed R. Mol Cell Biol. 1999;19:6796–6802. doi: 10.1128/mcb.19.10.6796. [DOI] [PMC free article] [PubMed] [Google Scholar]
- 21.Loewith R, Jacinto E, Wullschleger S, Lorberg A, Crespo JL, Bonenfant D, Oppliger W, Jenoe P, Hall MN. Mol Cell. 2002;10:457–468. doi: 10.1016/s1097-2765(02)00636-6. [DOI] [PubMed] [Google Scholar]
- 22.Wedaman KP, Reinke A, Anderson S, Yates J, 3rd, McCaffery JM, Powers T. Mol Biol Cell. 2003;14:1204–1220. doi: 10.1091/mbc.E02-09-0609. [DOI] [PMC free article] [PubMed] [Google Scholar]
- 23.Chen EJ, Kaiser CA. J Cell Biol. 2003;161:333–347. doi: 10.1083/jcb.200210141. [DOI] [PMC free article] [PubMed] [Google Scholar]
- 24.Hoffman-Bang J. Mol Biotechnol. 1999;12:35–73. doi: 10.1385/MB:12:1:35. [DOI] [PubMed] [Google Scholar]
- 25.ter Schure EG, van Riel NA, Verrips CT. FEMS Microbiol Rev. 2000;24:67–83. doi: 10.1111/j.1574-6976.2000.tb00533.x. [DOI] [PubMed] [Google Scholar]
- 26.Cooper TG. FEMS Microboil Rev. 2002;26:223–238. doi: 10.1111/j.1574-6976.2002.tb00612.x. [DOI] [PMC free article] [PubMed] [Google Scholar]
- 27.Cooper TG. In: Mycota III, Marzluf G, Bambrl R, editors. Springer Verlag; Berlin, Heidelberg: 1996. pp. 139–169. [Google Scholar]
- 28.Cox KH, Rai R, Distler M, Daugherty JR, Coffman JA, Cooper TG. J Biol Chem. 2000;275:17611–1768. doi: 10.1074/jbc.M001648200. [DOI] [PMC free article] [PubMed] [Google Scholar]
- 29.Hardwick JS, Kuruvilla FG, Tong JK, Shamji AF, Schreiber SL. Proc Natl Acad Sci USA. 1999;96:14866–14870. doi: 10.1073/pnas.96.26.14866. [DOI] [PMC free article] [PubMed] [Google Scholar]
- 30.Cardenas ME, Cutler NS, Lorenz MC, Di Como CJ, Heitman J. Genes Dev. 1999;13:3271–3279. doi: 10.1101/gad.13.24.3271. [DOI] [PMC free article] [PubMed] [Google Scholar]
- 31.Thomas G, Sabatini DM, Hall MN, editors. Current Topics in Microbiology and Immunology. Vol. 279. Springer; 2004. TOR Target of Rapamycin. [Google Scholar]
- 32.Crespo JL, Powers T, Fowler B, Hall MN. Proc Natl Acad Sci USA. 2002;99:6784–6789. doi: 10.1073/pnas.102687599. [DOI] [PMC free article] [PubMed] [Google Scholar]
- 33.Bertram PG, Choi JH, Carvalho J, Chan TF, Ai W, Zheng XF. Mol Cell Biol. 2002;22:1246–1252. doi: 10.1128/MCB.22.4.1246-1252.2002. [DOI] [PMC free article] [PubMed] [Google Scholar]
- 34.Cox KH, Kulkarni A, Tate JJ, Cooper TG. J Biol Chem. 2004;279:10270–10278. doi: 10.1074/jbc.M312023200. [DOI] [PMC free article] [PubMed] [Google Scholar]
- 35.Cox KH, Tate JJ, Cooper TG. J Biol Chem. 2002;277:37559–37566. doi: 10.1074/jbc.M204879200. [DOI] [PMC free article] [PubMed] [Google Scholar]
- 36.Sherman F. Meth In Enzymol. 1991;194:3–21. doi: 10.1016/0076-6879(91)94004-v. [DOI] [PubMed] [Google Scholar]
- 37.Schmitt ME, Brown TA, Trumpower BL. Nucleic Acids Res. 1990;18:3091–3092. doi: 10.1093/nar/18.10.3091. [DOI] [PMC free article] [PubMed] [Google Scholar]
- 38.Cox KH, Pinchak AB, Cooper TG. Yeast. 1999;15:703–713. doi: 10.1002/(SICI)1097-0061(19990615)15:8<703::AID-YEA413>3.0.CO;2-Z. [DOI] [PubMed] [Google Scholar]
- 39.Tate JJ, Cox KH, Rai R, Cooper TG. J Biol Chem. 2002;277:20477–82. doi: 10.1074/jbc.M200962200. [DOI] [PMC free article] [PubMed] [Google Scholar]
- 40.Tate JJ, Cooper TG. J Biol Chem. 2003;278:36924–36933. doi: 10.1074/jbc.M301829200. [DOI] [PMC free article] [PubMed] [Google Scholar]
- 41.Wilson WA, Hawley SA, Hardie DG. Curr Biol. 1996;6:1426–1434. doi: 10.1016/s0960-9822(96)00747-6. [DOI] [PubMed] [Google Scholar]
- 42.Schuller HJ. Curr Genet. 2003;43:139–160. doi: 10.1007/s00294-003-0381-8. [DOI] [PubMed] [Google Scholar]
- 43.Kuchin S, Vyas VK, Carlson M. Biochem Soc Trans. 2003;31:175–177. doi: 10.1042/bst0310175. [DOI] [PubMed] [Google Scholar]
- 44.Carlson M. Curr Opin Microbiol. 1999;2:202–207. doi: 10.1016/S1369-5274(99)80035-6. [DOI] [PubMed] [Google Scholar]
- 45.Cox KH, Tate JJ, Cooper TG. J Biol Chem. 2004;279:19294–19301. doi: 10.1074/jbc.M309240200. [DOI] [PMC free article] [PubMed] [Google Scholar]