

SUMMARY
Phage T4 protects its DNA from the two gene encoded gmrS/gmrD (glucose modified hydroxymethylcytosine (gHMC) restriction endonuclease) (CT), of pathogenic E. coli CT596, by injecting several hundred copies of the 76 amino acid residue nuclease inhibitor, IPI*, into the infected host. Here, the three-dimensional solution structure of mature IPI* is reported as determined by nuclear magnetic resonance (NMR) techniques using 1290 experimental NOE and dipolar coupling constraints (∼17 constraints/residue). Close examination of this oblate-shaped protein structure reveals a novel fold consisting of two small β-sheets (β1: B1, B2; β2: B3-B5), flanked at the N- and C-termini by alpha helices (H1 & H2). Such a fold is very compact in shape, and allows ejection of IPI* through the narrow 30Å portal and tail tube apertures of the virion without unfolding. Structural and dynamic measurements identify an exposed hydrophobic knob that is a putative gmrS/gmrD binding site. A single gene from the uropathogenic E. coli UT189, which codes for a gmrS/gmrD-like fusion protein (∼90% identity to the heterodimeric CT enzyme) has evolved IPI* inhibitor immunity. Analysis of the gmrS/gmrD restriction endonuclease enzyme family and its IPI* family phage antagonists reveals an evolutionary pathway that has elaborated a surprisingly diverse and specifically fitted set of co-evolving attack and defense structures.
Keywords: Bacteriophage T4, NMR, restriction endonuclease inhibitor
INTRODUCTION
Host-viral exclusion and anti-exclusion mechanisms co-evolve competitively. Among numerous strategies to prevent phage infection, bacteria synthesize restriction enzymes that digest entering phage DNAs while bacteriophages deploy counterstrategies to circumvent such enzymes. Remarkable specificity is displayed by the dispensable internal protein I (ip1) gene that is required for T4 phage to infect successfully the pathogenic Escherichia coli isolate CT596 1. In this host, the injected T4 DNA degrades into acid-soluble fragments only in the absence of the injected mature gene product IPI*. An E. coli CT596 genomic library identified adjacent glucose modified restriction genes gmrS (942bp) and gmrD (708bp) that are necessary and sufficient to confer upon a host the ability to exclude infection by T4 ip1- and other glucosyl-hydroxymethycytosine (g-HMC) T-evens lacking the ip1 gene 2. However, the clones allow infection by phages with non-glucosylated cytosine DNA that lack the ip1 gene (e.g. lambda, T7, RB49). Thus, g-HMC phages C16 and RB69 that contain the ip1 gene grow on the clone, whereas g-HMC phages such as T6, T2, RB15, and RB70 (and T4 ip1- mutants) that lack the ip1 gene do not. Moreover a plasmid expressing the mature, encapsidated ip1 gene product, IPI*, allows T4 ip1- and the other phages lacking ip1 to grow on E. coli strains carrying the cloned gmrS/gmrD genes; whereas, an isogenic plasmid expressing the mutant ip1- product, IPI-* (A40T, E53K) does not 2.
Two proteins, GmrS (36kDa) and GmrD (27kDa), encoded by the gmrS/gmrD genes were purified and found to be inactive separately, but together degraded several different g-HMC modified DNAs (T4, T2 and T6) to low molecular mass products (<500bp); whereas, no activity was observed against non-modified DNA including unmodified T4 cytosine (C) or non-glucosylated T4 HMC DNA 3. The enzyme activity could be inhibited by IPI*, which binds to the GmrSD proteins. Therefore both in vivo and in vitro studies show that IPI* specifically inhibits the activity of GmrSD to prevent the g-HMC T4 DNA from being digested.
The ip1 gene locus has been investigated in the genomes of a number of g-HMC T-even phages related to T4 4. Five new ORFs, ip5 to ip9, were sequenced within the same flanking sequences 57.B and ORF2 as ip1. Despite the overall sequence divergence of these putative ip1 homolog genes, they all encode for 11-19 amino acid residues in the N-terminal region, which has a remarkably conserved signature sequence. It is known that this consensus capsid targeting sequence (CTS) allows incorporation of an attached protein into the phage head 5. The CTS is then cleaved from the precursor protein distal to an IXE or LXE amino acid sequence by the gene 21 prohead maturation protease 5. This allows the processed mature protein to be injected together with the DNA into an infected host. A striking characteristic of the ip1 gene locus among these phages is its unusual degree of gene expansion and genetic polymorphism in comparison to the highly conserved structural genes of these phages. For example, the ip1 locus of phages RB70, T6, T2, K3, and RB15 contains ip5, ip5+ip6, ip5+ip7, ip7+ip8+ip9 and ip5+ip7+ip8+ip9, respectively, all genes bearing the signature CTS N-terminal motif 4. These results suggest that many new ip1 genes and combinations of these remain to be identified.
The diversity of the ip1 locus genes may be evolutionarily linked to the diverse sugar-modifications of the 100% HMC DNA containing T-even phages 6, 7. Thus, phage T4 completely glucosylates its HMC DNA in 30% α-linkage and 70% β-linkage; T2 in 70% α-linkage and 5% β-linkage in gentiobiose form (a second β-glucose bound to a pre-existing α-linkage); and T6 has 3% α-linkage and 72% gentiobiose DNA. T-even phages modify their DNAs with glucosylated HMC (glc-HMC) to avoid degradation by type I, II and III restriction endonucleases that generally are incapable of digesting such DNAs (summarized in Figure 7). GmrSD is the first discovered modification-dependent restriction (MDR) endonuclease (type IV) that specifically digests sugar-modified HMC DNA 3. Different sugar modifications and distributions on HMC residues could account for the selection of other GmrSD family members in the process of the co-evolution between T-even phages and host bacteria. Homology searches show that the gmrS/gmrD genes display a remarkable degree of homology with numerous ORFs of unknown function in diverse bacteria. Chief among these, uropathogenic E. coli (UPEC) UTI89 and avian pathogenic E. coli (APEC) (99% identity to UPEC) contain a single ORF that has 89% and 93% identity with gmrS and gmrD of CT596, respectively, strongly suggesting that they are members of the GmrSD restriction endonuclease enzyme family.
Figure 7.
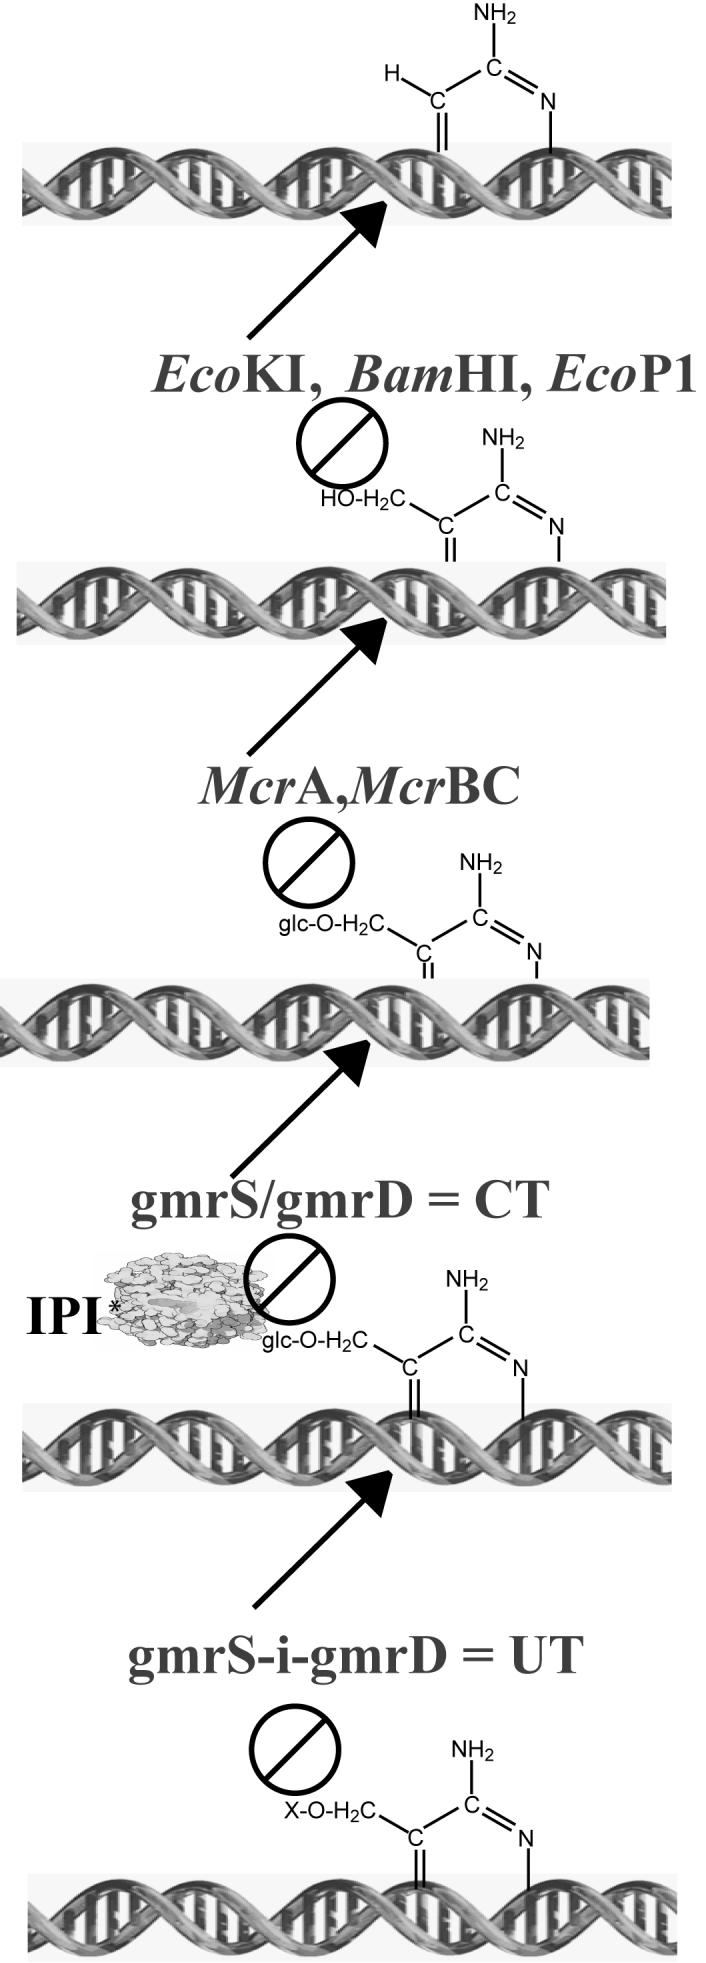
Evolution of the T-even phage IPI* inhibitors and DNA modifications in response to type IV DNA modification dependent restriction endonucleases. Bacterial encoded type I, II, and III (e.g. E. coli K12, BamHI, P1) restriction endonucleases protect against infecting phage DNAs containing cytosine (first line). Many of these enzymes are blocked by 5-methyl or 5-hydroxymethylcytosine (HMC) DNA modification (line 2). The McrA and McrBC type IV modification dependent restriction endonucleases of E. coli specifically attack HMC modified DNAs, but are inhibited by the glucosylation of HMC (glc-HMC) (line 3). The heterodimeric CT (gmr (glucose modified restriction) enzyme of E. coli CT596 hydrolyzes only the sugar modified (glc)-HMC containing DNAs of a number of T-even phages, but its activity is inhibited by the encapsidated phage IPI* protein injected with the DNA (line 4). The UT enzyme comprising the S and D subunits in a single polypeptide chain is immune to IPI*, but is blocked by further unknown modifications to the DNAs or internal proteins of some of the T-even phages (line 5).
How the ip1 gene locus and gmrS/gmrD gene products interact with each other and with sugar-modified HMC DNAs of T-even phages is unclear. IPI* (and the other ip1 gene locus products) display no significant homology with any database protein. Therefore in this study we applied NMR spectroscopy to determine the three dimensional structure of IPI* in order to understand both evolution and the structure/function relationship of these anti-restriction proteins. Here we report (1) the novel protein fold of IPI* that reveals regions likely involved in interaction with the GmrSD enzyme; (2) how on the basis of this structure an amino acid replacement in IPI* leads to loss of function and absence of the protein from the virion; and (3) how, unlike the E. coli CT596 heterodimeric subunit CT enzyme, the closely related (∼90% sequence identity) GmrSD UT enzyme from E. coli UT189 has evolved a single polypeptide structure that renders it immune to IPI*.
RESULTS
NMR resonance assignments and secondary structure of IPI*
NMR experiments were performed on a recombinant form of IPI* as necessary to sequence specifically assign its 1H, 13C, and 15N resonances. Initial 2D 1H-15N - usually we specify this as HSQC heteronuclear single quantum coherence (HSQC) spectra - were collected in a pH range from 7.5 to 4.5. While most of the HSQC correlations were not perturbed or shifted very slightly with decreasing pH, twelve peaks appeared, and no peaks weakened. Since lowering the pH was beneficial and did not cause large changes in chemical shifts, as measured in the HSQC spectrum, it was concluded that no global structural changes occurred, and the remainder of the NMR studies were completed at pH 4.8. The 2D 1H-15N HSQC experiment performed under these conditions revealed a well-dispersed spectrum indicative of a highly structured protein (Figure 1A). This was confirmed with 1H-15N heteronuclear NOE data, where only six residues in the interior of the protein were found to have low NOE values (NOE<0.68) (Figure 1B). In order to determine the solution structure of IPI*, it was then necessary to unambiguously assign the resonances a priori using 2D, 3D, and 4D NMR experiments (Table 1).
Figure 1.
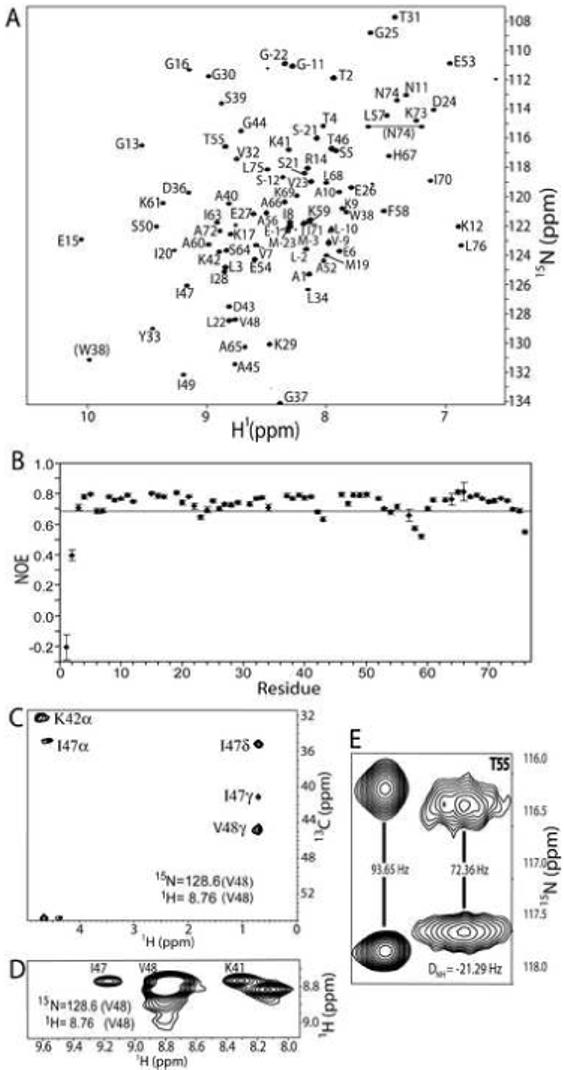
(A) 2D 1H-15N HSQC of IPI* at 600 MHz (1H) with residue assignments included. Backbone 1H-15N correlations are labeled sequence-specifically, and correlations connected by the horizontal line correspond to asparagine side-chain NH2 groups. (B) A graph representing data obtained from a 2D 15N-{1H} heteronuclear NOESY experiment shows that A1, T2, V23, D43, L57, F58, K59, and L76 all have significant fast-motion contributions (NOE<0.68; residues below the horizontal line in graph). A plane from the 4D 13C, 15N-edited NOESY-HSQC (C) and a 3D 15N-edited NOESY (D) show NOE correlations of the amide hydrogen of V48 to sequential and long-range resonances. In particular, NOE correlations of HαHN (i, i+1), HαHN (K42, V48), HNHN (K41, V48) are visible. The presence of a strong HαHN (i, i+1) resonance and strong long-range resonances is indicative of a residue in the middle of a beta sheet. (E) A representative region of the 2D 1H-15N HSQC IPAP NMR spectra used to measure dipolar coupling data (RDCs). This region illustrates splitting of T55. Dipolar couplings were determined by comparing the splitting in the presence (right) or absence (left) of the aligning acrylamide media.
Table 1.
Parameters for NMR Experiments 1
| Parameters 2 |
|||||
|---|---|---|---|---|---|
| experiment | Dim | Nuc | time pts | freq pts | Acq time (ms) |
| 2D 1H, 15N fast HSQC | t1 | 15N | 256 | 512 | 20.5 |
| t2 | 1H | 1024 | 2048 | 79.9 | |
| 3D 15N -edited HNCA | t1 | 15N | 60 | 128 | 20.5 |
| t2 | 13C | 128 | 256 | 12.4 | |
| t3 | 1H | 1024 | 2048 | 46.0 | |
| 3D 15N -edited | t1 | 1H | 180 | 512 | 4.5 |
| NOESY-HSQC 3 | t2 | 15N | 80 | 160 | 19.3 |
| t3 | 1H | 1024 | 2048 | 46.0 | |
| 3D 15N, 15N -edited | t1 | 1H | 42 | 128 | 19.2 |
| HMQC-NOESY-HSQC | t2 | 15N | 42 | 128 | 19.3 |
| t3 | 1H | 1024 | 2048 | 46.0 | |
| 3D CBCA(CO)NH | t1 | 13C 4 | 128 | 256 | 3.3 |
| t2 | 15N | 40 | 128 | 8.6 | |
| t3 | 1H | 1024 | 2048 | 91.8 | |
| 3D HNCACB | t1 | 13C | 126 | 256 | 5.0 |
| t2 | 15N | 60 | 128 | 20.5 | |
| t3 | 1H | 1024 | 2048 | 32.0 | |
| 3D HNCO | t1 | 13C 5 | 128 | 256 | 11.3 |
| t2 | 15N | 40 | 128 | 8.6 | |
| t3 | 1H | 1024 | 2048 | 91.8 | |
| 3D H(CCO)NH | t1 | 1H | 128 | 512 | 5.2 |
| t2 | 15N | 44 | 128 | 22.8 | |
| t3 | 1H | 1024 | 2048 | 106.5 | |
| 3D C(CO)NH | t1 | 13C 4 | 110 | 512 | 5.5 |
| t2 | 15N | 64 | 128 | 25.7 | |
| t3 | 1H | 1024 | 2048 | 61.1 | |
| 4D 13C, 15N-edited 6 | t1 | 13C 7 | 36 | 128 | 13.8 |
| NOESY-HSQC | t2 | 1H | 128 | 256 | 6.4 |
| t3 | 15N | 34 | 64 | 5.7 | |
| t4 | 1H | 512 | 1024 | 61.1 | |
| 4D 13C, 13C-edited 6 | t1 | 13C 4 | 36 | 64 | 13.8 |
| NOESY-HSQC | t2 | 13C 4 | 36 | 64 | 13.8 |
| t3 | 1H | 128 | 256 | 7.3 | |
| t4 | 1H | 1024 | 2048 | 71.3 | |
Data were collected in H2O at 37 °C at 800.27 MHz for 1H except for the H(CCO)NH, C(CO)NH, 4D NOESY experiments, and dynamic experiments, which were collected at 600.13 MHz for 1H.
The number of points in the time domain is complex. The number of points in the frequency domain is real. The carrier frequency is 4.658 and 118.0 ppm for 1H and 15N, respectively, unless otherwise stated.
The NOE mixing time was 150 ms.
The 13C carrier position was set at 43.78 ppm.
The 13C carrier position was set at 173.78 ppm.
The NOE mixing time was 130 ms.
The 13C carrier position was set at 40.78 ppm.
The mature form of IPI*, studied here, contains 76 residues, of which two are proline residues. Of the 74 residues expected to be observed in the HSQC spectrum, 72 were present (Figure 1A). Two residues (H62 and G35) are absent due to exchange-broadening. The amide of the side-chain of W38, along with the side chain of N74, is visible in the HSQC (indicated by parentheses); however, the side-chain 1H-15N resonances for N11 were not present. Representative long-range resonances indicative of β-sheet structures and dipolar couplings are shown in Figures 1C-1E. Overall, all of the observable 1H, 13C, and 15N resonances of IPI* were fully assigned unambiguously using a standard combination of multidimensional heteronuclear NMR experiments (Table 1) and deposited in the BioMagResBank (accession number: 15438).
Nuclear Overhauser effect (NOE) data, chemical shift data, and hydrogen exchange data indicate that IPI* has many regions of defined secondary structure (Figure 2). Chief among these are two long alpha helical regions extending from residues 3 to 10 (helix 1) and from residues 65 to 76 (helix 2). These two N- and C-terminal helices flank two small β-sheets (β1 and β2). The first of these, β1, is a small two-stranded sheet comprising two strands (B1, residues 19-21; B2, residues 26-28) separated by a Type 1 β-turn (T1; residues 22-25). The second β-sheet, β2, has three β-strands (B3, residues 38-42; B4, residues 46-50; and B5, residues 60-63) with B3 and B4 separated by a type I β-turn (T2; residues 43-45). Lastly, IPI* has several loops including those connecting helix 1 to β1 (Loop 1; residues 11-18), β1 to β2 (Loop 2; residues 29-37) and a third loop (Loop 3; residues 51-59) that connects strands B4 and B5 of the second β-sheet (β2). Representative NOE data (Figures 1 & 3) between strands B3 and B4 of IPI* are illustrated and are typical long-range connectivities observed in an antiparallel β-sheet. Likewise, hydrogen exchange rate data indicates that residues in the helical and β-sheet regions of IPI*, which are expected to be involved in hydrogen bonds, do indeed exchange more slowly than residues in loops or extended regions of the protein, further validating the regions of secondary structure and β-strand alignment determined for IPI* by NMR (Figures 2 and 3).
Figure 2.
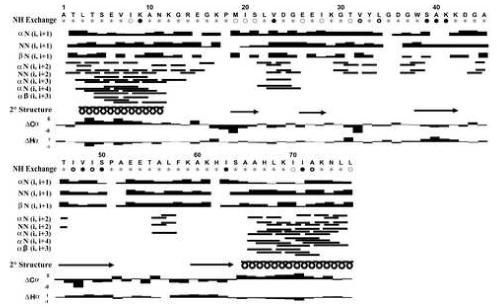
Secondary structure of IP1. Circles indicate relative amide hydrogen exchange rates at 37°C as determined using 2D 1H-15N HSQC spectra with stars (T<0.125h) and open circles (0.125h <T<0.5 h) arbitrarily referred to as fast exchanging amide protons. Residues with partially filled in circles are arbitrarily referred to as medium exchanging amide protons (0.5<T<1 h). Residues with solid circles (T>4 h) are arbitrarily referred to as slowly exchanging amide protons. The NOE correlations were determined from 3D 15N-edited NOESY-HSQC, 4D 13C, 15N-edited NOESY, and 4D 13C, 13C-edited NOESY at 37°C. The height of the bar indicated the strength of the NOE (strong, medium, medium-weak, weak, or very weak). Deviations in the 13Cα and 1Hα chemical shift from those of a random coil are illustrated such that regions of contiguous upfield-shifted 13Cα chemical shifts (positive values) and downfield-shifted 1Hα chemical shifts (negative values) are indicative of helical regions. Likewise, regions of contiguous downfield-shifted 13Cα chemical shifts (negative values) and upfield-shifted 1Hα chemical shifts (positive values) are indicative of regions of β-strand. The secondary structure is represented by α-helices (spirals), β-strands (arrows), turns (crosses), loops and flexible regions (no symbols), as indicated under the appropriate residues in the sequence of IPI*.
Figure 3.
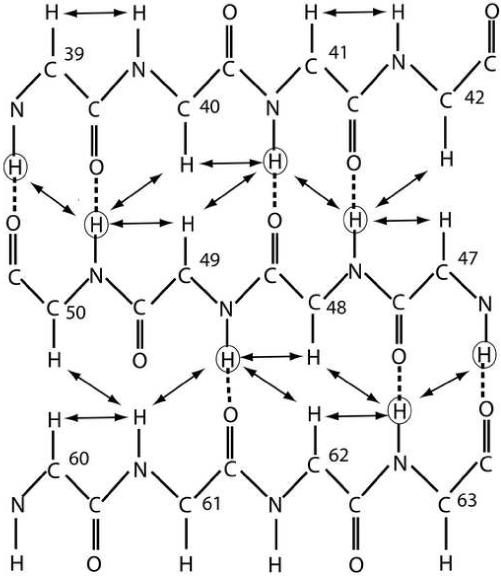
Schematic of the 3-strand antiparallel beta sheet. Unambiguous NOEs are marked by solid arrows. Circled hydrogen atoms are those involved in slow exchange with the solution, and dotted lines represent hydrogen bonds.
3D structure calculations for IPI*
A total of 1244 distance constraints were used in the structure calculation of IPI* including 180 intraresidue, 389 sequential, 301 medium-range, 398 long-range, and 46 hydrogen bond constraints. In addition, 85 dihedral constraints (Φ and Ψ) and 55 dipolar coupling constraints were used for a total of 1384 constraints. NOE correlations were assigned on the basis of 1H, 13C, and 15N backbone and side chain chemical shift assignments, and all NOE-based distance constraints used in the structure calculation were checked for their reciprocal correlation. Some degeneracy in chemical shift assignments made it difficult, in some cases, to assign NOE correlations using 3D NOE spectroscopy (NOESY) data alone. We therefore confirmed all of the NOE assignments using 4D 13C, 15N-edited NOESY-HSQC and 4D 13C, 13C-edited NOESY data sets to resolve ambiguities and provide unambiguous NOE assignments. Additional NOE correlations could then be confidently included in an iterative manner using preliminary structural models in which only unambiguous data was used initially. Likewise, we incorporated long-range HN-N residual dipolar coupling (RDC) constraints into the structure calculations throughout the entire protein to supplement the short-range NOE-derived constraints (<6 Å). Typical dipolar coupling data collected for IPI* is illustrated in Figure 1E, and RDC constraints were included for more than two-thirds of the residues, including a large number in loops and extended regions for which NOE constraints were minimally observed.
A family of the best 20 structures of IPI* is illustrated in Figure 4 with none of these structures having a dihedral violation greater than 5° or a distance violation greater than 0.40 Å. The structures agree well with one another, with a backbone RMSD of 0.47 for regions of secondary structure and well-defined loops, and an RMSD of 0.56 for all heavy atoms. If all residues are included in the RMSD calculation, including residues in poorly defined loops (i.e. residues 12-17 and 33-38), then the backbone RMSD drops to 0.74. On average, the family of structures is of high quality since 95.3% of residues in the 20 structures are in the most favorable and additionally allowed regions of the Ramachandran plot, with the best structure having 96.9% in the most favorable and additionally allowed regions. Additional structural parameters were assessed by the computer program PROCHECK, and the family of twenty structures is comparable with that of a 2Å X-ray crystal structure with on average about 10 bad contacts per 100 residues. Although hydrogen bonds were partially derived experimentally from amide exchange data, a family of structures that did not include hydrogen bond constraints was calculated to ensure the validity of incorporating these constraints. The pairwise RMSD between the average structures calculated with and without hydrogen bonds was 0.47 Å, indicating these constraints do not perturb the structure. Lastly, the quality of the ensemble of structures was evaluated using the long-range dipolar coupling constraints (i.e. the Q-factor). In structures with dipolar couplings, the Q-factor was calculated to be 0.24 by omitting a randomly selected subset set of the JNH data (10%). This Q-factor is a significant improvement from the Q=0.35 value, which was calculated when no dipolar couplings were included in the structure calculation and further validates the accuracy of the structure of IPI*.
Figure 4.
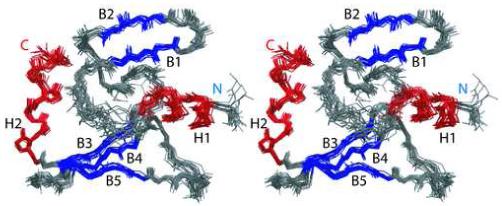
Stereoview of the 20 lowest energy structures of IPI*. Helices are colored red, beta strands are colored blue, turns and loops and flexible regions are colored gray.
IPI* represents a novel 3-dimensional fold
IPI* folds into a compact oblate ellipse that is roughly 30 Å × 30 Å × 15 Å with about half the residues in the protein involved in defined secondary structure (Figure 5). At the N-terminus, the hydrophobic face (L3, T4, V7, and I8) of the first amphipathic helix (H1) packs into Ala-52 and perhaps Phe-58 of Loop 3; however, much of loop 3 has fast timescale backbone dynamics (i.e. L57 to K59) that may compromise the overall stability of this small hydrophobic core (Fig. 6). Numerous long-range NOE constraints define a second, much larger hydrophobic core. Specifically, this core comprises residues from the hydrophobic face of helix 2 (L68, I71, and L75), the second β-sheet (W38, A40, I47, I49, and I63), loop 2 (T31, V32, and L34) and the first and last residues of the first β-sheet (M19, I28), respectively (Figure 6). Helix 2 also displays an amphipathic character, with one side of the helix made up almost exclusively of isoleucine and leucine residues, while the other side contains mostly charged or polar residues. The hydrophobic side of helix 2 packs onto the face of the second β-sheet and against one end of the first β-sheet; furthermore, residues from the loop connecting the two β-sheets (loop 2) provide a cap for this relatively extensive hydrophobic core. Because it is generally recognized that hydrophobic interactions represent the major factor stabilizing folded structures of proteins 8, 9, this relatively extensive hydrophobic core, for such a small protein, could provide an explanation for why IPI* is so stable in solution for such an extended period of time.
Figure 5.
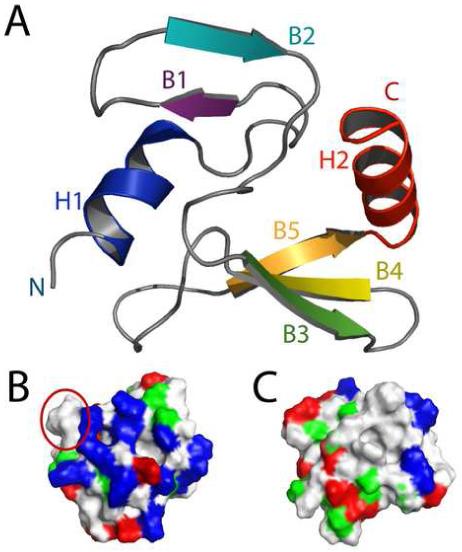
NMR solution structure of IPI*. (A) Ribbon diagram of the lowest-energy structure of IPI*. (B) and (C) The electrostatic surface potential of IP1. Electronegative (acidic) regions are colored red, electropositive (basic) regions are colored blue, uncharged regions are colored white and polar group residues are colored green. In (B), exposed hydrophobic patch residues 55-58 are circled in red.
Figure 6.
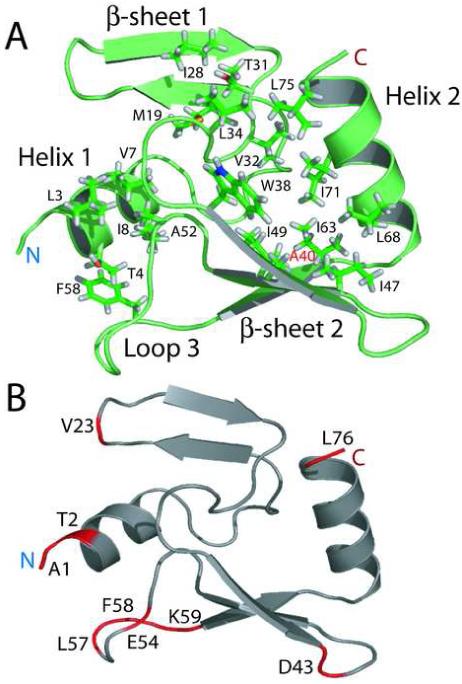
Hydrophobic residues involved in the unique fold of IPI*. (A) IPI* maintains its fold through interactions within a large hydrophobic fold. Residues included in this hydrophobic pocket are L3, T4, V7, and I8 on helix 1, M19 and I28 on the first β-sheet, T31, V32, and L34 in loop 2, W38, A40, I47, I49, and I63 in the second β-sheet, A52 and F58 in the loop 3, and L68, I71, and L75 in helix 2. Labeled in red is residue A40, where an A40T substitution eliminates IPI* structure and inhibitor function. (B) Ribbon diagram illustrating residues (in red) that exhibit fast time-scale motions. Several of the residues with significant fast-motion contributions are located in loop 3.
The surface of IPI* is relatively hydrophilic on one face of the oblate ellipse with the other face having a small hydrophobic patch (Figs. 5B, 5C). In fact, IPI* has a total of 13 positively charged residues with 11 of these 13 residues (K9, K12, R14, K17, K29, K59, K61, H62, H67, K69, K73) located on the hydrophilic basic side of IPI* (Fig. 5B); whereas, only two remaining positively charged residues (K41, K42) and a few negatively charged residues are on the other face if IPI* (Figure 5C). Along with the charged residues on the first face of IPI*, there exists an exposed hydrophobic protrusion (Fig 5B, circled in red) comprising of residues only from loop 3 (T55, A56, L57, and F58). That these exposed hydrophobic residues also are the only sequence of residues that show any real dynamic character makes them very likely candidates for being part of a protein-protein interaction involving IPI*. Lastly, a BLAST search on IPI* revealed that it shares very low sequence homology to any other protein. Likewise, when the structure of IPI* is compared to others in the protein data base using the online program DALI, the results indicate that the IPI* structure in fact comprises a unique protein fold. The novel IPI* compact fold does not support the view that all single-domain compact folds have now been identified 10; possibly other three dimensional search methods might find structurally more distantly related protein folds 11.
IPI* inhibitor specificity
IPI* displays remarkable specificity as an inhibitor. Not only does IPI* function only as a specific inhibitor of gmrS/gmrD enzymes that target sugar modified and cytosine modified (HMC) T-even phage DNAs 1, 2, but it is effective as an inhibitor against only some of these closely related enzymes (Table 3). IPI* inhibition allows growth of any sugar-HMC DNA containing phage on the gmrS/gmrD CT restriction endonuclease (from E. coli CT596) expressing clones, either when IPI* is injected by the infecting phage (column 3, see column 7 for the phage IP content) or when it is synthesized by an IPI* expression plasmid (column 2 IPI* versus co1umn 1 mutant IPI*). Thus, IPI* is necessary and sufficient for protection against the CT restriction enzyme. However, clones expressing the ∼90% sequence identical UT enzyme (from E. coli UT189) are immune to IPI* injected by the phage (column 4) or synthesized by the IPI* expression plasmid (column 5). Thus, the UT enzyme is immune to IPI* inhibition. Evidently some phages contain sugar HMC, or ip or other phage gene modifications that are sufficient to protect against the UT enzyme (e.g. T4, T4 ip1-, DDY1) and that are insufficient to protect against the CT enzyme (T4 ip1-). In fact, it appears more likely that these differences relate to CT and UT enzymatic differences in recognition and degradation of specific sugar HMC DNA modifications, since none of the ip5-9 gene encoded proteins are effective inhibitors of the UT enzyme (rows 3-7).
Table 3.
IPI* inhibition of the E. coli CT and UT gmrS/D restriction endonucleases 13
| 1 | 2 | 3 | 4 | 5 | 6 | 7 | 8 | |
|---|---|---|---|---|---|---|---|---|
| pIPI* | mIPI* | IPI* | - | - | IPI* | - | ||
| pgmrS/D | CT | CT | CT | UT | UT | - | ip1locus | glc HMC DNA |
| Phage | ||||||||
| T4 | + | + | + | + | + | + | ip1 | + |
| T4ip1- | - | + | - | + | + | + | ip1- | + |
| RB15 | - | + | - | - | - | + | ip5-7-8-9 | + |
| K3 | + | + | + | - | - | + | ip7-8-9 | + |
| T2 | - | + | - | - | - | + | ip5-7 | + |
| T6 | - | + | - | - | - | + | ip5-6 | + |
| RB70 | - | + | - | - | - | + | ip5 | + |
| C16 | + | + | + | - | - | + | ip1 | + |
| RB69 | + | + | + | - | - | + | ip1 | + |
| AC3 | + | + | + | + | + | + | ip1 | + |
| RB27 | + | + | + | - | - | + | ip1 | + |
| D8 | + | + | + | - | - | + | ip1 | + |
| RB30 | + | + | + | - | - | + | ip1 | + |
| DDYI | + | + | + | + | + | + | ip1 | + |
| N209 | + | + | + | + | + | + | ip1 | + |
| RB49, λ, T3 | + | + | + | + | + | + | - | - |
Phage growth is given as + (efficiency of plating =1 relative to growth on E. coli DH10B (column 6) or - (efficiency of plating <10-6). Phages are shown together with the ip1 locus genes they contain (column 7) and the presence or absence of sugar-hydroxymethylcytosine modification in their DNA (column 8). Clones: all plasmids are tested in E. coli DH10B that lacks restriction-modification systems. Compatible plasmids are CT=pgmrS/gmrD (pBexB from pBeloBAC11 (columns 1-3), or UT=pgmrS-i-gmrD from E. coli UT189 in pBeloBAC11 (columns 4 & 5); and mIPI* or IPI* (pdl4 and pdl5 encoding mIPI* (A40T, E53K) (column 1) and IPI* (columns 2 & 5) in pET15B).
There is apparently a significant gain of fitness associated with acquisition of ip1 resistance by the UT enzyme, since it can protect against significantly more of the phages that can grow on a CT producing host (e.g. RB69, RB27 and D8 versus AC3 and DDY1). Although UT resistance found among phages such as AC3 and DDY1 is unrelated to the ip1 inhibitor carried by such phages and likely is due to unknown differences in the sugar HMC DNA modifications, greater knowledge of the CT and UT enzyme sugar HMC DNA directed nuclease specificities, and of the nature of the DNA sugar modifications among the phages is necessary to account fully for these resistance differences. In fact, it is not excluded that sequence and/or structural differences among the ip1 genes themselves (e.g. 4 amino acid differences from T4 in IPI* of RB69), or the presence of other non ip1 locus ip encoded inhibitor proteins among some of these phages may account for differences in resistance to the gmrS/gmrD restriction endonucleases. In any case, it appears that the UT enzyme has evolved from the CT enzyme specifically to respond to the phage IPI* inhibitor, a fourth generation response in this co-evolutionary pathway of increasingly elaborate modifications (Figure 7).
DISCUSSION
Absence of significant homology between IPI* and any other protein has previously ruled out structure-function predictions. Determination of its structure should facilitate future work elucidating the molecular mechanism and specificity of IPI* nuclease inhibition as well as of the ip1 family of gene products. The IPI* restriction endonuclease inhibitor forms a unique and compact protein fold whose dimensions (30 × 30 ×15 Å) may allow the protein to be ejected through the 30 Å phage portal and tail apertures without unfolding. Although larger proteins that require refolding for biological function are ejected into the host by the T-even phages 5, DNA protection may require immediate nuclease inhibition that would be impaired by a requirement for refolding. The most remarkable feature of the IPI* structure is the novel fold of the protein. The fold utilizes hydrophobic packing of one face of a beta sheet along the hydrophobic side of an amphipathic helix. Additional hydrophobic residues from a loop region are also incorporated into the core, creating a U-shaped domain that can apparently withstand quite harsh conditions; in the course of this work we observed that this protein survives multiple freeze-thaw cycles without visible breakdown products, remains folded at room temperature for upwards of 12 months, and stays folded from pH 3 to 10. The importance of the integrity of the structure to the function of the protein is demonstrated by the loss of inhibitor function of the single amino acid replacement ip1- mutant KAI- (A40T) protein 2. A closely related IPI* protein, containing the mutations A40T and E53K, was found to be completely unfolded in solution (data not shown), and as discussed in previous work, the E53K mutation is strongly suspected to be silent 2. The current work offers an explanation for why the A40T replacement disrupts the IPI* structure. A40, labeled in red in Figure 6, is located in the middle of a well-packed hydrophobic core and is important for retaining folded IPI*. The introduction of a slightly larger residue, coupled with the introduction of a polar group in the middle of an otherwise nonpolar environment (A40T), is apparently structurally disastrous to the beta-sheet core of the IPI* fold.
IPI* evidently inhibits the activity of the E. coli CT596 GmrS/GmrD restriction endonuclease through direct protein-protein interaction 2. Recent theories on the energetics dictating protein binding suggest that highly dynamic regions of otherwise well-ordered proteins often are involved in protein-protein interaction; thus binding interfaces are often flexible (reviewed in 12). The heteronuclear NOE experiment (Figure 1B and 6B) identifies 1H-15N pairs involved in fast time scale dynamics (picosecond regime) of the protein backbone. As shown in figure 6B, 9 residues (A1, T2, V23, D43, L57, E54, F58, K59, and L76) display rapid motion (noe/ref <0.68). The loop between B4 and B5 has a particularly large number of highly dynamic residues. Interestingly, this loop is also particularly solvent exposed, yet has the distinction of containing multiple hydrophobic residues (T55, A56, L57, F58). A combination of exposed hydrophobic residues and fast internal dynamics therefore lead us to hypothesize that IPI* binds gmrS or gmrD primarily through this loop region. Studies are ongoing to test this idea.
IPI* is observed to bind to DNA without apparent sequence specificity at low ionic strength (unpublished observations). It is likely that the highly electropositive side of IPI* binds electrostatically to the DNA and thus promotes co-ejection of IPI* with the DNA into the host. Such an association of the ∼360 IPI* molecules over the length of the DNA entering the cell might promote nuclease inhibition, although DNA entry together with associated IPI* is evidently not required for inhibition, since IPI* protein synthesized within the host is also effective in protecting the entering DNA (Table 3). Whether the multiple other ip1 locus homolog encoded internal proteins found among other T-even phage family members have different specificities and structures is an interesting question.
It is remarkable that the IPI* inhibitor has evolved apparently with the sole function of blocking a single specific CT heterodimeric type IV DNA modification dependent restriction endonuclease. It does not inhibit the 90% sequence identical monomeric type IV UT enzyme that targets comparable sugar DNA modifications and thus the UT enzyme apparently has evolved to block the IPI* inhibition. It will be of interest to determine whether or not IPI* binds to the UT enzyme, and, if so, whether the single polypeptide structure of this closely related enzyme is responsible for its IPI* immunity. The UT enzyme is a protein of ∼70 kDa (unpublished observations) that may be more amenable to characterization than the heterodimeric CT enzyme, which has a tendency to unfold and bind strongly to the GroEL protein 3. It appears on the basis of genetic and enzymatic criteria that the CT (and likely UT) enzymes are related to the McrBC enzyme (Figure 7) that attacks non-sugar modified hydroxymethylcytosine containing DNAs (discussed in 3). McrBC is a unique Type IV modification dependent restriction endonuclease that translocates DNA by hydrolyzing GTP 13, 14. It appears that various NTPs provide for CT enzyme activity 3, and likely the UT enzyme would have a comparable NTP dependency. NTP driven DNA translocation coupled to DNA hydrolysis is a fascinating feature of this type of restriction enzyme.
What is the connection between the diverse sugar modifications and the diverse ip1 gene proteins of the T-even phages? One argument for a connection is the observation that the unmodified cytosine DNA containing PseudoT-even RB49 phage has no internal protein genes 15. Except in the capsid targeting sequences the ip1 locus genes display few sequence similarities. It is known that there are recombinogenic sequences that promote horizontal gene transfers among the ip1 locus genes in the T-even phage family 4. It is likely that only a small fraction of the gene diversity at the ip1 locus in the T-even phage family has been sampled to date, thus likely there are a very large number of small proteins found associated with this single locus that could display novel protein folds. The ip1 gene family relationship to the CT and UT family of gmr encoded enzymes that act only on glc-HMC DNA shows an interesting evolutionary progression of ever increasing complexity and specificity. What accounts for the extent of the gene diversity generated by this phage versus host arms race (Figure 7)? As in some other attack and defense wars (or cold wars) it appears that the phage and host have elaborated a wasteful set of increasingly elaborate armaments. Since the gmr enzymes do not attack cytosine phage DNAs (Table 3) 2, 3, why have the T-evens set out to add increasingly complex sugars, and sugars plus protein inhibitors to block enzymes directed against these modified DNAs when they could reverse course to non-modified DNA and focus on defenses against the enzymes that attack those DNAs? What maintains a forward direction along the evolutionary pathway shown, and what are the gains versus costs of this forward elaboration strategy? A detailed understanding of the components at play and their diversity is necessary to begin to answer this evolutionary question. What is the approximate magnitude of the unique and highly specific IPI*-like proteins that exist in this phage family, and where did they originate and undergo testing 15, 16? These are specific questions about the evolution of an enormous set of protein structures with a very circumscribed set of functions arising within a population estimated at over 1031 members 17.
MATERIALS AND METHODS
Plasmids and phages
The IPI* precursor (95 amino acid residues) is assembled into the phage prohead scaffold where it is processed by the morphogenetic protease (gp21) that removes 19 N-terminal amino acids at a consensus ITE cleavage site, which leaves the mature IPI* (76 residues) within the capsid for injection with the DNA (5). Therefore the ip1* and ip1-* genes cloned into pET15b for functional protein expression studies started from the cleavage site of the IPI* precursor of wild-type T4 and T4 ip1- HA35 (A40T, E53K), with mutant residues numbered from the N-terminus of the IPI* polypeptide chain (2). Since the single amino acid replacement ip1- mutant KAI- (A40T) has the same null phenotype and lacks IPI* from the virion as does HA35 (2) it is likely that it is A40T that converts the IPI* chain to a random coil. The two ip* gene containing clones maintained in E. coli BL21(DE3) for high level protein expression called DL13 and DL14, respectively, were constructed as described previously 2 .
The E. coli CT596 gmrS/gmrD homolog from E. coli UT189 was cloned using primers 5′-CCCAAGCTTGATGAAGAGATAAGAAAGAATAACCAG (HindIII) and 5′-CGCGGATCCCTTTTGTCAGGGAGATCTACCATGC (BamHI) to insert the ∼2.3 kb PCR product into pBELOBac11. Sequencing of the desired clone that restricted the growth of numerous T-even phages without restricting the growth of the cytosine DNA containing phages tested (see Table 3) confirmed the identity of the gmrS/gmrD homologs gene encoding a single 628 amino acid polypeptide chain comprising the S plus intervening sequence plus D residues of CT596. The sequence was identical to that reported from the genomic sequence of the uropathogenic E. coli UT189 18. T-even phages, the cytosine DNA containing PseudoT-even RB49 15, and other phages (λ, T3) tested (table 3) were either from this laboratory or were generous gifts of Henry Krisch (Toulouse), or Jim Karam (Tulane). Phage growth on plasmid containing bacteria was tested as described previously 2.
Protein expression and purification
DL13 and DL14 were used to over express and purify a His-tagged version of both the IPI* and mutant IPI-* (HA35) proteins. Overnight cultures of these strains were diluted into 1 L of LB broth and grown exponentially at 37°C until at O.D. 600nm ≈ 0.5 IPTG was added to cultures to a final concentration of 1 mM. Growth was continued at 30°C for 2.5 hours after which bacterial pellets were harvested by centrifugation at 4000rpm for 20 min at 4°C in a Sorvall GSA rotor. The remaining protein purification was conducted by following the protocol suggested in the His-Bind Kit (Novagen; San Diego, CA), and carried out at room temperature.
The IPI* and IPI-* samples uniformly labeled with either 15N or 15N, 13C were prepared by growing strains DL13 and DL14 in minimal medium that contained either 15NH4Cl (99%, 15N), or 15NH4Cl and 13C-glucose (>98%, 13C) (Cambridge Isotope Laboratories, Inc; Woburn, MA) as the sole nitrogen and carbon sources, respectively. The expression and purification protocols were the same as described above. The eluted IPI* and IPI-* were dialyzed against 20 mM sodium acetate buffer, pH 4.8 and then concentrated to reach a final concentration of 500μM. The samples were stored at -20°C for NMR experiments.
NMR Spectroscopy
All NMR samples contained 13C, 15N-labeled or 15N-labeled IPI* (0.25-0.75 mM), sodium acetate buffer (20 mM), pH 4.8, and 10% D2O. Samples were passed through a Sephadex G25 column to remove trace impurities, re-concentrated in d3 sodium acetate (>99 atom% deuterium; Cambridge Isotope Laboratories), degassed for at least one hour, flushed with argon gas and sealed. Samples prepared in this manner were remarkably stable (i.e. for at least a year at room temperature) as judged by the lack of change in all of its 1H-15N correlations in 2D HSQC experiments. Sequential backbone and side-chain assignments of IPI* were obtained using standard heteronuclear multidimensional NMR spectroscopy as described previously19. Specifically, heteronuclear NMR spectra were collected at 37°C on either a Bruker DMX600 NMR spectrometer (600.13 MHz for protons) or a Bruker AVANCE 800 NMR spectrometer (800.27 MHz for protons) equipped with pulse-field gradients, four frequency channels and a triple-resonance z-axis gradient 5mm cryogenic probehead. Unless otherwise stated, multidimensional NMR data were collected in the indirect dimensions using States-TPPI phase-cycling using a 1 s relaxation delay 20. For most experiments, initial delays in the indirect dimensions were set to give zero- and first-order phase corrections of 90° and -180°, respectively 21. In general, pulse field gradients were included to purge undesired transverse magnetization, and the WATERGATE technique was used in most cases to suppress the solvent signal in samples dissolved in H2O. Data were processed on Linux Fedora 2.6 using the software package NMRPIPE 22. All proton chemical shifts are reported with respect to the H2O or HDO signal, which is taken as 4.658 ppm downfield from external TSP (0.00 ppm) at 37 °C. The 13C and 15N chemical shifts were indirectly referenced using the following ratios of the zero-point frequencies at 37 °C: 0.10132905 for 15N-1H and 0.25144953 for 13C-1H 21, 23, 24.
Uniformly 15N-labeled IPI* was used to collect the 2D 1H, 15N fast HSQC 25, 3D 15N, 15N-edited HMQC-NOESY-HSQC 26, and 3D 15N-edited NOESY-HSQC spectra. The 13C, 15N-labeled IPI* was used to collect 3D CBCA(CO)NH 27, 3D HNCACB 28, 3D HNCO 29, 3D C(CO)NH 27, 3D H(CCO)NH, 4D 13C, 15N -edited NOESY-HSQC 30, and 4D 13C, 13C -edited NOESY HSQC spectra (Table 1). Hydrogen bonds were determined through a hydrogen-deuterium exchange experiment, where IPI* in H2O was lyophilized, redissolved in D2O, and a series of fast HSQC spectra were collected every 10 min for 2 hours, then every 30 min. for 10 hours. A 2D IPAP 1H-15N HSQC was collected on isotopic and partially aligned 15N-labeled IPI* samples to obtain H-N dipolar coupling data, as previously described 31. These data were separated into complementary in-phase and anti-phase matrices, each with 512* × 2048* points in t1 and t2, and acquisition times of 80.9 ms (15N) and 122.1 ms (1H). The processed matrices contained 1024 × 4096 real points F1 and F2. In the final processed data, the peak positions were determined using the contour averaging method with the data analysis program PIPP 32. The 2D 15N-{1H} heteronuclear NOE experiment was run on a 15N-labeled sample, and 15N-{1H} NOE ratios were measured by fully interleaving the NOE and reference experiments as previously described 33. The heteronuclear NOE experiment used a 3-s presaturation period and a 2-s relaxation delay; the control experiment had an equivalent 5-s delay. In these experiments, water was returned to the z-axis prior to each scan to avoid saturation transfer. Both NOE and control experiments were acquired with 1024* (t2) × 246* (t1) points, with 128 scans. Spectra from the heteronuclear NOE experiment were extended by linear prediction and zero-filling prior to apodization with a 5%-shifted mixed Gaussian/exponential function. NOE peak heights were taken from Gaussian fits of the frequency-domain data. The NOE was calculated as NOE = η+ 1 = Ipresat/Ino-presat, where Ipresat and Ino-presat are the peak heights with and without 1H presaturation, respectively. The heteronuclear NOE experiment was used to identify residues of the protein (NOE < 0.68) that are dynamic on a fast timescale; such residues in loops (loops 2-5), and at the N- and C-termini, including residues in the His-tag pre-sequence; these residues were not included in structure calculations.
Structure calculations
Interproton distance restraints derived from NOESY experiments were classified into five levels including strong, medium, medium weak, weak and very weak representing distance ranges of a lower limit of 1.8Å and an upper limit of 6Å, as described previously 34, 35. Pseudoatom corrections were applied to the upper limit for degenerate methyl, methylene and aromatic ring protons, and restraints for methyl protons were shifted down one category. Only structurally useful constraints were used, and thus NOE correlations between geminal protons and vicinal methylene protons were excluded. Dihedral constraints Φ ± 20° ψ ± 15° for α-helix and Φ ± 40° ψ ± 40° for β-sheet were included on the basis of hydrogen exchange rate, predictions from the program TALOS 36, and chemical shift index of 1Hα and 13Cα 37. In regions of known secondary structure, the values fell within the normal bond angles for α helices (φ= – 60 ± 20°, ψ= - 40 ± 15°) and β strands (φ= - 120 ± 30°, ψ= - 140 ± 30°). Omission of dihedral constraints produced no significant structural changes to the structure.
A total of 55 internuclear dipolar coupling constraints were determined by recording the difference in the 1JHN values (in hertz) between standard (isotropic) and axially stretched polyacrylamide (aligned) samples. The axial (Aa) and rhombic (Ar) components of the alignment tensor A were obtained from a histogram of the dipolar coupling that were normalized to 1DNH values as previously described 38. The force constant for the dipolar coupling energy was slowly increased in concert with the force constants of the NOE energy during the cooling stage of the structure calculations. The initial force constants were originally small (0.001 kcal Hz-2), and the final force constants were determined for the 1DNH dipolar couplings such that the calculated structures represented the estimated uncertainty in the actual dipolar coupling data set 39.
Hydrogen bond constraints of rNH-O = 1.5-2.8 Ǻ and rN-O = 2.4-3.5 Ǻ were included in the final stage of structure calculations. Also, pseudopotentials for secondary 13Cα and 13Cβ chemical shifts and a conformational database potential were included in the final SA refinement 40. Two hundred structures were calculated using the computer program XPLOR version 2.9.3 using a (Σr-6)-1/6 sum for the distance dependent constraints 41. Standard protocols for sub-structure embedding, regularization, hybrid distance geometry-simulated annealing (DGSA) regularization/refinement, and simulated annealing (SA) were used in these calculations. Overall, this refinement process yielded >60 structures with no distance constraint violations greater than 0.4 Ǻ and no dihedral violations >5°. From this group, the 20 best structures were chosen based on their overall energy level (Table 2). Coordinates and chemical shift values of IPI* have been deposited in the Protein Data Base under accession number 2JUB.
Table 2.
NMR-derived restraints and statistics of 20 NMR structures 8
| <20> | Best | |
|---|---|---|
| rmsd from distance constraints (Å) 9 | ||
| total (1244) | 0.027 ± .002 | 0.025 |
| intraresidue (180) | 0.004 ± .001 | 0.004 |
| sequential ( |i - j| = 1) (389) | 0.017 ± .003 | 0.018 |
| medium range (1 < |i - j| ≤ 1) (301) | 0.030 ± .004 | 0.024 |
| long range ( |i - j| > 5) (328) | 0.033 ± .004 | 0.032 |
| hydrogen bonds (46) | 0.060 ± .009 | 0.050 |
| rmsd from dihedral constraints (°) | ||
| Φ, Ψ (85) | 0.269 ± .172 | 0.119 |
| rmsd from dipolar coupling restraints (Hz) | ||
| DNH (46) | 0.49 ± .05 | 0.43 |
| rmsd from exptl 13C chemical shifts | ||
| 13Cα (ppm) (76) | 1.31 ± .09 | 1.27 |
| 13Cβ (ppm) (69) | 1.31 ± .10 | 1.24 |
| rmsd from idealized geometry | ||
| bonds (Å) | 0.004 ± .001 | 0.004 |
| angles (°) | 0.609 ± .035 | 0.590 |
| impropers (°) | 0.601 ± .027 | 0.580 |
| Lennard-Jones potential energy (kcal/mol) 10 | -235 ± 12 | -238 |
| Region of the Ramachandran plot 11 | ||
| Most favorable | 73.2 ± 4.1 | 72.3 |
| Additionally allowed | 22.1 ± 4.3 | 24.6 |
| Generously allowed | 4.6 ± 2.0 | 3.1 |
| Dissallowed | 0.0 ± 0.0 | 0 |
| Rmsd to the mean structure (Å) 12 | ||
| Backbone | 0.743 ± .108 | 0.590 |
| all heavy atoms | 1.303 ± .182 | 1.05 |
| ordered backbone | 0.484 ± .119 | 0.406 |
| ordered heavy atoms | .562 ± .116 | 0.492 |
The 20 ensemble structures, <20>, are the results of simulated annealing calculations. The best structure is chosen from the lowest overall RMSD value. The values shown for the <20> are the mean ± standard deviation.
None of the 20 structures has a distance violation > 0.4 Å or a dihedral angle violation of > 5 °. The force constants used in the SA calculations are as follows: 1000 kcal mol-1 Å2 for bond length, 500 kcal mol-1 rad-2 for angles and improper torsions, 4 kcal mol-1 Å-4 for the quartic van der Waals (vdw) repulsion term (hard-sphere effective vdw set to 0.8 times their values in CHARMm parameters), 50 kcal mole-1 Å-2 for experimental distance constraints, 100 kcal mol-1 Å-2 for non-crystallographic symmetry, 1kcal mol-1 Å-2 for distance symmetry constraints, 0.5 kcal mol-1 ppm-2 for the 13C chemical shift constraints, and 1.0 for the conformational database potential. The force constant (in kcal Hz-2) used for dipolar coupling restraints was 0.70 for 15N-1HN.
Lennard-Jones van der Waals energies were calculated using CHARMm parameters and were not used in any stage of the structure determination
PROCHECK was utilized to generate the Ramachandran plot.
Backbone calculations include Cα, N, and C’ atoms. Ordered backbone residues consist of 3-10, 18-28, 39-49, and 59-76 as these are the residues are in secondary structural regions or well-defined loops (65% of the molecule). 12 The 20 ensemble structures, <20>, are the results of simulated annealing calculations. The best structure is chosen from the lowest overall RMSD value. The values shown for the <20> are the mean ± standard deviation.
ACKNOWLEDGEMENTS
DR and LWB were supported by a grant from the NIH (AI11676). DJW was supported by a grant from the NIH (GM58888), and NTW was supported by an American Heart Association predoctoral training grant (0615343U). We thank Swain Chen and Scott Hultgren (Washington University, St. Louis) for providing uropathogenic (UPEC) E. coli UT189.
Footnotes
Publisher's Disclaimer: This is a PDF file of an unedited manuscript that has been accepted for publication. As a service to our customers we are providing this early version of the manuscript. The manuscript will undergo copyediting, typesetting, and review of the resulting proof before it is published in its final citable form. Please note that during the production process errors may be discovered which could affect the content, and all legal disclaimers that apply to the journal pertain.
REFERENCES
- 1.Abremski K, Black LW. The function of bacteriophage T4 internal protein I in a restrictive strain of Escherichia coli. Virology. 1979;97(2):439–47. doi: 10.1016/0042-6822(79)90353-2. [DOI] [PubMed] [Google Scholar]
- 2.Bair CL, Rifat D, Black LW. Exclusion of glucosyl-hydroxymethylcytosine DNA containing bacteriophages is overcome by the injected protein inhibitor IPI*. J Mol Biol. 2007;366(3):779–89. doi: 10.1016/j.jmb.2006.11.049. [DOI] [PMC free article] [PubMed] [Google Scholar]
- 3.Bair CL, Black LW. A type IV modification dependent restriction nuclease that targets glucosylated hydroxymethyl cytosine modified DNAs. J Mol Biol. 2007;366(3):768–78. doi: 10.1016/j.jmb.2006.11.051. [DOI] [PMC free article] [PubMed] [Google Scholar]
- 4.Repoila F, Tetart F, Bouet JY, Krisch HM. Genomic polymorphism in the T-even bacteriophages. The EMBO journal. 1994;13(17):4181–92. doi: 10.1002/j.1460-2075.1994.tb06736.x. [DOI] [PMC free article] [PubMed] [Google Scholar]
- 5.Mullaney JM, Black LW. Capsid targeting sequence targets foreign proteins into bacteriophage T4 and permits proteolytic processing. J Mol Biol. 1996;261(3):372–85. doi: 10.1006/jmbi.1996.0470. [DOI] [PubMed] [Google Scholar]
- 6.Carlson K, Raleigh EA, Hattman S. Restriction and Modification. In: Karam JD, editor. In the Molecular Biology of bacteriophage T4. ASM Press; Washington, DC: 1994. 1994. pp. 369–381. [Google Scholar]
- 7.Karam JD, Drake JW. Molecular biology of bacteriophage T4. American Society for Microbiology; Washington, DC: 1994. [Google Scholar]
- 8.Dill KA. Dominant forces in protein folding. Biochemistry. 1990;29(31):7133–55. doi: 10.1021/bi00483a001. [DOI] [PubMed] [Google Scholar]
- 9.Kim PS, Baldwin RL. Intermediates in the folding reactions of small proteins. Annu Rev Biochem. 1990;59:631–60. doi: 10.1146/annurev.bi.59.070190.003215. [DOI] [PubMed] [Google Scholar]
- 10.Zhang Y, Hubner IA, Arakaki AK, Shakhnovich E, Skolnick J. On the origin and highly likely completeness of single-domain protein structures. Proceedings of the National Academy of Sciences of the United States of America. 2006;103(8):2605–10. doi: 10.1073/pnas.0509379103. [DOI] [PMC free article] [PubMed] [Google Scholar]
- 11.Hou J, Jun SR, Zhang C, Kim SH. Global mapping of the protein structure space and application in structure-based inference of protein function. Proceedings of the National Academy of Sciences of the United States of America. 2005;102(10):3651–6. doi: 10.1073/pnas.0409772102. [DOI] [PMC free article] [PubMed] [Google Scholar]
- 12.Ishima R, Torchia DA. Protein dynamics from NMR. Nat Struct Biol. 2000;7(9):740–3. doi: 10.1038/78963. [DOI] [PubMed] [Google Scholar]
- 13.Panne D, Raleigh EA, Bickle TA. The McrBC endonuclease translocates DNA in a reaction dependent on GTP hydrolysis. J Mol Biol. 1999;290(1):49–60. doi: 10.1006/jmbi.1999.2894. [DOI] [PubMed] [Google Scholar]
- 14.Bourniquel AA, Bickle TA. Complex restriction enzymes: NTP-driven molecular motors. Biochimie. 2002;84(11):1047–59. doi: 10.1016/s0300-9084(02)00020-2. [DOI] [PubMed] [Google Scholar]
- 15.Comeau AM, Bertrand C, Letarov A, Tetart F, Krisch HM. Modular architecture of the T4 phage superfamily: a conserved core genome and a plastic periphery. Virology. 2007;362(2):384–96. doi: 10.1016/j.virol.2006.12.031. [DOI] [PubMed] [Google Scholar]
- 16.Comeau AM, Krisch HM. War is peace--dispatches from the bacterial and phage killing fields. Current opinion in microbiology. 2005;8(4):488–94. doi: 10.1016/j.mib.2005.06.004. [DOI] [PubMed] [Google Scholar]
- 17.Hendrix RW, Smith MC, Burns RN, Ford ME, Hatfull GF. Evolutionary relationships among diverse bacteriophages and prophages: all the world’s a phage. Proceedings of the National Academy of Sciences of the United States of America. 1999;96(5):2192–7. doi: 10.1073/pnas.96.5.2192. [DOI] [PMC free article] [PubMed] [Google Scholar]
- 18.Chen SL, Hung CS, Xu J, et al. Identification of genes subject to positive selection in uropathogenic strains of Escherichia coli: a comparative genomics approach. Proceedings of the National Academy of Sciences of the United States of America. 2006;103(15):5977–82. doi: 10.1073/pnas.0600938103. [DOI] [PMC free article] [PubMed] [Google Scholar]
- 19.Baldisseri DM, Rustandi RR, Zhang Z, et al. 1H, 13C and 15N NMR sequence-specific resonance assignments for rat apo-S100A1(alpha alpha) J Biomol NMR. 1999;14(1):91–2. doi: 10.1023/a:1008301518346. [DOI] [PubMed] [Google Scholar]
- 20.Marion D, Driscoll PC, Kay LE, et al. Overcoming the overlap problem in the assignment of 1H NMR spectra of larger proteins by use of three-dimensional heteronuclear 1H-15N Hartmann-Hahn-multiple quantum coherence and nuclear Overhauser-multiple quantum coherence spectroscopy: application to interleukin 1 beta. Biochemistry. 1989;28(15):6150–6. doi: 10.1021/bi00441a004. [DOI] [PubMed] [Google Scholar]
- 21.Spera S, Ikura M, Bax A. Measurement of the exchange rates of rapidly exchanging amide protons: application to the study of calmodulin and its complex with a myosin light chain kinase fragment. J Biomol NMR. 1991;1(2):155–65. doi: 10.1007/BF01877227. [DOI] [PubMed] [Google Scholar]
- 22.Delaglio F, Grzesiek S, Vuister GW, Zhu G, Pfeifer J, Bax A. NMRPipe: a multidimensional spectral processing system based on UNIX pipes. J Biomol NMR. 1995;6(3):277–93. doi: 10.1007/BF00197809. [DOI] [PubMed] [Google Scholar]
- 23.Edison AS, Abildgaard F, Westler WM, Mooberry ES, Markley JL. Practical introduction to theory and implementation of multinuclear, multidimensional nuclear magnetic resonance experiments. Methods Enzymol. 1994;239:3–79. doi: 10.1016/s0076-6879(94)39003-7. [DOI] [PubMed] [Google Scholar]
- 24.Live DH, Davis DG, Agosta WC, Cowburn D. Longe range hydrogen bond mediated effects in peptides: 15N NMR study of gramicidin S in water and organic solvents. J Am Chem Soc. 1984;106:1939–41. [Google Scholar]
- 25.Mori S, Abeygunawardana C, Johnson MO, van Zijl PC. Improved sensitivity of HSQC spectra of exchanging protons at short interscan delays using a new fast HSQC (FHSQC) detection scheme that avoids water saturation. J Magn Reson B. 1995;108(1):94–8. doi: 10.1006/jmrb.1995.1109. [DOI] [PubMed] [Google Scholar]
- 26.Ikura M, Bax A, Clore GM, Gronenborn AM. Detection of Nuclear Overhauser Effects between Degenerate Amide Proton Resonances by Heteronuclear Three-dimensional Nuclear Magnetic Resonance Spectroscopy. Journal of American Chemical Society. 1990;112:9020–2. [Google Scholar]
- 27.Grzesiek S, Anglister J, Bax A. Correlation of backbone amide and aliphatic side-chain resonances in 13-C/15-N-enriched proeins by isotropic mixing of 13-C magnetization. Journal of Magnetic Resonance. 1993;B101:114–9. [Google Scholar]
- 28.Wittekind M, Mueller L. HNCACB a high-sensitivity 3D NMR experiment to correlate amide-proton and nitrogen resonances with the alpha- and beta proton resonances in proteins. J Magn Reson. 1993;B101:205–10. [Google Scholar]
- 29.Kay LE, Clore GM, Bax A, Gronenborn AM. Four-dimensional heteronuclear triple-resonance NMR spectroscopy of interleukin-1 beta in solution. Science. 1990;249(4967):411–4. doi: 10.1126/science.2377896. [DOI] [PubMed] [Google Scholar]
- 30.Muhandiram DR, Guang YX, Kay LE. An enhanced-sensitivity pure absorption gradient 4D 15N,13C-edited NOESY experiment. J Biomol NMR. 1993;3:463–70. [Google Scholar]
- 31.Wright NT, Varney KM, Ellis KC, Markowitz J, Gitti RK, Zimmer DB, Weber DJ. The three-dimensional solution structure of Ca(2+)-bound S100A1 as determined by NMR spectroscopy. J Mol Biol. 2005;353(2):410–26. doi: 10.1016/j.jmb.2005.08.027. [DOI] [PubMed] [Google Scholar]
- 32.Garrett DS, Powers R, Gronenborn AM, Clore GM. A common sense approach to peak picking in two-, three-, and four-dimensional spectra using automatic computer analysis of contour diagrams. J Magn Reson. 1991;95:214–20. doi: 10.1016/j.jmr.2011.09.007. [DOI] [PubMed] [Google Scholar]
- 33.Farrow NA, Zhang O, Forman-Kay JD, Kay LE. A heteronuclear correlation experiment for simultaneous determination of 15N longitudinal decay and chemical exchange rates of systems in slow equilibrium. J Biomol NMR. 1994;4(5):727–34. doi: 10.1007/BF00404280. [DOI] [PubMed] [Google Scholar]
- 34.Clore GM, Nilges M, Sukumaran DK, Brunger AT, Karplus M, Gronenborn AM. The Three-dimensional structure of a 1-purothionin in solution: combined use of nuclear magnetic resonance, distance geometry, and restrained molecular dynamics. EMBO J. 1986;5:2729–35. doi: 10.1002/j.1460-2075.1986.tb04557.x. [DOI] [PMC free article] [PubMed] [Google Scholar]
- 35.Drohat AC, Baldisseri DM, Rustandi RR, Weber DJ. Solution structure of calcium-bound rat S100B(betabeta) as determined by nuclear magnetic resonance spectroscopy. Biochemistry. 1998;37(9):2729–40. doi: 10.1021/bi972635p. [DOI] [PubMed] [Google Scholar]
- 36.Cornilescu G, Delaglio F, Bax A. Protein backbone angle restraints from searching a database for chemical shift and sequence homology. J Biomol NMR. 1999;13(3):289–302. doi: 10.1023/a:1008392405740. [DOI] [PubMed] [Google Scholar]
- 37.Wishart DS, Sykes BD. The 13C chemical-shift index: a simple method for the identification of protein secondary structure using 13C chemical-shift data. J Biomol NMR. 1994;4(2):171–80. doi: 10.1007/BF00175245. [DOI] [PubMed] [Google Scholar]
- 38.Clore GM, Gronenborn AM, Tjandra N. Direct structure refinement against residual dipolar couplings in the presence of rhombicity of unknown magnitude. J Magn Reson. 1998;131(1):159–62. doi: 10.1006/jmre.1997.1345. [DOI] [PubMed] [Google Scholar]
- 39.Drohat AC, Tjandra N, Baldisseri DM, Weber DJ. The use of dipolar couplings for determining the solution structure of rat apo-S100B(betabeta) Protein Sci. 1999;8(4):800–9. doi: 10.1110/ps.8.4.800. [DOI] [PMC free article] [PubMed] [Google Scholar]
- 40.Kuszewski J, Gronenborn AM, Clore GM. Improvements and extensions in the conformational database potential for the refinement of NMR and X-ray structures of proteins and nucleic acids. J Magn Reson. 1997;125(1):171–7. doi: 10.1006/jmre.1997.1116. [DOI] [PubMed] [Google Scholar]
- 41.Schwieters CD, Kuszewski JJ, Tjandra N, Clore GM. The Xplor-NIH NMR molecular structure determination package. J Magn Reson. 2003;160(1):65–73. doi: 10.1016/s1090-7807(02)00014-9. [DOI] [PubMed] [Google Scholar]