Abstract
Fluorescent proteins are often used as reporters of transcriptional activity. Here we present a mathematical characterization of a novel fluorescent reporter that was recently engineered to have a short half-life (∼12 min). The advantage of this destabilized protein is that it can track the transient transcriptional response often exhibited by signaling pathways. Our mathematical model takes into account the maturation time and half-life of the fluorescent protein. We demonstrate that our characterization allows transient transcript profiles to be inferred from fluorescence data. We also investigate a stochastic version of the model. Our analysis reveals that fluorescence measurements can both underestimate and overestimate fluctuations in protein levels that arise from the stochastic nature of biochemical reactions.
INTRODUCTION
A common property of signaling pathways is that they often act transiently in the presence of a sustained stimulus. For example, yeast respond to mating pheromone by inducing a transient transcriptional program. Therefore there is great interest in measuring gene expression changes in individual living cells as they respond to stimuli in real time. In principle, this could be accomplished with fluorescent proteins. In a recent study, one of us (Beverly Errede) engineered and experimentally characterized a set of short-lived fluorescent reporters (1). These novel reporters were shown to accurately track the time-dependent behavior of pheromone-induced transcription. Fluorescent proteins also have been used to measure variability, both temporal and intercellular, in protein expression levels (2–14). Determining the origins and magnitude of these fluctuations is of interest because of their implications for cell fate decisions and nongenetic individuality.
Many studies on gene expression in single cells have been motivated by theoretical and computational analyses of mathematical models of the underlying system (15–21). Using mathematical models to interpret fluorescence measurements requires a quantitative characterization of the biochemical properties of fluorescent proteins used as reporters. In particular, knowledge of the fluorescent reporter's half-life and maturation kinetics (i.e., folding and oxidation (22)) is critical for this comparison. Here, we use mathematical modeling to quantitatively characterize the short-lived fluorescent proteins reported in Hackett et al. (1). We show that this characterization allows us to infer the underlying transcriptional response from fluorescent measurements, thereby providing a tool for monitoring transcript levels in single cells. Next we use stochastic modeling to investigate how the fluorescence maturation time and protein half-life influence fluctuations in fluorescence levels. Our analysis reveals that for proteins with short half-lives fluorescence measurements can overestimate fluctuations in protein levels, whereas for long-lived reporters fluorescence measurements typically underestimate these fluctuations.
METHODS
Experimental characterization of short-lived fluorescent protein reporters
We begin by briefly summarizing recent work carried out in the Errede laboratory to develop and experimentally characterize a novel class of short-lived fluorescent proteins (1). The approach used to generate a family of cyan fluorescent reporter proteins (CFP) with different stabilities was based on the ubiquitin fusion strategy for programmable N-end rule degradation developed by Varshavsky and colleagues (23). None of the proteins involved in the degradation process are regulated by the cell cycle (24). To experimentally characterize the novel short-lived reporters, the galactose-dependent and glucose-repressible GAL1 promoter was used to drive their expression. Immune blot analysis of protein extracts and fluorescence imaging of individual living cells were used to determine protein half-lives after further transcription was inhibited. Protein accumulation and the emergence of fluorescence were also monitored after shifting cultures from a glucose to a galactose medium. These measurements revealed a long delay between the appearance of newly synthesized protein and the onset of fluorescence (see Hackett et al. (1) for details).
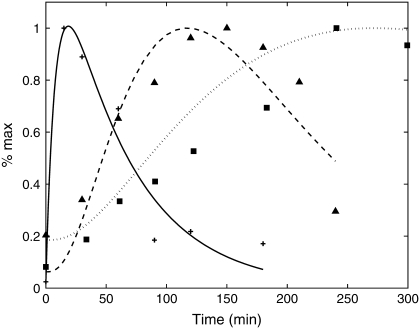
Having experimentally characterized the intrinsic properties of the short-lived reporters, we next tested them for their ability to act as reporters of time-dependent transcriptional activity. Yeast respond to mating pheromone by inducing a transient transcription program. FUS1 expression is strongly induced by pheromone and serves as a standard indicator for mating specific gene expression. Therefore, the FUS1 promoter was exploited to compare the performance of destabilized (PFUS1-UbiY-dkCFP) versus stable (PFUS1-UbiM-dkCFP) fluorescent genes as transcription reporters. The pheromone-induction kinetics measured by fluorescence for both reporters is significantly delayed compared with that measured by messenger RNA (mRNA) abundance (Fig. 1). The speed with which either reports transcription induction is constrained by the inherent time required for fluorophore maturation. However, the advantage of the short-lived reporter is evident in that the attenuation phase of the pheromone-induced profile is similar to that for its mRNA. By contrast, accumulation of the stable MdkCFP reporter completely masks the transient profile.
FIGURE 1.
Time courses for the transcript level (crosses) and fluorescence measurements from a short-lived reporter YdkCFP (half-life = 12 min, triangles) and long-lived reporter MdkCFP (half-life = 76 min, squares) (1). The solid curve is the mRNA profile used as input for the model. The dashed and dotted curves are the model output for the short- and long-lived reporters, respectively (see text for details). The values of the parameters estimated from fitting the model to the experimental data are km = 0.0054 min−1, ku = 34 min−1, and dku = 81.7 min−1.
RESULTS
Mathematical characterization of fluorescent protein reporters
Our ultimate goal is to use short-lived reporters as experimental readouts that can be quantitatively compared with output from computational models of pathway activity. Therefore it is critical to have a mathematical model that accurately describes the synthesis, maturation, and degradation events associated with these proteins. Here we present a model that reproduces experimental data used to characterize these reporters. In our model, premature (nonfluorescent) protein, P, is synthesized at a rate that is proportional to current mRNA concentration. Once synthesized the premature protein can either mature into a fluorescently competent protein, PM, or be ubiquitinated, PU. We assume that the ubiquitination process is reversible and that ubiquitinated protein is subject to degradation. Mature protein can be ubiquitinated, and likewise ubiquitinated protein can mature. Both processes produce the species PMU. These considerations lead to the following four equations for the concentrations of the various protein species:
 |
(1) |
 |
(2) |
 |
(3) |
 |
(4) |
In Eq. 1, mRNA(t) represents the concentration of mRNA at time t, and γ is the translation efficiency. The parameters ku, dku, km, and δ are the ubiquitination, deubiquitination, maturation, and degradation rates, respectively.
Fig. 1 shows data for the short-lived reporter YdkCFP (half-life = 12 min, triangles) and the long-lived reporter MdkCFP (half-life = 76 min, squares). The half-lives correspond to δ = 0.055 min−1 for the short-lived reporter and δ = 0.009 min−1 for the long-lived reporter (1). The input for the model is the time-dependent mRNA profile (Fig. 1, crosses). These data were fit assuming a functional form that consists of the difference of two exponentials (i.e., mRNA(t) = a exp(−α1 t) − b exp(−α2 t)). This produced the solid curve shown in Fig. 1. This curve then served as input for Eq. 1. The total mature protein concentration PM + PMU was fit to both sets of fluorescence data using the nonlinear least squares routine in MATLAB (The MathWorks, Natick, MA). The results of this process are shown as the dotted (half-life = 76 min) and dashed (half-life = 12 min) curves in Fig. 1. The estimated parameter values are km = 0.0054 min−1, ku = 34 min−1, and dku = 81.7 min−1. Because we do not know the absolute levels of mRNA and protein concentrations, the synthesis rates cannot be directly determined from fitting the data. This is not a problem if we are only trying to determine the shape of the transcript profile from fluorescent measurements. However, to investigate fluctuations in gene expression requires these values (see below).
Note that the estimated ubiquitination and deubiquitination rates are much faster than the other biochemical processes in the model. Therefore, we can utilize a quasi-steady-state approximation that assumes the ubiquitinated and deubiquitinated forms of the protein are in equilibrium to simplify the model. This results in the following two equations:
 |
(5) |
 |
(6) |
where PA = P + PU, PMA = PM + PMU, and (δ′ = δ/(1 + dku/ku)). Equations 5 and 6 can be written in dimensionless form as follows:
 |
(7) |
 |
(8) |
where PA′ and PMA′ are defined as PA(km + δ′)/γ and PMA δ′ (km + δ′)/(km γ), respectively. For the estimated model parameter values, the simple model produces results that are visually indistinguishable from Eqs. 1–4 (data not shown). Therefore we use the model defined by Eqs. 7 and 8 to further characterize the properties of the fluorescent reporters. Below we investigate the validity of the simple model when stochastic effects are considered.
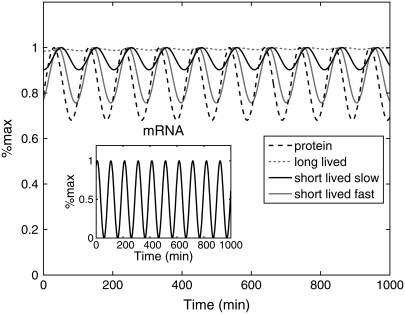
Having developed a mathematical model that accurately predicts the time-dependent behavior of the fluorescent reporters, we used the model to investigate the reporter's ability to track time-dependent changes in mRNA levels. To do this we used an oscillating time series with a period of 100 min (Fig. 2, inset) for mRNA(t), which is comparable to the transcriptional response of the pheromone pathway. The dashed black curve in Fig. 2 is the abundance of a protein with a half-live of 12 min. This value, which is the half-life of the short-lived fluorescent reporter, is comparable to the half-life measured under pheromone-inducing conditions for several components of the pheromone response pathway, such as Ste2 (t1/2 = 16 min), Ste11 (t1/2 = 17 min), and Ste7 (t1/2 = 17 min) (C. Fraser, Y. Wang, and H. Dohlman, personal communication of unpublished data/results). As can be seen, the protein faithfully tracks the mRNA levels. Fluorescent levels of the long-lived reporter (dashed shaded curve) cannot see changes in transcript levels, whereas the short-lived reporter (solid black curve) is able to follow the mRNA level. The dynamic range of the fluorescent reporter depends not only on the protein half-life but also on the maturation time. This transition is governed by the rate constant km. The solid shaded curve in Fig. 2 is the fluorescence level for a reporter with the same half-life as the short-lived reporter, but the maturation rate has been increased 10-fold. Increasing the maturation rate increases the dynamic range of the reporter and allows it to more accurately track rapid changes in transcript levels. These results are consistent with previous theoretical studies based on frequency domain analysis (25), which revealed that long maturation times act to suppress high-frequency fluctuations.
FIGURE 2.
Response of the system to a time-dependent transcript profile. The dashed black curve represents the time-dependent abundance of protein with a 12 min half-life generated from the mRNA profile shown in the inset. The dashed shaded and solid black curves represent fluorescence levels produced by long-lived (76 min half-life) and short-lived (12 min half-life) reporters driven by the same mRNA profile. The solid shaded curve is the fluorescence level of the short-lived reporter when the maturation rate is increased 10-fold.
Inferring transcript levels from fluorescent measurements
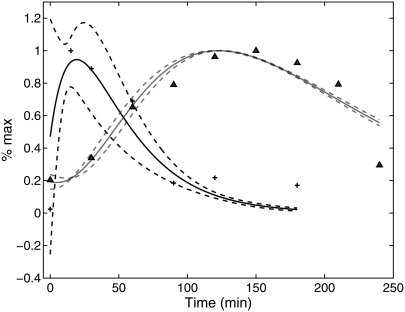
Next, we asked if the model described by Eqs. 7 and 8 can be used to infer mRNA levels from fluorescence measurements. As an initial test, the fluorescence data for the short-lived reporter shown in Fig. 1 was taken as the experimental readout. Again, we assumed that the mRNA profile could be described by the function mRNA(t) = a exp(−α1 t) − b exp(−α2 t). Using the parameter values for ku, dku, km, and δ found above, the model equations were used to infer the values of a, b, α1, and α2. To perform the parameter estimation, 100 sets of parameter values were generated at random. These sets were then used as initial guesses in the nonlinear least squares curve fitting routine. Of the 100 initial guesses, 9 did not produce reasonable fits to the fluorescence data and hence are excluded as outliers. Fig. 3 shows the average ± 2 standard deviations of the distribution of time series for the mRNA level (black curves) and fluorescence levels (shaded curves) generated from the remaining 91 parameter sets. The mean and standard deviation for a, b, α1, and α2 are 0.126, 0.095, 0.028, and 0.051 and 0.033, 0.018, 0.004, and 0.011, respectively. The good agreement between the model output and the experimental data suggests that mathematical models can be used to infer mRNA profiles from fluorescence data.
FIGURE 3.
Inference of the transcript profile from fluorescence measurements. Using fluorescence data for the short-lived reporter (triangles), the parameterized model is used to infer the mRNA profile. The solid black curve is the average result for the distribution of estimated mRNA profiles, and the dashed black curves are ±2 standard deviations. The solid shaded curve is the average fit of the model to the fluorescence data, and the dashed shaded curves are ±2 standard deviations.
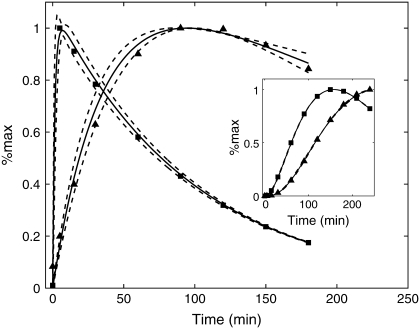
Next we investigated how robust the model is at predicting mRNA levels. Using two different sets of values for a, b, α1, and α2, representing slow and fast mRNA dynamics, the model was run to produce the fluorescence time series shown as triangles and squares in the inset of Fig. 4. We then assumed that the values of α1, α2, a, and b were not known and used the same parameter estimation method as described above to infer mRNA levels using the data points shown in the inset of Fig. 4. For these cases 89 of the initial 100 parameter choices produced reasonable fits to the data. The dashed curves shown in Fig. 4 represent ±2 standard deviations of the distribution of time series. Note that for the case in which the mRNA profiles have rapid activation and deactivation kinetics (square data points) it was necessary to include an early time point (5 min) in the inference step. Otherwise the model could not accurately predict the location of the peak mRNA level. The excellent agreement between the inferred and actual mRNA time series provides further evidence of our ability to infer transcript profiles from fluorescence measurements made from well-characterized reporters. We note that the inference step requires an assumption about the functional form of the mRNA time series. Here we assumed mRNA levels could be accurately represented as the difference of two exponentials. However, it may be necessary to use different functional forms in more complicated situations.
FIGURE 4.
Further characterization of the model's ability to infer time-dependent mRNA levels. Two different mRNA profiles were used to generate fluorescence data. The model output is shown as squares and triangles in the inset. These data points were used to infer the corresponding mRNA levels also shown as squares and triangles in the main figure. The solid curves represent the average estimates, and the dashed curves are ±2 standard deviations.
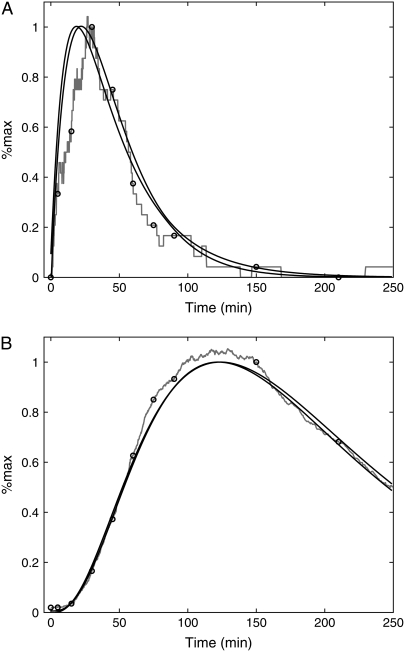
Finally, to investigate how robust our method is to intrinsic fluctuations, we developed a stochastic model of the system described by Eqs. 5 and 6. Details of the stochastic model are given below. To construct a stochastic time-dependent mRNA profile, we used the following simple model. We assume that the mRNA synthesis rate of the fluorescent protein depends on the abundance of a transcriptional regulator (TR) in the following way: smRNA = β TR. The TR is synthesized at a rate sTR and degraded at a rate δTR. Using the parameter values that produce an average mRNA number of 0.02, the system is run to steady state. At t = 0, the synthesis rate of the TR is increased 100-fold, and after 30 min the synthesis rate is returned to its constitutive level. The shaded curve shown in Fig. 5 A is a single realization of the mRNA profile generated using this model.
FIGURE 5.
Robustness of the inference process to intrinsic fluctuations. (A) A single stochastic realization of the mRNA level (shaded curve) and ±2 standard deviations (black curves) for the distribution of profiles estimated from the fluorescence data. The black circles are mRNA values corresponding to the sampled fluorescence levels in B. (B) A single stochastic realization of the fluorescence level (shaded curve) and ±2 standard deviations (black curves) of the distribution of estimated fluorescence profiles. The black circles are the sampled fluorescent data points used in the inference process.
This profile is then used to drive synthesis of the fluorescent protein and produces the shaded trajectory shown in Fig. 5 B. The protein synthesis rate is 5 min−1, which produces an average protein abundance of 3504. This value is typical of proteins in the pheromone response pathway. The black circles shown in Fig. 5 B are the sampled fluorescence data points used to infer the mRNA dynamics. Again we assume that the mRNA abundance has the functional form m(t) = a exp(−α1 t) − b exp(−α1 t) and use the same procedure as described above to estimate the parameter values. The solid black curves shown in Fig. 5 A are ±2 standard deviations of the distribution of mRNA levels generated by the fitting procedure, and the black circles are the true mRNA values corresponding to the sampled fluorescence points shown in Fig. 5 B. In this case, only 61 of the 100 initial parameter guesses produced reasonable fits to the fluorescence data. As can be seen, even with relatively large fluctuations in the transcript level and a sparse sampling rate, the model can be used to infer transcript levels from fluorescent measurements.
Fluorescent proteins as reporters of noise in transcriptional regulation
Recently there has been great interest in determining the origins and consequences of noise in transcriptional regulation. Fluorescent proteins seem to be the ideal reporters for making the single-cell measurements needed to investigate the sources of fluctuations in transcriptional regulation. However a systematic analysis of how the maturation and degradation rates affect fluctuations in fluorescence levels has not been conducted. To investigate this issue, we use stochastic versions of the two deterministic models presented above.
To construct a stochastic version of the model given by Eqs. 5 and 6, we consider the following set of biochemical reactions:
 |
(9) |
 |
(10) |
 |
(11) |
 |
(12) |
Equation 9 models the stochastic activation and deactivation of the gene. In the state (O0 = 1, O1 = 0), the gene is off and transcribed at a constitutive level λ0; whereas in the state (O0 = 0, O1 = 1), the gene is active and transcribed at a rate λ1. To be definite, we assume that transitions between the active and off states occur because of a TR binding to the promoter. The parameters k0 and k1 satisfy the relationship k0 + k1 = 1, and the parameter K determines the timescale of the stochastic on-off transitions. Equation 10 models the synthesis and degradation of mRNA. The mRNA degradation rate is μ. Equation 11 models the synthesis and degradation of the nonfluorescent form of the protein, PA. The synthesis rate is γ, and the degradation rate is δ′. Finally, Eq. 12 models the maturation of newly synthesized protein to fluorescently competent protein and its subsequent degradation.
The stochastic version of the model given by Eqs. 1–4 is described by Eqs. 9 and 10 plus the following set of biochemical reactions:
 |
(13) |
 |
(14) |
 |
(15) |
 |
(16) |
 |
(17) |
 |
(18) |
 |
(19) |
Equation 13 models the synthesis of new (nonfluorescent) protein. Equations 14 and 16 model the ubiquitination and deubiquitination of nonfluorescent and fluorescent protein, respectively, where the rates ku and dku are the same as those in the deterministic model. Equations 15 and 17 model the maturation process. Finally, Eqs. 18 and 19 model the degradation of ubiquitinated protein. As described above, the simple and full model are related by δ′ = δ/(1 + dku/ku). Below, we demonstrate that even when stochastic effects are considered the two models produce similar results. The advantage of the simple model is it is mathematically tractable. Therefore, we provide a detailed analysis of this model.
The master equation for the model described by Eqs. 9–12 can be solved exactly for the steady-state coefficient of variation (CV = standard deviation/mean) and autocorrelation function (ACF) of all the chemical species in the system (See Appendix for details). For the fluorescently competent form of the protein, PAM, which we take to be the fluorescence level, the square of the CV is given by
 |
(20) |
where  is the average number of fluorescent proteins,
  is the combined loss rate of premature protein, and
  is the steady-state average transcription rate. The quantity
  is the square of the CV of the mRNA synthesis rate
 |
(21) |
and R is given by
 |
(22) |
The numerator of the right-hand side of Eq. 20 is the noise strength (NS = variance/mean) of the fluorescence. The square of the CV of the total protein abundance, PT = PA + PAM, is
 |
(23) |
where  is the average number of total proteins, and the NI for the total protein abundance is the numerator.
Equations 20 and 23 can be used to identify various sources of noise. In Eq. 23, the first term in the numerator represents the noise due to the random birth-death process of the protein itself, which can be seen as “intrinsic” protein noise. The second term represents the propagated noise from fluctuations in the mRNA abundance. The third term represents the noise due to fluctuations in the state of the promoter. The contribution of this term diminishes as the timescale associated with the promoter fluctuations (1/K) decreases. Likewise, noise in the fluorescence level, Eq. 20, can also be decomposed into three parts. However, now the second two sources also involve the maturation rate, which makes them considerably more complicated and harder to interpret. Previous theoretical studies (14,16,26–28) using various approximation methods have produced similar results. Our work extends these studies by taking into account the maturation process and fluctuations of the state of the promoter.
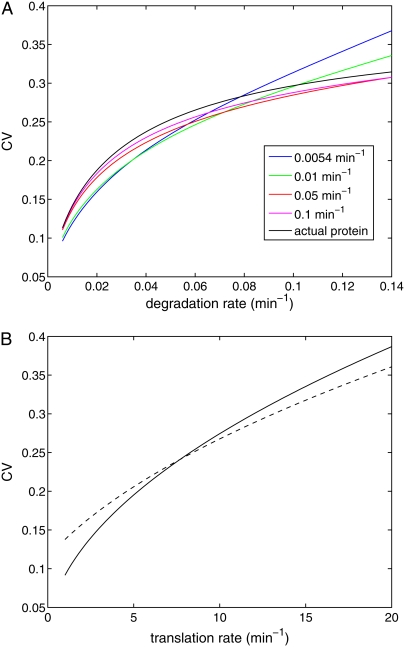
To investigate the effect of the maturation time on fluctuations in protein levels, we initially ignore fluctuations due to transitions in the state of the promoter (i.e., K→∞ in Eqs. 20 and 23) and fix the mRNA synthesis rate at 0.428 min−1. Fig. 6 A shows the CV for the fluorescence as a function of the protein degradation rate δ for various values of the maturation rate km. The parameter values used to produce this plot are given in the figure caption. In this figure, the average transcript number is ∼7, and the protein synthesis rate has been chosen so that with the fastest degradation rate (δ′= 0.14 min−1, 5 min half-life) the average protein abundance is 518. Because stable fluorescent proteins have a half-life of 7 h in yeast (29), much longer than the 2-h yeast doubling time, the depletion of the reporter is due mainly to cell division. Therefore, the slowest degradation rate we consider is δ′ = 0.006 min−1 (115 min half-life). For this case, the average protein abundance is 12,000. The black solid line shown in Fig. 6 A is the CV of the total protein abundance. The other curves are the CVs of the fluorescence level for various different maturation rates. As expected, the fluorescence measurements underestimate the fluctuations in the protein abundance level when the degradation rate is small.
FIGURE 6.
(A) CV for the protein abundance and fluorescence level for various values of the maturation rate km as a function of the protein degradation rate. (B) The CV for the protein abundance (solid curve) and fluorescence level (dashed curve) as a function of translation rate. The transcription rate is also modified to ensure that the total protein level remains constant as the translation rate is varied. In this figure km = 0.0054−1 min and δ′ = 0.069 min−1.
However for sufficiently slow maturation rates and large degradation rates, the fluorescence measurements overestimate the fluctuations in the total protein level. When the degradation rate is small, fluctuations in the total protein abundance are predominantly determined by variability in the transcript level, which in our example is relatively large (CVmRNA = 0.37) due to the low average mRNA abundance (∼7) (13,26). In contrast, fluctuations in the fluorescence level are primarily determined by fluctuations in the immature protein level, which, due to the relatively high mean level of immature protein, are relatively small. However, when the degradation rate is large, the amount of fluorescently competent protein becomes relatively small and fluctuations in the fluorescence level can exceed those in the total protein abundance. To further investigate this effect, we varied the translational efficiency and transcription rate in such a way that the mean protein level remained unchanged (Fig. 6 B). As can be seen, even for the same mean protein level, fluorescence measurements can either overestimate or underestimate variability in the protein level depending on system parameters such as the translational efficiency. Thus protein maturation has nontrivial effects on fluctuations in the fluorescence levels and must be considered carefully when interpreting such data.
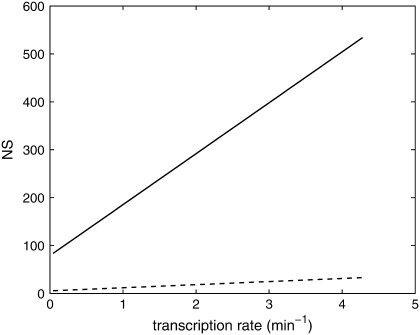
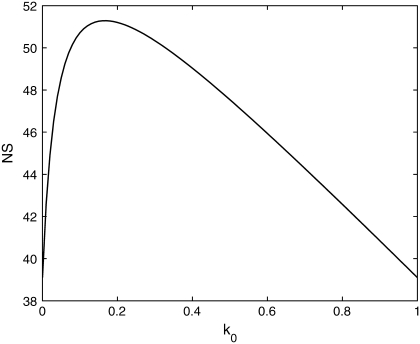
We next investigated the behavior of NS on various system parameters. If fluctuations in the state of the promoter are ignored, then the NS of both the total protein abundance and the fluorescence remains constant as the transcription rate is varied. In contrast, Fig. 7 shows that the NS of both the total protein and fluorescence level increase as a function of the transcription rate when fluctuations at the promoter are included. Note that the NS of the total protein abundance is much more sensitive to changes in the transcription rate than is the fluorescence level. Recent studies have demonstrated both constant (13,14,26) and changing (4,14) NS as transcription rate is varied. From Eq. 23 we can see that when K is small, the transcription rate contributes significantly to the NS. Previous studies (4,14) used varying inducer levels to change the transcription rate. When the parameter k0, which determines the relative rate at which the transcription factor binds to the promoter, is varied from 0 to 1, the NS shows nonmonotonic behavior (Fig. 8). This property might explain the experimental results of Blake et al., in which the NS shows a similar nonmonotonic pattern (4).
FIGURE 7.
NS for the protein abundance and fluorescence level as a function of transcription rate. When the maturation rate and transitions in the promoter state are taken into account, the NS is no longer independent of the transcription rate. Note that the NS of the protein abundance is much more sensitive to changes in the transcription rate than is the fluorescence level. In this figure km = 0.0054−1 min and δ′ = 0.069 min−1.
FIGURE 8.
The NS as the function of k0, which governs the activation rate of the promoter. In this figure km = 0.0054−1 min and δ′ = 0.009 min−1.
The monotonic decrease of the NS as transcription rate increases observed in Raser and O'Shea (14) is probably due to the fact that the promoter considered in this study cannot be efficiently repressed, making the initial rise in the NS seen in Fig. 8 inaccessible to experimental measurement. The theoretical analysis of Raser and O'Shea (14) did not take into account constitutive gene expression from the inactive promoter. This simplification leads to a monotonic decrease of  as a function of k0. This explains why their simulation results did not reveal a nonmonotonic dependence of the NS as a function of protein abundance. The NS also depends nonlinearly on the maturation rate. Therefore, interpreting the source of fluctuations (promoter fluctuations versus maturation time) based on scaling arguments of the fluorescence intensity is not straightforward. The analytical expressions for the NS derived above are consistent with existing experimental evidence (4,13,14,26) and represent a valuable tool to further investigate sources of variability in gene expression.
To investigate how the maturation time and protein degradation rate affect the dynamic properties of the fluctuations, we calculated the ACF for the fluorescence level and total protein abundance (see the Appendix for details). The ACF of the fluorescence level, ACFF(t), for the model described by Eqs. 9–12 is
 |
(24) |
where
 |
(25) |
 |
(26) |
 |
(27) |
 |
(28) |
For comparison, the ACF total protein abundance, ACFP(t), is
 |
(29) |
where
 |
(30) |
 |
(31) |
 |
(32) |
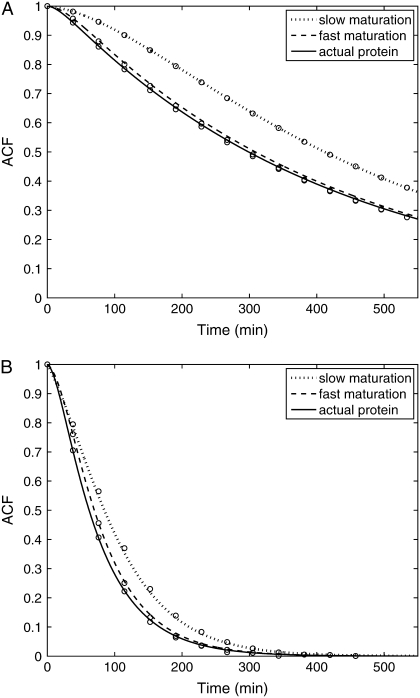
Fig. 9, A and B, shows plots of the ACFs for the total protein abundance and fluorescence level using the same parameter values as those in Fig. 6. In Fig. 9, A δ = 0.009 min−1, corresponding to a half-life of 77 min; and in Fig. 9 B δ = 0.057 min−1, corresponding to a half-life of 12 min. The two different maturation rates are 0.0054 min−1, which corresponds to the rate found from fitting the data, and the faster rate is 0.05 min−1. The circles are ACFs computed from simulations of the full model described by Eqs. 9, 10, and 13–19. The good agreement between the stochastic simulations and the analytical results validates the simple model. Fig. 9 A shows that the maturation rate can contribute significantly to ACF and must be considered when analyzing fluorescent measurements in this way. One way to quantify this effect is to compute the half correlation time (HCT), defined as the time for the ACF to decay to half its initial value. The HCT is easily calculated from Eqs. 24 and 29. In Fig. 9 A, the HCTs for the fluorescence levels with slow and fast maturation kinetics are 412 min and 309 min, respectively, whereas the HCT for the protein concentration is 299 min. In Fig. 9 B, the HCTs for these quantities are 85 min, 70 min, and 62 min, respectively.
FIGURE 9.
(A) The ACF for the protein abundance and fluorescence level of the stable (77 min half-life) reporter. The ACFs for a slowly maturing fluorescent protein (km = 0.0054 min−1, dotted curve) and fast maturing fluorescent protein (km = 0.05 min−1, dashed curves) are compared with the ACF for actual protein abundance (solid curve). The circles are the results from stochastic simulations using the full model. (B) Same as A except the fluorescent protein has a half-life of 12 min. The values of the additional parameters required for the stochastic simulations are K = 1, k0 = 0.85, k1 = 0.15, λ0 = 0.02, and λ1 = 0.5.
DISCUSSION
We developed and analyzed a mathematical model for a novel short-lived fluorescent protein. The model included terms that describe both the ubiquitination and fluorophore maturation processes. The model was shown to successfully capture time-dependent fluorescence measurements made when the reporter was placed under the control of the pheromone-inducible promoter FUS1. Furthermore, the model demonstrates that in addition to the protein half-life, the rate of maturation determines the reporter's ability to track time-dependent changes in transcript levels. The model was next used to demonstrate the feasibility of inferring the mRNA time series from fluorescence measurements. To investigate the robustness of the inference step to fluctuations in transcript and protein levels, a stochastic model was used to generate transcript and fluorescence time series. Again, good agreement was found between the mRNA profiles estimated from the simulated fluorescence data, thereby indicating the feasibility of inferring mRNA profiles from single-cell fluorescence measurements.
Many recent studies have focused on establishing the origins of variability in gene expression observed from isogenic cell populations. Such variability arises from two general sources: “intrinsic noise”, due to the inherent random nature of the biochemical processes necessary for expression of a particular gene, and “extrinsic noise”, which affects all genes (e.g., variation in ribosome or polymerase numbers). Many of these investigations relied on stable fluorescent proteins as reporters of transcriptional activity (3,4,9,14). Therefore, the fluorescent reporters are expressed at levels greater than many endogenous proteins, which can have half-lives of 15 min or shorter. Because intrinsic fluctuations typically decrease with abundance, it is likely these studies underestimate the contribution of intrinsic fluctuations to variability in expression levels. In fact, two recent studies in which fluorescent labels were fused to endogenous proteins revealed that for moderately expressed genes intrinsic and extrinsic noise contribute roughly equally to the total fluctuations and that gene expression noise is correlated with protein function (8,12). However, these two studies did not take into account the maturation time of the fluorescent protein.
To investigate how the maturation process influences variability in fluorescence measurements, we analyzed a stochastic model that takes into account both the maturation rate and protein half-life. Our investigations revealed that the maturation process significantly affects steady-state measures of variability, such as the CV, NS, and dynamic properties of the fluctuations as characterized by the ACF. First, the model demonstrates that fluorescence measurements can either over- or underestimate variability in protein levels, as measured by the CV, depending on the maturation rate and other system parameters. Second, the model revealed that when the maturation process and transitions in the state of the promoter are taken into account, the NS depends on the transcription rate. Additionally, the analytical expression derived for the NS explains the nonmonotonic dependence of this quantity on the activation rate of the promoter and extends and summarizes previous theoretical analyses of the NS (4,14). Finally, the model was used to compute the ACF of both protein and fluorescence levels.
These investigations revealed that the maturation rate significantly affects the rate at which the fluorescence ACF decays. This finding suggests that estimates of intrinsic noise based on measurements of the ACF may underestimate the contribution of intrinsic fluctuations to the total variability (5). Therefore, our results indicate that to accurately determine the magnitude and origins of variability in gene expression from fluorescence measurements requires an approach that combines mathematical analysis with a careful experimental quantification of the intrinsic properties of the reporter protein.
Acknowledgments
X.W. thanks the members of the Collins laboratory and Dr. Nan Hao for helpful discussions.
This work was supported by National Institutes of Health grant R01-GM079271 (T.C.E. and B.E.).
APPENDIX: DERIVATION OF THE COEFFICIENT OF VARIATION AND AUTOCORRELATION FUNCTION
In this Appendix we outline the approach used to compute the CV and ACF for the simplified stochastic model presented in the text.
Illustration of the method: the birth-death process for mRNA abundance
To demonstrate our method, we start from the simple case of a birth-death process for mRNA abundance. Let λ and μ denote the mRNA synthesis and degradation rates, respectively, and let m(t) denote the number of mRNA molecules at time t. To compute the ACF, first we calculate  We assume that at time zero, the system is in steady state. Then
  can be computed as follows
 |
(33) |
 |
(34) |
where  is the joint probability distribution for having i mRNA molecules at time 0 and j mRNA molecules at time t and
  represents the steady-state probability that the system has i mRNA molecules. To simplify the notation,
  is defined as F(t), and
  is defined as
  Using the master equation for this process we find
 |
(35) |
Therefore Eq. 34 can be written as
 |
(36) |
The initial condition for the ordinary differential equation (ODE) given above is  Solving Eq. 36, we find that
  Then
Then  where
where 
The ACF for the protein abundance
To study more general cases we extend the birth-death processes to include protein synthesis:
 |
To compute the ACF of the protein, we need to manipulate the master equation of a two-dimensional Markov chain. Let n(t) denote the number of protein molecules at time t. G(t) and H(t) are defined as  and
and  respectively. Using similar methods as in the previous section we find
 |
(37) |
 |
(38) |
To get the initial conditions for the ODES listed above, we need G(0) and H(0), which are the steady-state second moment for the protein,  and the cross term,
  respectively. These also can be computed from the master equation. The results are
 |
(39) |
 |
(40) |
where ρ and  are
are  and
and  respectively. Solving Eqs. 37 and 38 with initial conditions given by Eqs. 39 and 40 produces the ACF for the protein.
Inclusion of the maturation time and promoter fluctuations
Finally we consider the stochastic model presented in the main text. Let  denote the abundance of mature (fluorescently competent) protein. The variable
  takes on a value of
  when the promoter is active and
  otherwise. Let
  and
and  Here m(t) and n(t) denote the mRNA and immature protein abundances, respectively. Using these definitions, the master equation can be used to derive the following equations for the second moments:
 |
(41) |
 |
(42) |
 |
(43) |
 |
(44) |
where  Again, the master equation can be used to derive the appropriate initial conditions for Eqs. 41–44. Then solving these equations for I(t) produces the results presented in the text.
Editor: Jason M. Haugh.
References
- 1.Hackett, E. A., R. K. Esch, S. Maleri, and B. Errede. 2006. A family of destabilized cyan fluorescent proteins as transcriptional reporters in S. cerevisiae. Yeast. 23:333–349. [DOI] [PubMed] [Google Scholar]
- 2.Ghaemmaghami, S., W. K. Huh, K. Bower, R. W. Howson, A. Belle, N. Dephoure, E. K. O'Shea, and J. S. Weissman. 2003. Global analysis of protein expression in yeast. Nature. 425:737–741. [DOI] [PubMed] [Google Scholar]
- 3.Elowitz, M. B., A. J. Levine, E. D. Siggia, and P. S. Swain. 2002. Stochastic gene expression in a single cell. Science. 297:1183–1186. [DOI] [PubMed] [Google Scholar]
- 4.Blake, W. J., M. Kaern, C. R. Cantor, and J. J. Collins. 2003. Noise in eukaryotic gene expression. Nature. 422:633–637. [DOI] [PubMed] [Google Scholar]
- 5.Rosenfeld, N., J. W. Young, U. Alon, P. S. Swain, and M. B. Elowitz. 2005. Gene regulation at the single-cell level. Science. 307:1962–1965. [DOI] [PubMed] [Google Scholar]
- 6.Volfson, D., J. Marciniak, W. J. Blake, N. Ostroff, L. S. Tsimring, and J. Hasty. 2006. Origins of extrinsic variability in eukaryotic gene expression. Nature. 439:861–864. [DOI] [PubMed] [Google Scholar]
- 7.Wang, X., N. Hao, H. G. Dohlman, and T. C. Elston. 2006. Bistability, stochasticity, and oscillations in the mitogen-activated protein kinase cascade. Biophys. J. 90:1961–1978. [DOI] [PMC free article] [PubMed] [Google Scholar]
- 8.Bar-Even, A., J. Paulsson, N. Maheshri, M. Carmi, E. O'Shea, Y. Pilpel, and N. Barkai. 2006. Noise in protein expression scales with natural protein abundance. Nat. Genet. 38:636–643. [DOI] [PubMed] [Google Scholar]
- 9.Colman-Lerner, A., A. Gordon, E. Serra, T. Chin, O. Resnekov, D. Endy, C. G. Pesce, and R. Brent. 2005. Regulated cell-to-cell variation in a cell-fate decision system. Nature. 437:699–706. [DOI] [PubMed] [Google Scholar]
- 10.Di Talia, S., J. M. Skotheim, J. M. Bean, E. D. Siggia, and F. R. Cross. 2007. The effects of molecular noise and size control on variability in the budding yeast cell cycle. Nature. 448:947–951. [DOI] [PubMed] [Google Scholar]
- 11.Guido, N. J., X. Wang, D. Adalsteinsson, D. McMillen, J. Hasty, C. R. Cantor, T. C. Elston, and J. J. Collins. 2006. A bottom-up approach to gene regulation. Nature. 439:856–860. [DOI] [PubMed] [Google Scholar]
- 12.Newman, J. R., S. Ghaemmaghami, J. Ihmels, D. K. Breslow, M. Noble, J. L. DeRisi, and J. S. Weissman. 2006. Single-cell proteomic analysis of S. cerevisiae reveals the architecture of biological noise. Nature. 441:840–846. [DOI] [PubMed] [Google Scholar]
- 13.Ozbudak, E. M., M. Thattai, I. Kurtser, A. D. Grossman, and A. van Oudenaarden. 2002. Regulation of noise in the expression of a single gene. Nat. Genet. 31:69–73. [DOI] [PubMed] [Google Scholar]
- 14.Raser, J. M., and E. K. O'Shea. 2004. Control of stochasticity in eukaryotic gene expression. Science. 304:1811–1814. [DOI] [PMC free article] [PubMed] [Google Scholar]
- 15.Kepler, T. B., and T. C. Elston. 2001. Stochasticity in transcriptional regulation: origins, consequences, and mathematical representations. Biophys. J. 81:3116–3136. [DOI] [PMC free article] [PubMed] [Google Scholar]
- 16.Paulsson, J. 2004. Summing up the noise in gene networks. Nature. 427:415–418. [DOI] [PubMed] [Google Scholar]
- 17.Hasty, J., J. Pradines, M. Dolnik, and J. J. Collins. 2000. Noise-based switches and amplifiers for gene expression. Proc. Natl. Acad. Sci. USA. 97:2075–2080. [DOI] [PMC free article] [PubMed] [Google Scholar]
- 18.Friedman, N., L. Cai, and X. S. Xie. 2006. Linking stochastic dynamics to population distribution: an analytical framework of gene expression. Phys. Rev. Lett. 97:168302. [DOI] [PubMed] [Google Scholar]
- 19.Suel, G. M., J. Garcia-Ojalvo, L. M. Liberman, and M. B. Elowitz. 2006. An excitable gene regulatory circuit induces transient cellular differentiation. Nature. 440:545–550. [DOI] [PubMed] [Google Scholar]
- 20.Gardner, T. S., C. R. Cantor, and J. J. Collins. 2000. Construction of a genetic toggle switch in Escherichia coli. Nature. 403:339–342. [DOI] [PubMed] [Google Scholar]
- 21.Ozbudak, E. M., M. Thattai, H. N. Lim, B. I. Shraiman, and A. Van Oudenaarden. 2004. Multistability in the lactose utilization network of Escherichia coli. Nature. 427:737–740. [DOI] [PubMed] [Google Scholar]
- 22.Tsien, R. Y. 1998. The green fluorescent protein. Annu. Rev. Biochem. 67:509–544. [DOI] [PubMed] [Google Scholar]
- 23.Bachmair, A., and A. Varshavsky. 1989. The degradation signal in a short-lived protein. Cell. 56:1019–1032. [DOI] [PubMed] [Google Scholar]
- 24.Varshavsky, A. 1996. The N-end rule: functions, mysteries, uses. Proc. Natl. Acad. Sci. USA. 93:12142–12149. [DOI] [PMC free article] [PubMed] [Google Scholar]
- 25.Austin, D. W., M. S. Allen, J. M. McCollum, R. D. Dar, J. R. Wilgus, G. S. Sayler, N. F. Samatova, C. D. Cox, and M. L. Simpson. 2006. Gene network shaping of inherent noise spectra. Nature. 439:608–611. [DOI] [PubMed] [Google Scholar]
- 26.Thattai, M., and A. van Oudenaarden. 2001. Intrinsic noise in gene regulatory networks. Proc. Natl. Acad. Sci. USA. 98:8614–8619. [DOI] [PMC free article] [PubMed] [Google Scholar]
- 27.Scott, M., B. Ingalls, and M. Kaern. 2006. Estimations of intrinsic and extrinsic noise in models of nonlinear genetic networks. Chaos. 16:026107. [DOI] [PubMed] [Google Scholar]
- 28.Raj, A., C. S. Peskin, D. Tranchina, D. Y. Vargas, and S. Tyagi. 2006. Stochastic mRNA synthesis in mammalian cells. PLoS Biol. 4:e309. [DOI] [PMC free article] [PubMed] [Google Scholar]
- 29.Mateus, C., and S. V. Avery. 2000. Destabilized green fluorescent protein for monitoring dynamic changes in yeast gene expression with flow cytometry. Yeast. 16:1313–1323. [DOI] [PubMed] [Google Scholar]


