Abstract
We have characterized the structural and thermotropic properties of one of the most important lipids in the cell membrane of Staphylococcus aureus, lysyl-dipalmitoylphosphatidylglycerol (lysyl-DPPG). applying differential scanning calorimetry and small- and wide-angle x-ray scattering. Microcalorimetry revealed that under physiological conditions (phosphate buffer, 20 mM NaPi, 130 mM NaCl, pH 7.4), the synthetic lysyl-DPPG resembles the features of the parent dipalmitoylphosphatidylglycerol (DPPG) with respect to its melting behavior. However, in contrast to DPPG, lowering the pH did not significantly affect the main transition temperature (∼40°C) of lysyl-DPPG, which can be explained by its difference in protonization because of the lysine group. X-ray experiments yielded the first information on chain packing and morphology of lysyl-DPPG. We found that lysyl-DPPG forms an interdigitated lamellar phase below the chain-melting transition. This can be explained by the large headgroup area of lysyl-DPPG as a result of its charged lysine group, especially if the headgroup is arranged parallel to the bilayer plane. Additionally, lysyl-DPPG degradation products, such as lysine and free fatty acids, had significant influences on the melting behavior and led to a multicomponent melting transition. Our results indicate that the degradation of lysyl-DPPG takes place mainly during the hydration process but also depends on lipid storage time, pH, and thermal treatment. Detailed temperature-resolved experiments at pH 5.0 demonstrated the formation of a lamellar gel phase with tilted hydrocarbon chains and a ripple phase, coexisting with the interdigitated lysyl-DPPG bilayers.
INTRODUCTION
Staphylococcus aureus is a Gram-positive bacterium that colonizes the skin of ∼30% of healthy people (1). Usually, S. aureus is considered a harmless colonizer, but it is, on the other hand, also able to cause a wide spectrum of clinical manifestations (2). It is alarming that the treatment of S. aureus infections has become increasingly difficult because of the inappropriate use of antibiotics (3–6), which already led to resistance against methicillin (methicillin-resistant Staphylococcus aureus (MRSA)) and all other β-lactam antibiotics (5). The MRSA strain was originally found only in hospitals and nursing homes, but now epidemiologists have begun to see more and more cases of MRSA infections among, e.g., native Americans, athletic teams, and schoolchildren. Additionally, in the last decade, infections with MRSA strains have spread all over the world (7). Moreover, resistance against vancomycin, an antibiotic of the last resort, has been increasing rapidly (8), and MRSA is presently the most commonly identified antibiotic-resistant pathogen in many parts of the world, including Europe, America, North Africa, and East Asia (9,10).
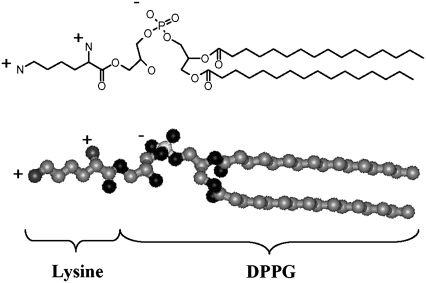
In view of these developments, new antimicrobial agents with novel mechanisms of action are needed. Antimicrobial peptides (AMPs), which are part of our innate immune system and constitute a first line of defense against bacterial invasion, are natural candidates in this search. Because of their nonreceptor-specific mode of action, which enables them to destroy bacterial cell membranes within minutes, resistance will less likely occur (11–16). Yet, S. aureus is able to modify its bacterial cell envelope (17), resulting in reduced susceptibility toward cationic AMPs, induced either by electrostatic repulsion or by general changes to membrane properties such as fluidity (16,18). To this end, two different membrane modifications are suggested for S. aureus. First, Staphylococci may change the net charge of their cell envelope via a modification of teichoic acid with d-alanine. This contributes to an increase of positive charge of the cell surface of S. aureus, leading to a repulsion of the positively charged peptides that correlates with in vitro resistance to a number of AMPs (19). Second, S. aureus can modify phosphatidylglycerol (PG), a major phospholipid of its cytoplasmic membrane, by attaching l-lysine to the PG-headgroup (for structure, see Fig. 1), conferring a positive charge on the lipid (20) and again causing repulsion of cationic AMPs. In support of this notion, Peschel and co-workers (21,22) observed that S. aureus mutants lacking the mprF gene, which is responsible for this modification, were more susceptible to AMP killing. Recently, it was shown that in vitro susceptibility of S. aureus to thrombin-induced platelet microbicidal protein-1 (tPMP) is strongly dependent on the amount of lysyl-phospatidylglycerol (lysyl-PG) present in the outer leaflet of the cytoplasmic membrane (23). In particular, the amount of lysyl-PG in the outer leaflet of a tPMP-resistant strain was found to be 27.3% compared with 18.6% in isogenic tPMP-susceptible S. aureus strains (23). Even higher amounts of lysyl-PG were reported for S. aureus in the stationary phase (57% PG, 38% lysyl-PG, and 5% cardiolipin) (24).
FIGURE 1.
Chemical structure of lysyl-DPPG.
In the 1970s, much work was done to characterize the metabolism of PG and lysyl-PG (25) and changes in S. aureus membrane lipid composition (26–30). Recently, there has been renewed interest in understanding the mode of action of AMPs, addressing the genetic aspect of S. aureus resistance to these peptides (19,21,23,31,32). However, little is known with respect to the physicochemical properties of lysyl-PG bilayers, mainly because of their limited availability, although guidelines for the synthesis of lysyl-PG (33,34) and for extraction of lysyl-PG from S. aureus strains (20,35) have been reported. Apart from monolayer and freeze-etching studies on synthetic didodecanoyl-lysylphosphatidylglycerol (C12-lysyl-PG) and mixtures with didodecanoyl-phosphatidylglycerol (C12-PG) (36,37), no biophysical studies on lysyl-PG are available in literature to the best of our knowledge. Tocanne et al. (36) showed that the molecular packing of C12-lysyl-PG monolayers is pH independent below pH 6.5, whereas the monolayer area expanded as a function of pH > 6.5. Freeze-etching studies showed that C12-lysyl-PG has no well-defined structure in water and in 100 mM NaCl solution (pH 6.0), whereas it forms lamellar structures in the presence of 100 mM  (pH 6.0) because of the binding of
  to the amino group of C12-lysyl-PG, causing electrostatic screening. In the presence of 100 mM
  (pH 6.0) C12-lysyl-PG also had the same chain-melting transition temperature as C12-PG in 100 mM NaCl (36).
The lack of knowledge on lysyl-PG prompted us to characterize the thermotropic behavior and structural properties of fully hydrated liposomal dispersions composed of synthetic lysyl-dipalmitoylphosphatidylglycerol (lysyl-DPPG), applying differential scanning calorimetry (DSC) as well as small- and wide-angle x-ray scattering (SWAXS). Under the present buffer conditions (20 mM Na-phosphate buffer, 130 mM NaCl), lysyl-DPPG showed a complex melting behavior over a broad range of pH. This can be understood by considering the instability of the lipid with respect to storage time, hydration, pH, and temperature treatment, leading to the formation of degradation products such as lyso-DPPG, free fatty acids, and DPPG as well as lysine, which all contribute to the complex behavior. Nevertheless, we were able to single out the putative behavior of “pure” lysyl-DPPG, which appears to form an interdigitated phase below the chain-melting temperature Tm, which occurs at ∼40°C. This packing within the lipid bilayer can be attributed to the large headgroup because of the attached lysine group.
MATERIALS AND METHODS
Lipids
Lysyl-DPPG and DPPG (both sodium salts) were purchased from Avanti Polar Lipids (Alabaster, AL) (purity > 99%) and used without further purification. Lipid stock solutions were prepared by dissolving weighted amounts of the respective lipid in chloroform/methanol (2:1, v/v). DPPG stock solutions were stored at −20°C. All lysyl-DPPG solutions were used immediately.
Preparation of the liposomes
Appropriate amounts of the phospholipid stock solutions were dried under a stream of nitrogen and stored in vacuum overnight to remove the organic solvent. Lysyl-DPPG films were used immediately to avoid possible degradation of the lipid. For preparation of liposomes, the dry lipid films were dispersed in buffer (double-distilled water containing 20 mM Na-phosphate, 130 mM NaCl) and hydrated in the fluid phase Lα at 55°C under intermittent vigorous vortex mixing over a period of 1.5 h. The pH of the buffer was varied in the range from 2.0 to 9.0. The total lipid concentrations of the samples were 1 mg/ml for DSC and 50 mg/ml for x-ray diffraction experiments.
DSC
DSC measurements were performed on a MicroCal VP-DSC high-sensitivity differential scanning calorimeter (MicroCal, Northhampton, MA). Each DSC experiment consisted of three heating and cooling scans in the range of Tm − 20°C to Tm + 20°C at a heating/cooling rate of 0.5°C/min. Samples were thermostated for 30 min before each heating scan and for 1 min before the cooling scans. MicroCal's Origin software (MicroCal) was used for data acquisition and analysis throughout. Calorimetric enthalpies were calculated by integrating the peak areas after baseline adjustment and normalization by the phospholipid mass. The phase-transition temperatures were derived from the peaks of the heat capacity (cP) versus temperature data.
SWAXS
SWAXS experiments were performed on a SWAX camera (System 3, Hecus X-ray Systems, Graz, Austria) allowing simultaneous sampling of diffraction data in the small- and the wide-angle regimes. The x-ray camera was mounted on a sealed-tube generator (GE-Seifert, Ahrensburg, Germany) operating at 2 kW. CuKα radiation (λ = 1.542 Å) was selected using a Ni filter in combination with a pulse height discriminator. The x-ray beam size was set to 0.5 mm × 3.5 mm (V × H). The SWAXS patterns were recorded in the wave vector (q = 4π sinθ/λ) regimes of 10−3 Å−1 < q < 1 Å−1 (SAXS), and 1.2 Å−1 < q < 2.7 Å−1 (WAXS) using two linear, one-dimensional, position-sensitive detectors (PSD 50, Hecus X-ray Systems, Graz, Austria). Calibration in the small-angle region was performed with silver stearate (d = 48.68 Å) and in the wide-angle region with p-bromo-benzoic acid (38). Samples were filled in 1-mm thin-walled quartz-glass capillaries in tight thermal contact with a programmable Peltier unit. Samples were equilibrated for 10 min at each temperature before measurement. Exposure times for SAXS were 2400 s and for WAXS, 4800 s.
Background-corrected SAXS data were analyzed using the global analysis program, which is based on a full q-range fitting technique (39–41). In brief, the scattered intensity of randomly oriented bilayers is modeled as
 |
(1) |
taking the instrumental resolution into account. F(q) refers to the form factor and is given by the Fourier transform of the electron density modulation across the lipid bilayer. The electron density profile was modeled by the summation of two Gaussians, one accounting for the electron-dense PO4 group and a second for the electron-poor region of the terminal methyl group of the hydrocarbon chains. No significant contribution to the overall scattered intensity can be expected from the lysine group because of its negligible contrast with respect to the surrounding aqueous buffer. Consequently, the obtained distance between the electron density peaks dHH corresponds closely to the distance between the two PO4 groups across the bilayer.
In the case of coexisting interdigitated and noninterdigitated gel phases, the scattered intensity is given by a linear superposition of the individual phases (42)
 |
(2) |
where Ini and Ii refer to the scattered intensity of the noninterdigitated phase and interdigitated phase, respectively; φI is the apparent fraction of the interdigitated phase. Note that φI reflects the scaling of the two contributions in Eq. 2, not necessarily their true proportion. The model for the electron density profile of interdigitated phases and its applicability have been discussed in detail previously (42,43).
From the background and noise-corrected gel phase WAXS patterns (42), we obtained information on the molecular packing of the hydrocarbon chains and in particular on the lateral area per lipid, which was calculated according to (44)
 |
(3) |
for tilted hydrocarbon chains, and (45)
 |
(4) |
for the interdigitated bilayers, where q20 and q11 refer to the peak positions of the (2,0) and (1,1) hydrocarbon chain reflections. The tilt angle θt can be estimated from
 |
(5) |
where  (46,47) is the hydrocarbon chain length of tilted bilayers. The hydrocarbon chain length of nontilted bilayers can be roughly determined from
  (48), where nCH2 is the number of hydrocarbons per acyl chain.
High-performance thin-layer chromatography
Purity and possible degradation of the phospholipids were checked by high-performance thin-layer chromatography (HPTLC) before and after all measurements. For this purpose lipids were spotted onto Silica 60 F 254 HPTLC plates (Merck, Darmstadt, Germany) and developed using chloroform/methanol/water/acetic acid (65:25:4:1, v/v) (Lactan, Graz, Austria, purity pro analysis). Pure lipids were dissolved in chloroform/methanol (2:1, v/v) and directly used as standards. Molybdenic acid (Lactan, purity p.a.) was used to visualize all phospholipids and fatty acid after exposure to heat. In addition, lysyl-DPPG and lysine, a degradation product of lysyl-DPPG, have been identified with ninhydrin (Merck, Darmstadt, Germany) staining.
RESULTS AND DISCUSSION
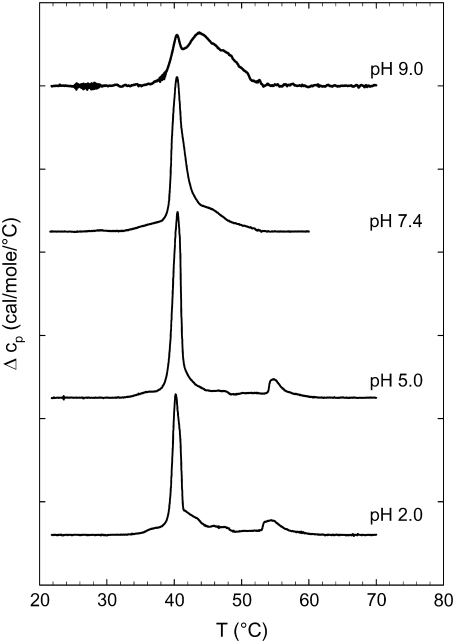
Fig. 2 gives an overview of the DSC heating scans of lysyl-DPPG at various pH values showing a highly complex melting behavior. Besides pH 9.0, all thermograms showed a pretransition around 37°C and 38°C. The major heat capacity peak, which can be attributed to the chain melting or main transition, occurred within a narrow temperature interval with maxima between 40.2°C and 40.5°C. Additionally, we also found several posttransitional events between 43.0°C and 60.0°C. A broad peak next to the main transition was observed at all pH values, whereas an additional rather cooperative peak at 54.8°C was recorded at lower pH values (2.0 and 5.0). Transition temperatures and enthalpies are listed in Table 1. Because of the inherent instability of lysyl-DPPG, the presence of possible degradation products from lysyl-DPPG have to be considered, which may contribute to this intricate thermotropic behavior.
FIGURE 2.
DSC heating scans for lysyl-DPPG at various pH values. Data taken from the first heating scans with a scan rate of 0.5°C/min. Heat capacity curves for pH 9.0, pH 7.4, pH 5.0, and pH 2.0 (top to bottom) were shifted horizontally for better graphic representation. The arrows indicate the pretransition.
TABLE 1.
Transition temperatures and enthalpies of the pretransition (Tpre, Hpre), of the main-transition (Tm, Hm), and of the posttransition (Tpost, Hpost) of lysyl-DPPG at various pH values
| pH value | Tpre (°C) | Hpre (kcal/mol) | Tm (°C) | Hm (kcal/mol) | Tpost (°C) | Hpost (kcal/mol) |
|---|---|---|---|---|---|---|
| 2.0 | 38.0 | 0.5 | 40.2 | 5.0 | 54.4 | 3.7 |
| 5.0 | 37.0 | 0.4 | 40.5 | 8.0 | 54.8 | 2.4 |
| 7.4 | 38.0 | 0.9 | 40.4 | 9.3 | 44.1 | 2.6 |
| 9.0 | – | – | 40.4 | 2.6 | 43.0 | 8.0 |
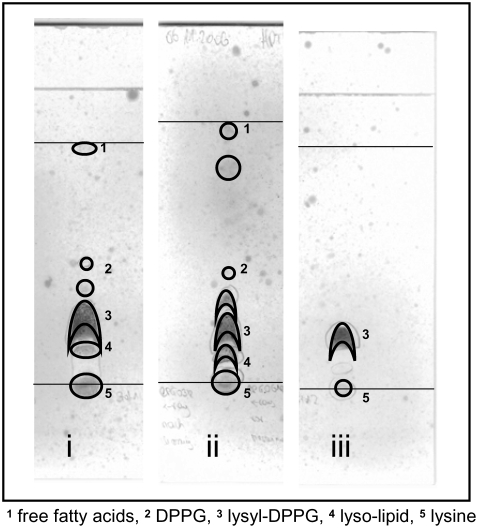
We have, therefore, performed HPTLC to identify possible degradation products. Fig. 3 shows the results before and after an experiment at pH 5.0. All TLCs gave evidence of degradation products of lysyl-DPPG, even the lysyl-DPPG standard (Fig. 3 iii) stored at −20°C. The latter exhibited in addition to the lysyl-DPPG spot a second spot at the start, which could also be visualized with ninhydrin, indicating the presence of residual lysine. Compared with the lysyl-DPPG standard, samples measured before (Fig. 3 i) and after (Fig. 3 ii) the experiment showed additional spots below the solvent front, above the lysyl-DPPG spot, and between the start and lysyl-DPPG. Taking palmitic acid as a standard, we could identify the spot close to the solvent front as free fatty acids that could be clearly visualized on heating. Because lyso-lipids are less polar, which leads to a decreased retention time, we can identify the spot between the start and the lysyl-DPPG as lyso-DPPG. The spot above lysyl-DPPG can be identified as DPPG as evidenced from the pure phospolipid standard showing a higher retention time for DPPG than for the lysyl-DPPG standard.
FIGURE 3.
Detection of degradation products of lysyl-DPPG before (i) and after (ii) x-ray experiments at pH 5.0 compared with lysyl-DPPG standard (iii); detection with molybdenic acid.
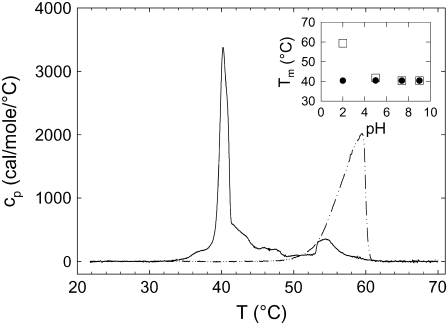
We first consider the effect of DPPG clearly observed in the TLCs and also expected from previous experiments showing that the lysine group from the lysyl-PG headgroup is cleaved easily (35). Watts et al. (49,50) showed that the single proton at the phosphate group of PGs can be titrated (pKa ∼ 2.9), which results in charge neutral lipid bilayers at low pH with a high Tm and fully anionic PG membranes above pH 7.0 with a considerably lower Tm. In contrast, lysyl-PG remains positively charged at all pH values (36) and consequently should not change its melting behavior in the studied pH range. Thus, the observed posttransitions (Fig. 2) could be, in principle, related to the presence of DPPG. Indeed, at pH 2.0, DPPG showed a melting transition temperature very close to the posttransition peak, suggesting such a correlation (Fig. 4). However, the Tm of DPPG rapidly approached the Tm of lysyl-DPPG as a function of pH (Fig. 4, inset). Additionally, at pH 5.0 the posttransition peak exhibits the same characteristics as at pH 2.0 (Fig. 2). Thus, DPPG-enriched domains seem not to be the major contributors to the posttransitional events, at least for pH ≥ 5.0.
FIGURE 4.
DSC heating scans for lysyl-DPPG (solid line) and DPPG (dash-dotted line) at pH 2.0. Data taken from the first heating scans with a scan rate of 0.5°C/min. The inset shows the pH dependence of the main transition temperature (Tm) of lysyl-DPPG (•) and DPPG (□).
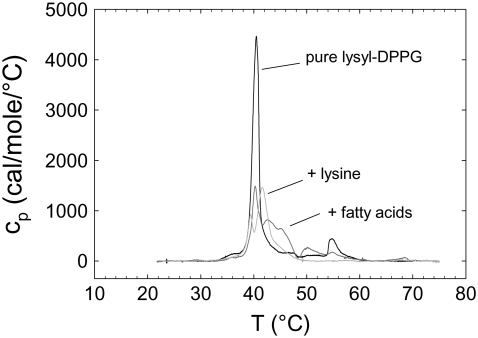
In a next step we tested the influence of the degradation products palmitic acid and lysine on the thermotropic behavior of lysyl-DPPG. The DSC scans showed in both cases a splitting of the main-transition peak and an enhancement of the posttransition enthalpy on account of the main transition enthalpy (Fig. 5). At pH 5.0, the addition of palmitic acid had a stronger effect on the posttransitions than the addition of lysine. Lysine caused only a splitting of the main transition peak, whereas palmitic acid enhanced the posttransition events. Interestingly, our experiments with added palmitic acid and lysine closely match our findings for different pH values (compare Figs. 2 and 5). Addition of palmitic acid showed a similar thermotropic behavior as measuring “pure” lysyl-DPPG at pH 2.0 and 5.0. This can be rationalized by the fact that the hydrolysis of fatty acids is catalyzed under acidic conditions. Thus, one might conclude that the observed effects at low pH values reported in Fig. 2 are mainly caused by the presence of a free fatty acid, which are formed during the hydration process. In fact, saturated fatty acids are known to stabilize lipid bilayers leading to an increase of the Tm from experimental studies on phosphatidylcholines (51–53). In this picture, the lyso-DPPG thereby generated would, because of its extreme cone-like molecular shape, dissolve into the aqueous environment, where it most likely aggregates into spherical micelles (54). At pH 9.0, in turn, there is no hydrolysis of fatty acids, but the lysine group dissociates from the PG headgroup. Therefore, we think that the splitting of the main transition peak as we observed for lysyl-DPPG at pH 9.0 is mainly influenced by the presence of lysine (Fig. 2).
FIGURE 5.
First DSC heating scans of lysyl-DPPG at pH 5.0 (black line) and in the presence of 35 mol % palmitic acid (dark gray line) and 60 mol % lysine (light gray line), respectively.
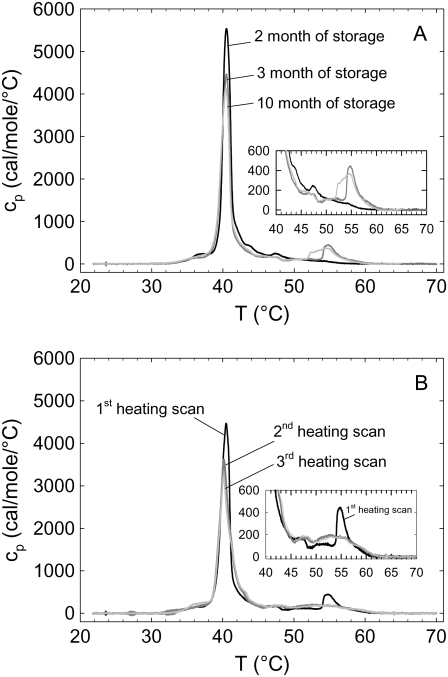
Further DSC experiments showed that the presence of the posttransition is also strongly dependent on the lipid storage time, supported by the absence of posttransition events in experiments at pH 5.0 with lysyl-DPPG after 2 months of storage at −20°C and its presence in experiments at pH 5.0 after 3 months of storage (Fig. 6 A). Fig. 6 B shows the thermograms for several consecutive heating scans at pH 5.0, demonstrating the effect of thermal history. Although the main transition peak was shifted only slightly to lower temperatures, subsequent heating led to a significant decrease of its enthalpy and a smearing out of the posttransitions. These experiments strongly indicate the formation of degradation products as a function of time and temperature. Thus, we may conclude that the thermotropic behavior of lysyl-DPPG is pH independent but is influenced by its degradation products, whose formation depends on the pH of the aqueous solution among other factors such as storage time, thermal history, and hydration in particular. In any case, our DSC experiments show that the lysyl-DPPG vesicles contain different domains, which melt at different temperatures. The remaining question is whether we are able to differentiate among the different domains and thereby possibly identify pure lysyl-DPPG and its overall properties.
FIGURE 6.
(A) First DSC heating scans for different lysyl-DPPG storage times at pH 5.0. The black line represents lysyl-DPPG after 2 months of storage, the dark gray line after 3 mo, and the light gray line after 10 months of storage at −20°C. (B) Three heating scans of lysyl-DPPG at pH 5.0. The black line represents the first heating scan, the dark gray line the second heating scan, and the light gray line the third heating scan.
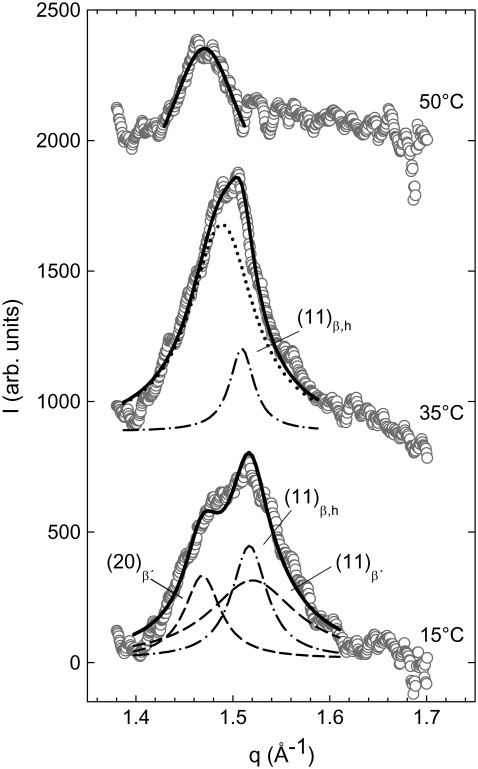
To address this issue, we performed x-ray diffraction experiments in the temperature range of 2°C to 60°C at pH 5.0. The WAXS patterns of lysyl-DPPG as a function of temperature are presented in Fig. 7. Below 40°C, we clearly observed the superposition of two different chain packing lattices originating from two different domains, very similar to our recent results on distearoylphosphatidylglycerol (DSPG) (42). At 15°C, the pattern consisted of two sharp and one broad peak. Following a previous interpretation given by Pabst et al. (42) for coexisting gel phase domains, the sharp peak at q = 1.47 Å−1 and the broad peak at q = 1.52 Å−1 correspond to the (2,0) and the (1,1) reflection of tilted hydrocarbon chains of a Lβ′ phase (55,56). The sharp peak at q = 1.52 Å−1, which occurred at the same position as the broad peak, originates from a hexagonally packed acyl chain that could result from an interdigitated phase LβI as in the cases of DSPG (42) or dihexadecyl PC (57), for example. At 35°C, the WAXS pattern can be understood as a superposition of one sharp and one broad peak. The broad peak appeared at q = 1.49 Å−1 and can be assigned in combination with the corresponding SAXS pattern (see below) and DSC data (Table 1) to a ripple phase. The sharp peak at q = 1.51 Å−1 appeared at almost the same position as the peak of the hexagonally packed chains at 15°C and exhibited almost the same width. This suggests that it originates from the same phase. Finally, at 50°C, the system is not completely in the Lα phase, as indicated by chain correlation peak. In this case, however, the peak corresponds, to a single phase and can be assigned to a ripple phase (see below). These findings agree well with our DSC results (Fig. 2) demonstrating the presence of two major phases below ∼40°C. At this temperature, the phase with the larger correlation length (sharp peak) melts, but the other phase persists (broad peak) up to ∼55°C, above which no more WAXS peak could be observed (data not shown).
FIGURE 7.
WAXS patterns of lysyl-DPPG at various temperatures. At 15°C the Lβ′ (dashed lines) and interdigitated phases LβI (dash-dotted line) coexist. The peaks can be ascribed to the (2,0)β′ and (1,1)β′ peak of the Lβ′ phase and the (1,1) peak of the LβI phase. During heating the Lβ′ phase disappears, and at 35°C coexistence of the LβI (dash-dotted line) and a Pβ′ (dotted line) phase is observed. At 50°C the wide-angle pattern indicates a Pβ′ phase.
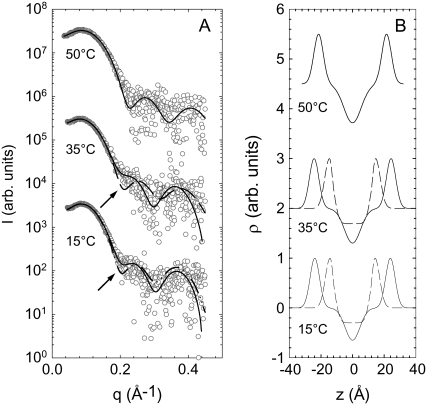
Fig. 8 shows the corresponding SAXS patterns. At all temperatures, we observed a diffuse and smooth modulation of the scattered intensity, which originates from positionally uncorrelated bilayers, possibly unilamellar vesicles. The absence of positional correlations between bilayers can be attributed to the positively charged lysyl-DPPG membranes, leading to electrostatic repulsion. More interestingly, however, the scattered intensities showed no minimum between the first and second side maxima at 15°C and 35°C. This closely resembles our previous findings for DSPG (42) suggesting the presence of an interdigitated phase that gives rise to additional diffuse intensities at q-values around 0.2 Å−1, corresponding to distances of ∼30 Å. Other possible scenarios leading to this additional scattering would be the formation of asymmetric bilayers (58,59), in-plane correlated lipid domains, or a short-wavelength bilayer modulation (42). However, if the system displays asymmetric bilayers, it is very unlikely that the two bilayer leaflets exhibit independent melting as observed in our DSC experiments (Figs. 2, 5, and 6). Correlated in-plane domains, on the other hand, can also be discarded in view of their overall domain size of ∼140 Å, determined from the wide-angle peak widths (Fig. 7), being much larger than the 30 Å deduced from the SAXS patterns. Finally, a 30 Å wavelength modulation gives no significant contribution to the scattered intensity of positionally uncorrelated bilayers, as discussed previously (42). This leaves us with the scenario of coexisting LβI and gel phase domains below 40°C, which is strongly supported by the observed WAXS patterns (Fig. 7). The corresponding electron density profiles, obtained from the global fits, are presented in Fig. 8 B. Above 40°C, the SAXS pattern clearly exhibited a minimum between the first and second side maxima of the scattered intensity (Fig. 8 A). This does, however, not imply the presence of a single, uniform phase. The original LβI domains melt at ∼40°C and therefore increase significantly in membrane thickness. In fact, they will display a membrane thickness that is very close to that of the coexisting ripple phase domain. Thus, their contribution gets averaged out in the scattering experiment over the whole sample, yielding SAXS patterns that appear as if they would be created by a single phase.
FIGURE 8.
(A) SAXS patterns of lysyl-DPPG (pH 5.0) at various temperatures. At 15°C and 35°C Lβ′ phase and LβI phases coexist as evident by the additional intensity at q ∼ 0.2 Å−1 indicated by the arrow. Solid lines correspond to best global fits. Dashed lines at 15°C and 35°C show the fit results using a single bilayer model, which show no satisfactory agreement with the experimental data. At 50°C, the SAXS pattern could be fitted with a single component model (solid line). (B) Corresponding electron-density profiles (solid line, noninterdigitated phase; dashed line, interdigitated phase).
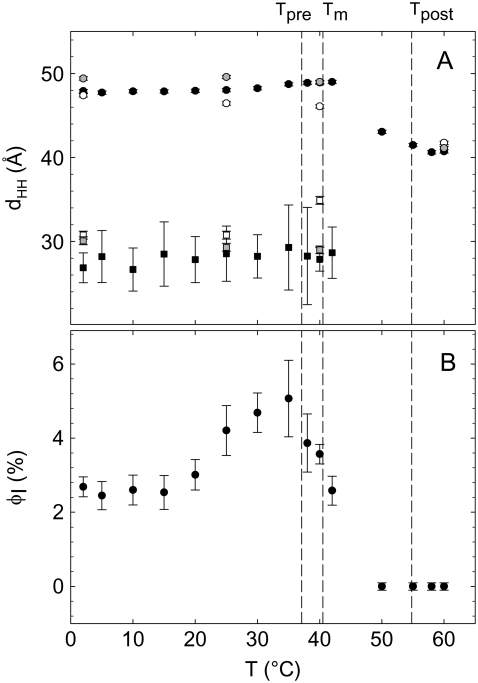
Fig. 9 A shows the head-to-headgroup distance, dHH, determined from the global fits to the SAXS patterns over the complete temperature range studied. The dHH value of the Lβ′ phase remained more or less constant below the pretransition temperature Tpre. The slight increase between Tpre and Tm together with the corresponding WAXS pattern (Fig. 8 A) strongly suggests the presence of a ripple phase, Pβ′, which will yield an artificial increase of the membrane thickness because of its long wavelength modulation as discussed previously (42). The dHH value of the interdigitated phase was close to 30 Å and remained constant below the Tm. Fig. 9 B shows the apparent fraction of the LβI phase as a function of temperature. We have at present no explanation for the observed increase of φI between 20°C and 35°C. More important, however, in the present context is the observed φI decrease above 35°C signifying a melting of the LβI domains in agreement with our DSC data (Fig. 2). Additionally, we calculated the lateral area per chain from the WAXS peak positions obtaining ∼20 Å2, yielding A ∼ 80 Å2 for the LβI phase.
FIGURE 9.
(A) Temperature dependence of dHH of the noninterdigitated phase (circles) and the interdigitated phase (squares) of lysyl-DPPG at pH 5.0 in the presence of 130 mM NaCl (solid symbols), 300 mM NaCl (shaded symbols), and 1 M NaCl (open symbols). (B) Apparent percentage of interdigitation (φI (%)) during heating in the presence of 130 mM NaCl.
Above the Tm, dHH showed a continuous decrease, previously observed for many phospholipid-water systems, that is usually attributed to the melting of the hydrocarbon chains (42,46). In the present case the situation is, however, more complex because of the coexistence of gel (Pβ′) and Lα phases. The detected membrane thickness is therefore given by a sample average over the two coexisting domains, which cannot be separated and therefore appear as a uniform structure.
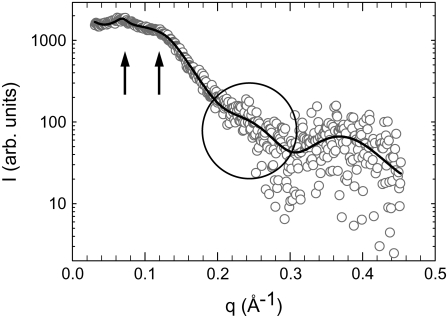
Having in mind that the coexisting domains possibly display different surface charge densities, we have performed SWAXS experiments with increasing NaCl concentrations to 300 mM and 1 M. If our assumption were true, increase of ionic strength could be expected to lead to differential screening of the electrostatic repulsion for the coexisting structures. Indeed, we observed Bragg peaks at both salt concentrations (Fig. 10), signifying positional correlations between the lipid bilayers in contrast to the pure diffuse scattering at 130 mM NaCl (Fig. 8). We were able to index these Bragg peaks on a single lamellar lattice of d ∼ 88 Å. At the same time we also observed additional diffuse scattering around wave vectors of 0.2 Å−1 (Fig. 10). From our experiments at low salt content (Fig. 8), we suggest that this particular contribution to the scattered intensity is caused by the presence of an LβI phase. Consequently, increasing NaCl content progressively screens electrostatic repulsion of the noninterdigitated bilayer, and the LβI bilayers remain positionally uncorrelated. This notion is also confirmed by the good agreement of a global fit to the x-ray scattering data (Fig. 10). Moreover, we found from DSC scans that the transition temperatures are not significantly affected by the presence of higher salt amounts (data not shown). Additionally, the membrane thickness of all phases is influenced by increasing NaCl content (Fig. 9 A). Thus, we modified only positional correlations significantly but not the overall membrane structure and thermotropic behavior by increasing the ionic strength of the aqueous solution.
FIGURE 10.
SAXS pattern of lysyl-DPPG (pH 5.0) in the presence of 1 M NaCl at 25°C. The arrows indicate the first and second order of a lamellar structure (d = 88.2 Å). Additionally, there is diffuse scattering around q ∼ 0.2 Å−1 (circled region) indicating the presence of interdigitated bilayers.
This result is of particular importance in showing that the coexisting domains behave, to a large extent, independently. Thus, they are not only phase separated but also not coupled to each other. This allows us to address them independently. The LβI phase is most likely dominated by pure lysyl-DPPG, which can be rationalized in view of its large polar head with the attached lysine group (Fig. 1), which in this way is able to accommodate parallel to the lipid surface because of packing constraints between the headgroups and the hydrocarbon chains (see Pabst et al. (42) and references therein). Similarly, other lipids with large headgroups have also been found to form interdigitated phases (60,61).
We think the second domain is the one that is mostly affected by the degradation products and displays the phase sequence Lβ′, Pβ′, Lα as a function of temperature. From the SAXS data analysis, we estimated an average hydrocarbon chain tilt angle, θt, of ∼10° (see Materials and Methods), which is small compared with its usual value in phosphatidylcholines (44) or PGs (42). Recently, a similarly low value was reported for cardiolipin in the subgel phase (47). Using the WAXS peak positions, we further calculated the lateral area per lipid, obtaining 42 Å2. This value is again rather small compared with other lipids. For DPPG, we previously found an area per lipid of 46.7 Å2 (42), and 47.2 Å2 was reported for phosphatidylcholines (44). However, we know from HPTLC experiments about the presence of free fatty acids (Fig. 5) at pH 5.0. It is highly feasible that these free fatty acids modify the balance between headgroup and hydrocarbon chain areas by increasing the latter quantity. In some way, this may be viewed as filling up the voids that would be created if the lysyl-DPPG lipids were forced to orient their chains vertically with respect to the membrane surface in a noninterdigitated bilayer. The second effect of accumulated fatty acids is the stabilization of the bilayer, which leads to a higher transition temperature (Fig. 2). Although this seems to be the most dominant effect, we cannot exclude a possible influence from free lysine and lyso-DPPG.
CONCLUSION
Under the present experimental conditions, lysyl-DPPG showed a highly complex melting behavior. We observed a pretransition between 37°C and 38°C, a main transition between 40.2°C and 40.5°C, and posttransitions that varied most significantly. By use of HPTLC, the degradation products have been identified as lysine, palmitic acid, lyso-DPPG, and DPPG (see Fig. 3), where free lysine was already present in the lysyl-DPPG stock. In DSC experiments, which should show the influence of the individual degradation products at pH 5.0, lysine led to a splitting of the main transition of lysyl-DPPG but no additional posttransitional events, very similar to our observation for lysyl-DPPG at pH 9.0. Because the lysine group can easily dissociate from the PG headgroup (35) under alkaline conditions, whereas hydrolysis of fatty acids is hampered, we suggest that lysine affects the thermotropic behavior of lysyl-DPPG most prominently at pH 9.0. On the other hand, at pH 2.0 the hydrolysis of fatty acids is catalyzed, but the lysine group is stabilized. This is consistent with our experiments on lysyl-DPPG on the addition of palmitic acid at pH 5.0. There too we found a splitting of the main transition, but the additional posttransitional events were more distinctive. Thus, the thermotropic behavior of lysyl-DPPG is pH independent but depends on its degradation products, which have a pH dependence. Additionally, the formation of degradation products is a matter of storage time, hydration, and thermal history (Figs. 3 and 6).
Variation of NaCl content in the aqueous buffer allowed us to demonstrate that lysyl-DPPG forms two major domains, which can be regarded as phases, as they have no effect on each other's overall properties. Thus, the posttransitional events could be related to bilayers forming an Lβ′ phase below 37°C and a Pβ′ phase up to its melting, which depends on the content and nature of the various lysyl-DPPG degradation products. The major part of the sample most likely formed an interdigitated phase at low temperatures and underwent a chain-melting transition at ∼40°C. We think that this phase corresponds to pure lysyl-DPPG, although we can not exclude the presence and influence of impurities. The interdigitated phase can be explained by the large headgroup area of lysyl-DPPG-attached lysine group to the PG-headgroup (Fig. 1), considering that the headgroup is arranged parallel to the lipid bilayer plane. In summary, we derived the following structural parameters for the LβI phase: dHH ∼ 28.5 Å, dC ∼ 20.5 Å, A ∼ 80 Å2, implying ∼20 Å2 per hydrocarbon chain.
Thus, although lysyl-PGs are inherently instable, as known from previous studies (25,35), we have been able to identify and determine their macromolecular aggregation properties and thermotropic behavior. A direct outcome of this study is the delicate interplay of pH and the degradation products formed with lysyl-DPPG bilayers. Nevertheless, our present work also demonstrates pathways that make it possible to address the properties of lysyl-PG model membranes directly. The propensity of lysyl-PG to adopt an interdigitated lipid structure may have some implications for the interaction with AMPs. Recently, we have shown that several membrane-active peptides induce a peptide-associated quasiinterdigitated phase where the hydrocarbon chains are shielded from water by the peptide in the gel phases of negatively charged PG and in long-chain PC model membranes (43). It has been suggested that, although this structure was observed only in the gel phase, its effects may propagate into the physiologically more relevant fluid phase in terms of membrane thinning and membrane perturbation. Current efforts in our laboratory are devoted to investigate whether this assumption also holds for peptides acting on lysyl-PG bilayers. These studies will be of interest with respect to the design of novel AMPs targeting lysyl-DPPG.
Acknowledgments
The authors thank Peter Laggner for helpful discussions.
This work has been supported by the Austrian Science Funds FWF (grant No. P18100-B10 to A.H.).
Editor: Thomas J. McIntosh.
References
- 1.Casewell, M. W., and R. L. Hill. 1986. The carrier state: methicillin-resistant Staphylococcus aureus. J. Antimicrob. Chemother. 18(Suppl A):1–12. [DOI] [PubMed] [Google Scholar]
- 2.Lowy, F. D. 1998. Staphylococcus aureus infections. N. Engl. J. Med. 339:520–532. [DOI] [PubMed] [Google Scholar]
- 3.Swartz, M. N. 1997. Use of antimicrobial agents and drug resistance. N. Engl. J. Med. 337:491–492. [DOI] [PubMed] [Google Scholar]
- 4.Tomasz, A. 1994. Multiple-antibiotic-resistant pathogenic bacteria. A report on the Rockefeller University Workshop. N. Engl. J. Med. 330:1247–1251. [DOI] [PubMed] [Google Scholar]
- 5.Lowy, F. D. 2003. Antimicrobial resistance: the example of Staphylococcus aureus. J. Clin. Invest. 111:1265–1273. [DOI] [PMC free article] [PubMed] [Google Scholar]
- 6.Lohner, K., and E. Staudegger. 2001. Are we on the threshold of the post-antibiotic era? In Development of Novel Antimicrobial Agents: Emerging Strategies. K. Lohner, editor. Horizon Scientific Press, Wymondham, Norfolk, UK. 1–15.
- 7.Enserink, M. 2003. Infectious diseases. Resistant staph finds new niches. Science. 299:1639–1641. [DOI] [PubMed] [Google Scholar]
- 8.Tenover, F. C., J. W. Biddle, and M. V. Lancaster. 2001. Increasing resistance to vancomycin and other glycopeptides in Staphylococcus aureus. Emerg. Infect. Dis. 7:327–332. [DOI] [PMC free article] [PubMed] [Google Scholar]
- 9.Tiemersma, E. W., S. L. Bronzwaer, O. Lyytikainen, J. E. Degener, P. Schrijnemakers, N. Bruinsma, J. Monen, W. Witte, and H. Grundman. 2004. Methicillin-resistant Staphylococcus aureus in Europe, 1999–2002. Emerg. Infect. Dis. 10:1627–1634. [DOI] [PMC free article] [PubMed] [Google Scholar]
- 10.Fridkin, S. K., H. A. Hill, N. V. Volkova, J. R. Edwards, R. M. Lawton, R. P. Gaynes, and J. E. McGowan, Jr. 2002. Temporal changes in prevalence of antimicrobial resistance in 23 US hospitals. Emerg. Infect. Dis. 8:697–701. [DOI] [PMC free article] [PubMed] [Google Scholar]
- 11.Boman, H. G. 1991. Antibacterial peptides: key components needed in immunity. Cell. 65:205–207. [DOI] [PubMed] [Google Scholar]
- 12.Lehrer, R. I., and T. Ganz. 1999. Antimicrobial peptides in mammalian and insect host defence. Curr. Opin. Immunol. 11:23–27. [DOI] [PubMed] [Google Scholar]
- 13.Hancock, R. E., and D. S. Chapple. 1999. Peptide antibiotics. Antimicrob. Agents Chemother. 43:1317–1323. [DOI] [PMC free article] [PubMed] [Google Scholar]
- 14.Ganz, T., and R. I. Lehrer. 2001. Antimicrobial peptides in innate immunity. In Development of Novel Antimicrobial Agents: Emerging Strategies. K. Lohner, editor. Horizon Scientific Press, Wymondham, Norfolk, UK. 139–147.
- 15.Boman, H. G. 2003. Antibacterial peptides: basic facts and emerging concepts. J. Intern. Med. 254:197–215. [DOI] [PubMed] [Google Scholar]
- 16.Lohner, K., and S. E. Blondelle. 2005. Molecular mechanisms of membrane perturbation by antimicrobial peptides and the use of biophysical studies in the design of novel peptide antibiotics. Comb. Chem. High Throughput Screen. 8:241–256. [DOI] [PubMed] [Google Scholar]
- 17.Peschel, A. 2002. How do bacteria resist human antimicrobial peptides? Trends Microbiol. 10:179–186. [DOI] [PubMed] [Google Scholar]
- 18.Pokorny, A., and P. F. Almeida. 2005. Permeabilization of raft-containing lipid vesicles by delta-lysin: a mechanism for cell sensitivity to cytotoxic peptides. Biochemistry. 44:9538–9544. [DOI] [PubMed] [Google Scholar]
- 19.Peschel, A., M. Otto, R. W. Jack, H. Kalbacher, G. Jung, and F. Gotz. 1999. Inactivation of the dlt operon in Staphylococcus aureus confers sensitivity to defensins, protegrins, and other antimicrobial peptides. J. Biol. Chem. 274:8405–8410. [DOI] [PubMed] [Google Scholar]
- 20.Gould, R. M., and W. J. Lennarz. 1967. Biosynthesis of aminoacyl derivatives of phosphatidylglycerol. Biochem. Biophys. Res. Commun. 26:512–515. [DOI] [PubMed] [Google Scholar]
- 21.Peschel, A., R. W. Jack, M. Otto, L. V. Collins, P. Staubitz, G. Nicholson, H. Kalbacher, W. F. Nieuwenhuizen, G. Jung, A. Tarkowski, K. P. van Kessel, and J. A. van Strijp. 2001. Staphylococcus aureus resistance to human defensins and evasion of neutrophil killing via the novel virulence factor MprF is based on modification of membrane lipids with l–lysine. J. Exp. Med. 193:1067–1076. [DOI] [PMC free article] [PubMed] [Google Scholar]
- 22.Staubitz, P., H. Neumann, T. Schneider, I. Wiedemann, and A. Peschel. 2004. MprF-mediated biosynthesis of lysylphosphatidylglycerol, an important determinant in staphylococcal defensin resistance. FEMS Microbiol. Lett. 231:67–71. [DOI] [PubMed] [Google Scholar]
- 23.Mukhopadhyay, K., W. Whitmire, Y. Q. Xiong, J. Molden, T. Jones, A. Peschel, P. Staubitz, J. Adler-Moore, P. J. McNamara, R. A. Proctor, M. R. Yeaman, and A. S. Bayer. 2007. In vitro susceptibility of Staphylococcus aureus to thrombin-induced platelet microbicidal protein-1 (tPMP-1) is influenced by cell membrane phospholipid composition and asymmetry. Microbiology. 153:1187–1197. [DOI] [PubMed] [Google Scholar]
- 24.O'Leary, W. M., and S. G. Wilkinson. 2007. Gram-positive bacteria. In Microbial Lipids. C. Ratledge, and S. G. Wilkinson, editors. Academic Press, London. 117–201.
- 25.Gould, R. M., and W. J. Lennarz. 1970. Metabolism of phosphatidylglycerol and lysyl-phosphatidylglycerol in Staphylococcus aureus. J. Bacteriol. 104:1135–1144. [DOI] [PMC free article] [PubMed] [Google Scholar]
- 26.Houtsmuller, U. M., and L. L. van Deenen. 1965. On the amino acid esters of phosphatidyl glycerol from bacteria. Biochim. Biophys. Acta. 106:564–576. [DOI] [PubMed] [Google Scholar]
- 27.Joyce, G. H., R. K. Hammond, and D. C. White. 1970. Changes in membrane lipid composition in exponentially growing Staphylococcus aureus during the shift from 37 to 25 C. J. Bacteriol. 104:323–330. [DOI] [PMC free article] [PubMed] [Google Scholar]
- 28.Short, S. A., and D. C. White. 1970. Metabolism of the glycosyl diglycerides and phosphatidylglucose of Staphylococcus aureus. J. Bacteriol. 104:126–132. [DOI] [PMC free article] [PubMed] [Google Scholar]
- 29.Short, S. A., and D. C. White. 1971. Metabolism of phosphatidylglycerol, lysylphosphatidylglycerol, and cardiolipin of Staphylococcus aureus. J. Bacteriol. 108:219–226. [DOI] [PMC free article] [PubMed] [Google Scholar]
- 30.Haest, C. W., J. De Gier, J. A. O. P. Kamp, P. Bartels, and L. L. van Deenen. 1972. Changes in permeability of Staphylococcus aureus and derived liposomes with varying lipid composition. Biochim. Biophys. Acta. 255:720–733. [DOI] [PubMed] [Google Scholar]
- 31.Bayer, A. S., R. Prasad, J. Chandra, A. Koul, M. Smriti, A. Varma, R. A. Skurray, N. Firth, M. H. Brown, S. P. Koo, and M. R. Yeaman. 2000. In vitro resistance of Staphylococcus aureus to thrombin-induced platelet microbicidal protein is associated with alterations in cytoplasmic membrane fluidity. Infect. Immun. 68:3548–3553. [DOI] [PMC free article] [PubMed] [Google Scholar]
- 32.Bayer, A. S., L. I. Kupferwasser, M. H. Brown, R. A. Skurray, S. Grkovic, T. Jones, K. Mukhopadhay, and M. R. Yeaman. 2006. Low-level resistance of Staphylococcus aureus to thrombin-induced platelet microbicidal protein 1 in vitro associated with qacA gene carriage is independent of multidrug efflux pump activity. Antimicrob. Agents Chemother. 50:2448–2454. [DOI] [PMC free article] [PubMed] [Google Scholar]
- 33.Tocanne, J. F., H. M. Verheij, J. A. den Kamp, and L. L. van Deenen. 1974. Chemical and physicochemical studies of lysylphosphatidylglycerol derivatives. Occurrence of a2′ yields 3′ lysyl migration. Chem. Phys. Lipids. 13:389–403. [DOI] [PubMed] [Google Scholar]
- 34.Nesbitt III, J. A., and W. J. Lennarz. 1968. Participation of aminoacyl transfer ribonucleic acid in aminoacyl phosphatidylglycerol synthesis. I. Specificity of lysyl phosphatidylglycerol synthetase. J. Biol. Chem. 243:3088–3095. [PubMed] [Google Scholar]
- 35.Foreman-Wykert, A. K., J. Weiss, and P. Elsbach. 2000. Phospholipid synthesis by Staphylococcus aureus during (sub)lethal attack by mammalian 14-kilodalton group IIA phospholipase A2. Infect. Immun. 68:1259–1264. [DOI] [PMC free article] [PubMed] [Google Scholar]
- 36.Tocanne, J. F., P. H. Ververgaert, A. J. Verkleij, and L. L. van Deenen. 1974. A monolayer and freeze-etching study of charged phospholipids. I. Effects of ions and pH on the ionic properties of phosphatidylglycerol and lysylphosphatidylglycerol. Chem. Phys. Lipids. 12:201–219. [DOI] [PubMed] [Google Scholar]
- 37.Tocanne, J. F., P. H. Ververgaert, A. J. Verkleij, and L. L. van Deenen. 1974. A monolayer and freeze-etching study of charged phospholipids. II. Ionic properties of mixtures of phosphatidylglycerol and lysylphosphatidylglycerol. Chem. Phys. Lipids. 12:220–231. [DOI] [PubMed] [Google Scholar]
- 38.Ohura, K., S. Kashino, and M. Haisa. 1972. The crystal and molecular structure of p-bromobenzoic acid. Bull. Chem. Soc. Japan. 45:2651–2652. [Google Scholar]
- 39.Pabst, G., M. Rappolt, H. Amenitsch, and P. Laggner. 2000. Structural information from multilamellar liposomes at full hydration: full q-range fitting with high quality x-ray data. Phys. Rev. E Stat. Phys. Plasmas Fluids Relat. Interdiscip. Topics. 62:4000–4009. [DOI] [PubMed] [Google Scholar]
- 40.Pabst, G., R. Koschuch, B. Pozo-Navas, M. Rappolt, K. Lohner, and P. Laggner. 2003. Structural analysis of weakly ordered membrane stacks. J. Appl. Cryst. 63:1378–1388. [Google Scholar]
- 41.Pabst, G. 2006. Global properties of biomimetic membranes: perspectives on molecular features. Biophys. Rev. and Letters. 1:57–84. [Google Scholar]
- 42.Pabst, G., S. Danner, S. Karmakar, G. Deutsch, and V. A. Raghunathan. 2007. On the propensity of phosphatidylglycerols to form interdigitated phases. Biophys. J. 93:513–525. [DOI] [PMC free article] [PubMed] [Google Scholar]
- 43.Sevcsik, E., G. Pabst, A. Jilek, and K. Lohner. 2007. How lipids influence the mode of action of membrane-active peptides. Biochim. Biophys. Acta. 1768:2586–2595. [DOI] [PubMed] [Google Scholar]
- 44.Tristram-Nagle, S., R. Zhang, R. M. Suter, C. R. Worthington, W. J. Sun, and J. F. Nagle. 1993. Measurement of chain tilt angle in fully hydrated bilayers of gel phase lecithins. Biophys. J. 64:1097–1109. [DOI] [PMC free article] [PubMed] [Google Scholar]
- 45.McIntosh, T. J., and S. A. Simon. 1986. Area per molecule and distribution of water in fully hydrated dilauroylphosphatidylethanolamine bilayers. Biochemistry. 25:4948–4952. [DOI] [PubMed] [Google Scholar]
- 46.Pabst, G., J. Katsaras, V. A. Raghunathan, and M. Rappolt. 2003. Structure and interactions in the anomalous swelling regime of phospholipid bilayers. Langmuir. 19:1716–1722. [Google Scholar]
- 47.Lewis, R. N., D. Zweytick, G. Pabst, K. Lohner, and R. N. McElhaney. 2007. Calorimetric, x-ray diffraction, and spectroscopic studies of the thermotropic phase behavior and organization of tetramyristoyl cardiolipin membranes. Biophys. J. 92:3166–3177. [DOI] [PMC free article] [PubMed] [Google Scholar]
- 48.Sun, W. J., S. Tristram-Nagle, R. M. Suter, and J. F. Nagle. 1996. Structure of gel phase saturated lecithin bilayers: temperature and chain length dependence. Biophys. J. 71:885–891. [DOI] [PMC free article] [PubMed] [Google Scholar]
- 49.Watts, A., K. Harlos, W. Maschke, and D. Marsh. 1978. Control of the structure and fluidity of phosphatidylglycerol bilayers by pH titration. Biochim. Biophys. Acta. 510:63–74. [DOI] [PubMed] [Google Scholar]
- 50.Watts, A., K. Harlos, and D. Marsh. 1981. Charge-induced tilt in ordered-phase phosphatidylglycerol bilayers evidence from x-ray diffraction. Biochim. Biophys. Acta. 645:91–96. [DOI] [PubMed] [Google Scholar]
- 51.Langner, M., and S. Hui. 2000. Effect of free fatty acids on the permeability of 1,2-dimyristoyl-sn-glycero-3-phosphocholine bilayer at the main phase transition. Biochim. Biophys. Acta. 1463:439–447. [DOI] [PubMed] [Google Scholar]
- 52.Schullery, S. E., T. A. Seder, D. A. Weinstein, and D. A. Bryant. 1981. Differential thermal analysis of dipalmitoylphosphatidylcholine–fatty acid mixtures. Biochemistry. 20:6818–6824. [DOI] [PubMed] [Google Scholar]
- 53.Koynova, R. D., B. G. Tenchov, P. J. Quinn, and P. Laggner. 1988. Structure and phase behavior of hydrated mixtures of l-dipalmitoylphosphatidylcholine and palmitic acid. Correlations between structural rearrangements, specific volume changes and endothermic events. Chem. Phys. Lipids. 48:205–214. [DOI] [PubMed] [Google Scholar]
- 54.Israelachvili, J. 1991. Intermolecular and Surface Forces. Academic Press, London.
- 55.Tardieu, A., V. Luzzati, and F. C. Reman. 1973. Structure and polymorphism of the hydrocarbon chains of lipids: a study of lecithin-water phases. J. Mol. Biol. 75:711–733. [DOI] [PubMed] [Google Scholar]
- 56.Small, D. M., editor. 1986. Handbook of Lipid Research: the Physical Chemistry of Lipids, from Alkanes to Phospholipids. Plenum Press, New York.
- 57.Laggner, P., K. Lohner, G. Degovics, K. Muller, and A. Schuster. 1987. Structure and thermodynamics of the dihexadecylphosphatidylcholine-water system. Chem. Phys. Lipids. 44:31–60. [DOI] [PubMed] [Google Scholar]
- 58.Brzustowicz, M. R., and A. T. Brunger. 2005. X-ray scattering from unilamellar lipid vesicles. J. Appl. Cryst. 38:126–131. [Google Scholar]
- 59.Kucerka, N., J. Pencer, J. N. Sachs, J. F. Nagle, and J. Katsaras. 2007. Curvature effect on the structure of phospholipid bilayers. Langmuir. 23:1292–1299. [DOI] [PMC free article] [PubMed] [Google Scholar]
- 60.Winter, I., G. Pabst, M. Rappolt, and K. Lohner. 2001. Refined structure of 1,2-diacyl-P-O-ethylphosphatidylcholine bilayer membranes. Chem. Phys. Lipids. 112:137–150. [DOI] [PubMed] [Google Scholar]
- 61.Tristram-Nagle, S., R. N. Lewis, J. W. Blickenstaff, M. Diprima, B. F. Marques, R. N. McElhaney, J. F. Nagle, and J. W. Schneider. 2005. Thermodynamic and structural characterization of amino acid-linked dialkyl lipids. Chem. Phys. Lipids. 134:29–39. [DOI] [PMC free article] [PubMed] [Google Scholar]


