Abstract
Airway hyperresponsiveness is a major characteristic of asthma and is believed to result from the excessive contraction of airway smooth muscle cells (SMCs). However, the identification of the mechanisms responsible for airway hyperresponsiveness is hindered by our limited understanding of how calcium (Ca2+), myosin light chain kinase (MLCK), and myosin light chain phosphatase (MLCP) interact to regulate airway SMC contraction. In this work, we present a modified Hai-Murphy cross-bridge model of SMC contraction that incorporates Ca2+ regulation of MLCK and MLCP. A comparative fit of the model simulations to experimental data predicts 1), that airway and arteriole SMC contraction is initiated by fast activation by Ca2+ of MLCK; 2), that airway SMC, but not arteriole SMC, is inhibited by a slower activation by Ca2+ of MLCP; and 3), that the presence of a contractile agonist inhibits MLCP to enhance the Ca2+ sensitivity of airway and arteriole SMCs. The implication of these findings is that murine airway SMCs exploit a Ca2+-dependent mechanism to favor a default state of relaxation. The rate of SMC relaxation is determined principally by the rate of release of the latch-bridge state, which is predicted to be faster in airway than in arteriole. In addition, the model also predicts that oscillations in calcium concentration, commonly observed during agonist-induced smooth muscle contraction, cause a significantly greater contraction than an elevated steady calcium concentration.
INTRODUCTION
Airway hyperresponsiveness is a characteristic of asthma and is generally ascribed to the excessive contraction of airway smooth muscle cells (SMCs). Although individual cells may generate more force, this change may also occur because of an increase in SMC mass, an increased sensitivity to agonists, or a reduction in elastic recoil forces (1). To determine the role of the individual SMC in airway hyperresponsiveness, we focused on the cellular mechanisms that regulate and produce airway SMC contraction.
Airway SMC contraction is initiated by a rise in intracellular Ca2+ concentration ([Ca2+]i), which, in turn, sequentially activates Ca2+-calmodulin and myosin light chain kinase (MLCK). MLCK phosphorylates the regulatory light chain of myosin (rMLC), allowing myosin to enter the cross-bridge cycle with actin to generate a sliding force to contract the SMC. Relaxation of the SMCs essentially requires a decrease in [Ca2+]i, but the extending force is passive and is provided by the elastic recoil of the lung parenchyma coupled with breathing.
Although this basic idea of airway SMC contraction is well accepted, there are a number of important processes that have major implications for the regulation of SMC contractility. First, in normal airway and arteriole SMCs, the increase in [Ca2+]i does not occur as a uniform steady-state increase but occurs as a series of oscillatory Ca2+ waves that propagate along the SMCs (2–5). Second, the contractile sensitivity of the SMCs to [Ca2+]i can be substantially regulated by the stimulating agonist (6). Third, and perhaps the most unexpected specialization of mouse airway SMCs, sustained elevated [Ca2+]i induces airway relaxation (5). Although the Ca2+ oscillations initiate contraction, it is the relative Ca2+-dependent activities of MLCK and myosin light chain phosphatase (MLCP) that determine the sustained contractile state.
In normal mouse lung slices, the addition of agonists initiates contraction of the airways (MCh and 5-HT) and arterioles (5-HT only) by initiating Ca2+ oscillations in the SMCs (3,4). However, to determine the contribution of Ca2+ sensitization to the contractile state, it is necessary to maintain the [Ca2+]i at a steady state. This was achieved by simultaneously treating the lung slices with caffeine and ryanodine. Caffeine activates the ryanodine receptor, allowing ryanodine access to lock the ryanodine receptor in an open state. This treatment results in emptying the internal Ca2+ stores of the airway and arteriole SMCs, which leads to a sustained influx of Ca2+, presumably via store-operated channels. By varying the external calcium concentration, the internal [Ca2+]i of the SMCs can be experimentally clamped.
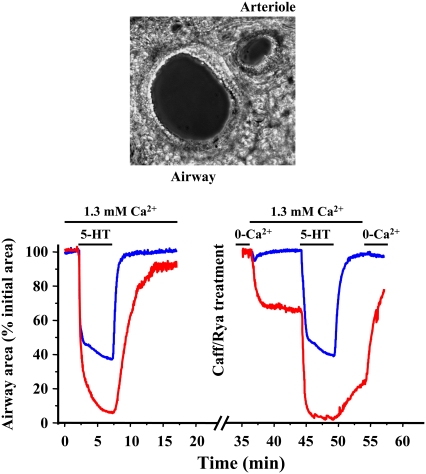
As expected with this caffeine-ryanodine treated lung slice, [Ca2+]i-induced contraction increases in both the airway and arteriole SMCs. The first key result was that in the presence of this sustained increase in [Ca2+]i, the airway SMCs subsequently relaxed (Fig. 1). However, under identical conditions, the adjacent arteriole SMCs remained contracted (Fig. 1). To explain this Ca2+-induced airway relaxation, we hypothesized that the increase in [Ca2+]i activates airway MLCP (either directly or indirectly) on a relatively slow timescale, compared to the Ca2+ activation of MLCK, to reduce rMLC phosphorylation and hence force production. By contrast, we proposed the arteriole MLCP to be insensitive to Ca2+.
FIGURE 1.
Response of an airway and arteriole in a lung slice to agonist and high [Ca2+]i. The experimental data show the simultaneous changes in airway and arteriole lumen size in response to 5-HT or changes in extracellular Ca2+ and were obtained using the methods detailed in Bai and Sanderson (5). Normal airways and arterioles were contracted with 1 μM 5-HT. The same lung slice was subsequently treated with caffeine (20 mM) and ryanodine (50 μM) for 5 min to allow the [Ca2+]i to be experimentally altered. The caffeine and ryanodine were removed by washing, and the lung slice was equilibrated with zero external Ca2+. The [Ca2+]i of individual SMCs was monitored by loading the cells with the Ca2+ reporter dye Oregon green and observing the emitted fluorescence with confocal microscopy as described by Bai and Sanderson (5). (Top) A phase-contrast image of the airway and arteriole in a lung slice surrounded by alveolar parenchyma. Changes in the area of airway or arteriole lumen are measured to indicate SMC contraction. Image width = 440 μm. (Bottom left) In response to agonist (200 nM 5-HT), both the airway (blue) and arteriole (red) reduced their lumen area (normalized to initial area). In caffeine/ryanodine-treated lung slices (bottom right), the airway and arteriole are fully relaxed in 0 Ca2+. The addition of external Ca2+ in Hanks' balanced salt solution (1.3 mM Ca2+) raises internal Ca2+ and induces contraction of both the airway and arteriole. However, the airway relaxes, whereas the arteriole continues to contract to reach a steady state. Upon the addition of agonist, the airway fully recontracts (similar to the normal slice), whereas the arteriole displays a further contraction. Removal of the agonist allows the relaxation of both airway and arteriole even though the [Ca2+]i remains high. Removal of extracellular Ca2+ allows the arteriole to fully relax.
The second key result was that upon the subsequent exposure to a contractile agonist (5-HT), the relaxed airway recontracted whereas the arteriole displayed a further contraction even though the [Ca2+]i in either SMC type remained high and unchanged (Fig. 1). Therefore, we proposed that the agonist also stimulates a Ca2+-independent inhibition of MLCP (in both the airway and arteriole) to enhance force production.
Here we develop a mathematical model to analyze how the Ca2+- and agonist-dependent activity of the MLKC and MLCP are responsible for the final rMLC phosphorylation and SMC contraction. The model is based on the experimental responses of airway and arteriole SMCs in lung slices under steady-state Ca2+ conditions and explicitly considers the length changes of SMCs during contraction. Because the agonist simultaneously stimulates both Ca2+ oscillations and increases in Ca2+ sensitivity, it is difficult to determine experimentally the relative importance of each mechanism in the regulation of SMC contraction and how these may be altered to result in hyperresponsiveness. Consequently, we used the model to evaluate the influence of Ca2+ oscillations on airway and arteriole SMC. Previous mathematical models have concentrated on airway SMC. They relied on force generation data of isolated SMCs under isometric conditions or measurement of the resistance of the whole airway and did not include the regulation of MLCP (7–13).
THE MODEL
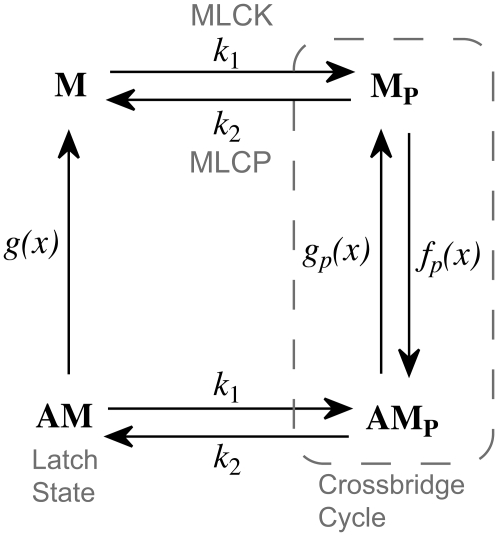
To understand the complex dynamics of SMC contraction, we expanded the Hai-Murphy cross-bridge model (7) to include Ca2+ activation of MLCK, Ca2+ activation of MLCP, and agonist inactivation of MLCP. Our model is based on the modification of the Hai-Murphy cross-bridge model by Mijailovich et al. (7–11). A schematic diagram of the cross-bridge model is shown in Fig. 2. The key parameters of this model relevant to our experimental data are k1, the rate of rMLC phosphorylation by MLCK, and k2, the rate of rMLC dephosphorylation by MLCP. Both are assumed independent of whether or not the myosin is attached to actin (8).
FIGURE 2.
Schematic diagram of the model. M denotes myosin, AM denotes myosin attached to actin, and a subscript p denotes the phosphorylated state of the rMLC. Active force generation results from cycling between Mp and AMp. However, cycling cross-bridges can be dephosphorylated into the latch state, AM, where they can neither exert active force nor relax quickly. We assume that the rate of phosphorylation of myosin is unaffected by its attachment to actin. k1 is the rate of M and AM phosphorylation by MLCK, and k2 is the rate of M and AM dephosphorylation by MLCP. The rate constants fp(x), gp(x), and g(x) are position dependent, as described in The Model.
rMLC phosphorylation
k1: the rate of rMLC phosphorylation by MLCK
The coupling of Ca2+ to the sliding of actin and myosin filaments occurs via the activation of MLCK by calmodulin, which itself is activated by the binding of Ca2+. In SMCs, contraction is slow enough that the interaction of Ca2+ with calmodulin and MLCK can be assumed to be at quasi steady state. Let c denote the [Ca2+]i in the cytoplasm. Assuming that calmodulin is activated by four Ca2+ ions, we model the combined activity of calmodulin and MLCK on rMLC phosphorylation, k1, as
 |
k2: the rate of rMLC dephosphorylation by MLCP
Our experimental results suggest that the rate of rMLC dephosphorylation, k2, depends on both [Ca2+]i (c) and agonist concentration (a) and is time dependent. Therefore we introduced an additional differential equation for P, the fraction of activated MLCP:
 |
(1) |
 |
(2) |
where
 |
(3) |
 |
(4) |
and τp is a time constant.
The exponent 2 in Eq. 2 was chosen to give good agreement with experimental data; an exponent of 1 did not fit the data as well (sum of squared residuals 1.5 and 4.3, respectively, F-ratio test p < 0.01). Since the mechanisms of agonist-induced Ca2+ sensitization (or inhibition of MLCP) are not fully understood and can vary with the agonist, tissue, and SMC type (14), we adopted the strategy of omitting the detailed reactions and assuming simple direct relationships with plausible functional forms. Thus, for example, the activation of MLCP is assumed to depend directly on the calcium concentration, c, not on the concentration of calcium/calmodulin or through any other intermediate reactions. Consequently, we used a Hill function to model a generic increasing dependence on c. Similarly, inactivation of MLCP by agonist is assumed to depend directly on the agonist concentration, even though this is a drastic simplification. We are aware that there are a number of possible intermediate reactions between the agonist and its effect on MLCP, but for this model it suffices to assume that the rate of inactivation of MLCP is an increasing function of the agonist concentration, a.
The cross-bridge model
The attachment of myosin to actin depends on its phosphorylated state and its position with respect to the binding site on the actin filament. We denote by the local coordinate x the distance between the binding site on the actin filament and the equilibrium position of the cross-bridge. The distribution of cross-bridges at x is determined by
 |
(5) |
 |
(6) |
 |
(7) |
subject to the constraint M + Mp + AMp + AM = 1, where v(t) is the velocity of the actin filament relative to the myosin filament, defined to be positive during shortening. The rate constants fp(x), gp(x), and g(x) are based on Mijailovich et al. (8):
 |
 |
 |
where h, the largest displacement at which a cross-bridge can become attached to the thin filament, is 15.6 nm (8,9,15). For simplicity we define h = 1 unit length = 15.6 nm.
We assume that an attached cross-bridge, independent of its phosphorylation state, generates a force that depends on its displacement. The total force generated by SMCs is proportional to the first moment of the AM and AMp distribution
 |
(8) |
Force balance
We assume that the SMCs are organized in a ring around an airway of radius R(t) and exert a tangential force. We also assume that this ring is embedded in a linearly elastic, isotropic homogeneous sheet, with the airway positioned at the center. For simplicity we assume radial symmetry and define the displacement ur = R − R0, where R0 is the radius at rest (i.e., when the SMCs are exerting no force). At all times we neglect inertia and assume that the force exerted by the SMCs is balanced by the force exerted by the elastic sheet; the balance of these forces determines the airway radius. Thus, the transient behavior exhibited by the contraction (as seen in Fig. 3) is due entirely to the cross-bridge kinetics.
FIGURE 3.
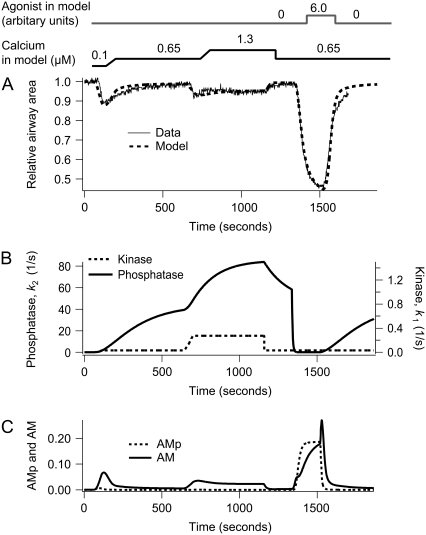
Contraction of airway SMCs in response to step changes in sustained high [Ca2+]i (c) in the absence and presence of agonist (a). (A) Experimental data (solid) with the model fit (dashed). (B) The corresponding MLCP (k2) and MLCK activity (k1) induced by changes in c and a. (C) The corresponding fractions of AM and AMp. The simulation was done by changing c as follows: c = 0.1 μM for 1 min, c = 0.65 μM for 10 min, c = 1.3 μM for 8 min, c = 0.65 μM for the remaining time. To simulate the experimental change in c, every step increase in c required 1 min to reach the next level of [Ca2+]i. The agonist concentration a is increased from 0 to 6.0 after 22 min.
For small displacements the components of the strain tensor are (16)
 |
(9) |
Assuming Hooke's law for the elastic medium, the stress components are
 |
(10) |
 |
(11) |
and σθr = σrθ = 0, where λ and μ are the two Lamé constants that characterize the elastic medium.
If Nc SMCs are arranged serially around an airway of radius, R, with each exerting a tangential force, F, the total radial force is NcF/R. Note that, as the radius increases, the total radial force decreases although the tangential force remains the same. Thus the boundary conditions for the stress are
 |
(12) |
In mechanical equilibrium, the equation for conservation of linear momentum is
 |
(13) |
 |
(14) |
which, together with the boundary conditions Eq. 12, gives
 |
(15) |
Note that the displacement is now independent of the radius of the airway. The 1/R dependence in the expression for the radial strain cancels out with the radial dependence in the solution of the linear momentum equation. Although this is true for the simple radially symmetric case we consider here, it is not true in general for more complicated geometries. Similarly, this solution relies on the assumption of linear elasticity.
All results are given as relative area (i.e., fraction of airway (arteriole) area divided by the area at rest), which is determined by the balance between the tethering of the medium surrounding the airway and the force exerted by the SMCs. The radius at rest, R(0), is determined by the steady-state cross-bridge distribution at given initial agonist and calcium concentrations. The relative area is then R.A.(t) = πR(t)2/πR(0)2. Using Eqs. 8 and 15 and R(0) = NcL0/2π with L0 the length of an SMC for F = 0, we obtain
 |
(16) |
where we introduced the dimensionless parameter β = πκ/(L0μ).
Contraction velocity
As the airway radius changes, the velocity of the cross-bridges must also be calculated as a function of time, as the contraction velocity affects the force generated by the SMC. Isometric solutions are qualitatively different from the solutions shown here (computations not shown).
We assume that each SMC contains N contractile units, arranged serially, and that each contractile unit contracts from both ends and therefore has a shortening velocity of 2hv(t). Thus the SMC has shortening velocity N2hv(t). Using Eq. 15, we obtain a relation between velocity and force
 |
(17) |
With Eq. 8 the velocity reads
 |
(18) |
Here we introduce the dimensionless parameter γ = πκ/(2μNh) = L0/(2Nh)β. The quantity L0/N corresponds approximately to the length of a contractile unit. Integration by parts gives a formula to compute the velocity
 |
(19) |
Note that this computation of the contraction velocity relies on the assumption that the force exerted by the SMCs is exactly balanced by the surrounding elastic sheet (Eq. 15).
Thus, the solution procedure is as follows: for a given calcium concentration we substitute the expression for the contraction velocity (Eq. 19) into the cross-bridge partial differential equations, solve numerically (using a midpoint implicit upwind scheme, as described in the Appendix), and thus calculate the force generated by the SMCs. The change in radius is then calculated from the force balance equation (Eqs. 15 and 16).
RESULTS
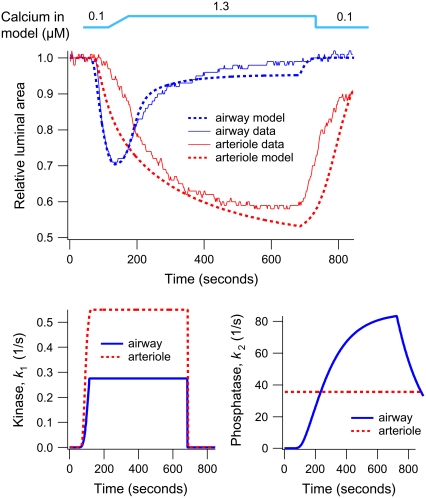
Model parameters are listed in Table 1. They were obtained from the literature or by fitting to the experimental data from Bai and Sanderson (5) reproduced here in Figs. 3, 4, and 6 (see Appendix). The arteriole model was fitted to the data shown in the lower right panel of Fig. 1 and the data of Fig. 6. The experimental data in Figs. 5 and 7 were not used in the fitting process for the airway but agree very well with the model results.
TABLE 1.
Parameter values used in the modified cross-bridge model
| Parameter values determined by fit to the experimental data | ||
|---|---|---|
| Airway model | ||
| parameters | Values in our model | 95% range |
| k1a | 0.5962 s−1 | [0.34, 0.88] |
| k1b | 1.35 μM | [1.1731, 1.5272] |
| kon1 | 0.000125 | [0.0001, 0.0002] |
| kon2 | 0.8988 μM | [0.7551, 1.0377] |
| koff1 | 0.4629 | [0.3992, 0.5132] |
| koff2 | 20.035 | [17.7670, 21.7317] |
| τp | 156.9 s | [132.8425, 171.6565] |

|
242.14 s−1 | [164.6281, 337.2143] |
| g1 | 0.1211 s−1 | [0.1123, 0.1281] |
| Arteriole model | ||
| parameters | Values in our model | 95% range |
| kon2 | 0.000174 μM | [0.0001, 0.0006] |
| koff2 | 120.84 | [107.6515, 136.7734] |
| τp | 564.67 s | [533.6403, 595.8495] |

|
76.23 s−1 | [73.6590, 78.8780] |
| g1 | 0.03 s−1 | [0.0291, 0.0311] |
| k1b | 0.7 μM | From Geguchadze et al. (31) and Fajmut et al. (32) |
| Parameter values taken from Mijailovich et al. (8) | |||
| fp1 | 0.88 s−1 | gp1 | 0.22 s−1 |
| Other parameter values | |||
| β | 2 | γ | 44.87 |
FIGURE 4.
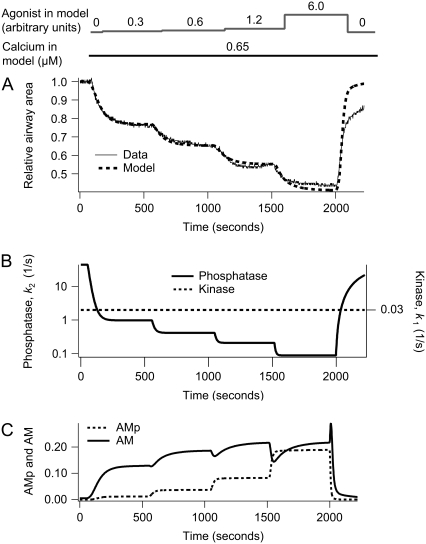
Dependence of airway SMCs contraction on agonist concentration at [Ca2+]i = 0.65 μM. (A) Experimental data (solid) with model fit (dashed). (B) The corresponding MLCP (k2) and MLCK activity (k1). (C) The corresponding fractions of AM and AMp. The agonist concentration, a, is initially 0 for 1 min and sequentially increases in steps up to 0.3, 0.6, 1.2, 6.0 at 8 min intervals. After 8 min at the highest agonist concentration, a, is returned to 0 for the remainder of the simulation.
FIGURE 6.
Contraction of an airway and arteriole pair during sustained high [Ca2+]i in the absence of agonist. The upper plot shows experimental (solid) and model data (dashed) for the airway (blue) and arteriole (red). The lower plot shows a comparison of the corresponding kinase (left) and phosphatase (right) activity of the airway (blue) and arteriole (red). In these simulations, [Ca2+]i (c) is initially increased to 1.3 μM over a duration of 1 min. Near the end of the simulation, c is returned to 0.1 μM.
FIGURE 5.
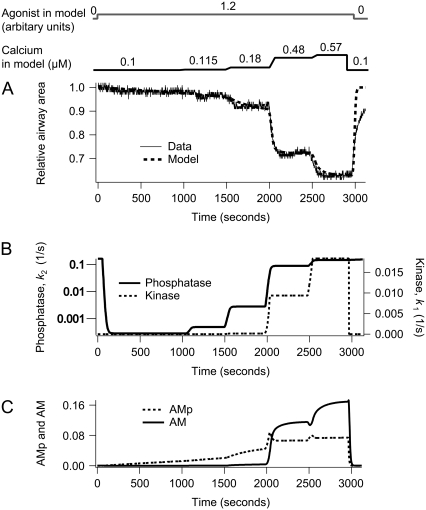
Dependence of airway SMCs contraction on [Ca2+]i at a constant agonist concentration. (A) Experimental data (solid) with model fit (dashed). (B) The corresponding MLCP (k2) and MLCK activity (k1). (C) The corresponding fractions of AM and AMp. Initially the agonist concentration a is stepped from 0 to 1.2 and then kept constant. [Ca2+]i (c) is stepped up to 0.115 μM, 0.18 μM, 0.48 μM, and 0.57 μM at 8 min intervals. Each step increase in c takes 1 min to complete. After 8 min at the highest [Ca2+]i, c is returned to 0.1 μM for the remainder of the simulation.
FIGURE 7.
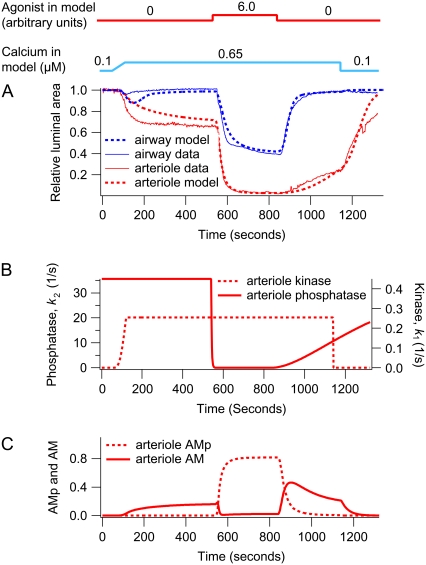
Response of an airway and arteriole pair to agonist and high [Ca2+]i. This simulation corresponds to Fig. 1 (bottom right). (A) Experimental (solid) and model (dashed) data for the airway (blue) and arteriole (red). (B) The corresponding arteriole phosphatase (k2) and kinase activity (k1) induced by changes in c and a. (C) Fractions of arteriole AM and AMp. In these simulations, [Ca2+]i (c) is initially increased to 0.65 μM over a duration of 1 min. Near the end of the simulation, c is returned to 0.1 μM. The agonist concentration a is increased from 0 to 6.0 after 9 min.
How does Ca2+ and agonist regulation of MLCP affect airway contraction?
In response to a step increase in [Ca2+]i (Figs. 1 and 3), the airway initially contracts (because MLCK activity quickly increases) but subsequently slowly relaxes (because MLCP activity slowly increases) (Fig. 3, A and B). The model predicts that during this transient contraction the contractile force arises mainly from cross-bridges in the latch state. The initial phosphorylation of myosin allows binding to actin, and there is a small transient increase in AMp. However, myosin quickly moves into the latch state (AM) as soon as MLCP activity begins to increase (Fig. 3 C). Due to the depletion of the phosphorylated myosin (Mp), a contraction cannot be maintained and the subsequent relaxation of the airway correlates with the slow dissociation of the latch state from actin.
The second step increase in [Ca2+]i (to 1.3 μM) induces a smaller contractile response (Fig. 3 A). This is consistent with the fact that the airway SMC has adapted to the elevated [Ca2+]i by increasing MLCP activity. In addition, the contractile effect of the additional activation of MLCK by the step increase of Ca2+ is mitigated by the increased MLCP activity (Fig. 3 B). The step increase in Ca2+ also further activates the MLCP, and over time the airway relaxes again but to a level determined by the new equilibrium resulting from the high activity of both MLCK and MLCP. Furthermore, as shown in Fig. 6, if the airway has not been previously adapted to high [Ca2+]i, the contractile response to the same increase in [Ca2+]i (1.3 μM) is considerably stronger (compare Fig. 6 to Figs. 1 and 3).
A step decrease in Ca2+ serves to relax the airway rapidly as the MLCK activity falls in the presence of high MLCP activity. However, the subsequent addition of agonist stimulates a substantial airway contraction, often equal to that observed in normal lung slices. Because the [Ca2+]i is still high and does not change upon agonist addition, this response is explained by the agonist inducing a rapid decrease in the MLCP activity: the agonist is working by turning off the MLCP (the “off” or relaxation process) rather than by turning on the MLCK (the “on” or contractile process). Consequently, the amount of phosphorylated myosin increases. At high agonist concentrations, the model predicts that both AMp and AM contribute to the contraction (Fig. 3 C). Finally, when the agonist is removed, the MLCK activity quickly decreases, whereas the MLCP activity remains high. This results in a fast decrease in the amount of phosphorylated myosin and a transient increase in latch-bridge formation (AM). Because unphosphorylated myosin can only dissociate from actin, the latch state dissociates to allow the airway to relax completely.
Under conditions in which the [Ca2+]i remains constant, the airway SMCs respond to increasing concentrations of agonist by step increases in contraction (Fig. 4 A). It is important to note that at the beginning of this experiment, the airway is fully relaxed because the airway has been previously exposed to high [Ca2+]i for an extended period: both the MLCP and MLCK are active before the addition of agonist. The increased contraction is due to inactivation of MLCP (Fig. 4 B). Consequently, the model predicts an increase in the amount of phosphorylated myosin as a function of agonist concentration (Fig. 4 C).
A similar step increase in contraction occurs in response to step increases in [Ca2+]i when the agonist concentration is held constant (Fig. 5 A). At the beginning of this experiment, the airway is also fully relaxed, but in this case the [Ca2+]i and agonist concentration were maintained low for an extended period. Consequently, the MLCK is inactive but the MLCP has residual activity (Fig. 5 B). From these studies the model predicts an increase in the amount of phosphorylated myosin as a function of calcium concentration (Fig. 5 C).
Arteriole MLCP is not regulated by calcium
We applied the same model to both airway and arteriole SMC. In fitting to the arteriole data of Figs. 6 and 7, six of the parameters (k1b, kon2, koff2, τp, g1, and  ) were changed. All other parameters were held fixed at the values obtained for airway SMC.
Airway SMCs and arteriole SMCs respond quite differently to a step increase in [Ca2+]i. In arteriole SMCs, the initial contraction occurs more slowly, and an adaptive relaxation does not occur (Fig. 6, upper panel). Although kinase activity in both airway and arteriole SMCs increases when [Ca2+]i increases (Fig. 6, lower panel), arteriole phosphatase activity is independent of [Ca2+]i (low kon2, Table 1). A subsequent increase in agonist concentration causes a stronger contraction (Fig. 7 A), the result of a decrease in phosphatase activity (Fig. 7 B). In arteriole, the initial Ca2+-dependent contraction is maintained by the latch state AM, but the agonist-dependent contraction is maintained principally by phosphorylated myosin, AMp (Fig. 7 C). Thus the model strongly suggests that, unlike airway SMCs, MLCP in arteriole SMCs is regulated by agonist but not by Ca2+.
In both airway and arteriole, relaxation after removal of Ca2+ or agonist is due to dissociation of the latch state from actin (Figs. 3 C, 4 C, 5 C, and 7 C). However, airway SMCs relax faster than arteriole SMCs. The model predicts that this difference is due to a slower dissociation of the latch state from actin in arteriole SMCs. We found that the dissociation rate constant g1 in arteriole SMCs is ∼4 times smaller than that in airway SMCs (Table 1).
Response to calcium oscillations
Previous simulations have investigated how the airway and arteriole contract under conditions where [Ca2+]i remains constant. However, in normal SMCs (not treated with ryanodine/caffeine), exposure to agonist typically generates Ca2+ oscillations, with a frequency that increases with the agonist concentration (3,4,17). To analyze the response of airway SMCs to calcium oscillations, we use a “square wave” (periodic piecewise linear function) to mimic [Ca2+]i oscillations. The frequency and form of the [Ca2+]i oscillations was chosen to be approximately equal to that observed during agonist stimulation.
The model predicts that an oscillatory Ca2+ stimulus induces a significantly greater contraction than an equivalent constant Ca2+ stimulus with magnitude equal to the average [Ca2+]i during oscillations. This effect is particularly pronounced for the airway.
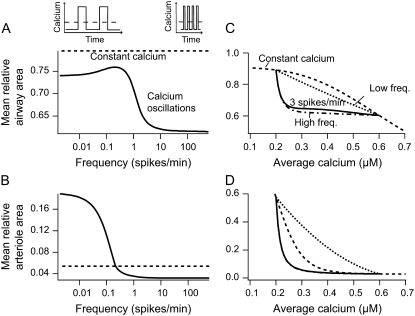
To show this, we varied the frequency of the Ca2+ oscillations while maintaining the same average Ca2+ and agonist concentration (Fig. 8, A and B). Because the average [Ca2+]i remains constant, the high- and low-frequency Ca2+ oscillations must necessarily have long and short spike durations, respectively (upper inset of Fig. 8 A). In airway SMCs all Ca2+ oscillation frequencies cause a greater contraction than does a constant Ca2+ signal of the same average [Ca2+]i (Fig. 8 A). For the arteriole this was true only for high-frequency oscillations (Fig. 8 B). Although high-frequency oscillations gave greater contraction, frequencies above 5 spikes/min for the airway and 0.5 spikes/min for the arteriole cause little additional contraction. Experimentally, frequencies range from 5 to 25 spikes/min for the airway and from 0.5 to 6 spikes/min for the arteriole (3,4). This means that the Ca2+ oscillation frequencies observed in vivo are optimized toward strong contraction.
FIGURE 8.
Frequency response. (A and B) Frequency dependency of the contractile response of airway and arteriole, respectively, to calcium oscillations with a constant average [Ca2+]i. The steady-state mean relative area over one period (solid line) varies between two limit cases for low- and high-frequency oscillations (see Appendix). High-frequency oscillations give a strong contractile response. The mean average calcium is maintained at 0.4 μM by varying the spike width together with the period so that their ratio is 0.5 (upper inset). Agonist is kept constant at a = 1.2. (C and D) Contractile response of airway and arteriole to calcium oscillations with different average [Ca2+]i. The average [Ca2+]i varies from 0.2 to 0.6 μM by changing the ratio of spike width to period. For comparison the area obtained with a constant signal of equal average is shown (dashed line). The dot-dashed and dotted lines give the mean area for the limit cases at low- and high-frequency oscillations, respectively (see Appendix). Basal and peak [Ca2+]i are 0.2 and 0.6 μM, respectively.
In vivo the average [Ca2+]i will also vary with agonist. We therefore calculated, across a range of values for average [Ca2+]i, the extent of contraction for low-frequency oscillations and for high-frequency oscillations (Fig. 8, C and D). We found that, for each average [Ca2+]i, high-frequency oscillations always give greater contraction than do low-frequency oscillations. In both airway and arteriole, when [Ca2+]i is low, variation in the average [Ca2+]i strongly affects contraction, but at higher values of [Ca2+]i, the high-frequency responses become almost independent of average [Ca2+]i. In contrast the responses to a low-frequency input, or to a constant input, remain dependent on the average [Ca2+]i even at higher concentrations (Fig. 8, C and D). In airway SMC, at all average [Ca2+]i, both low-frequency and high-frequency oscillations cause a greater contraction than does a constant [Ca2+]i (Fig. 8 C). However, in arteriole SMC, low-frequency oscillations always cause a lesser contraction than does a constant [Ca2+]i (Fig. 8 D). Hence, the behavior seen in Fig. 8, A and B, persists for all values of average [Ca2+]i. Our analysis focused on changes in average [Ca2+]i caused by changes in the spike width at a constant oscillation period. Similar results are obtained when the spike amplitude is increased (computations not shown).
Calcium oscillations can also be stimulated by KCl, but these oscillations are qualitatively different from those caused by agonist, having a much lower frequency of ∼1 spike/min. It is observed experimentally that KCl-induced oscillations cause a smooth contraction of the arteriole but no coordinated contraction of the airway (3,4).
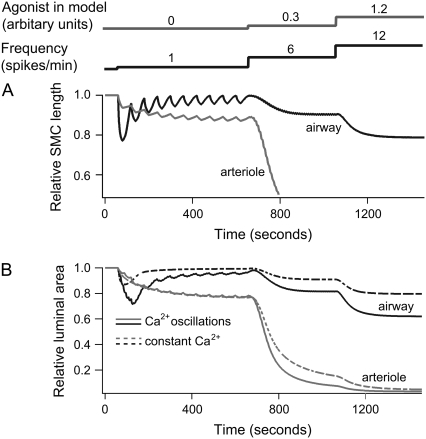
Our model provides a quantitative explanation of this observation, as illustrated in Fig. 9. In the model, slow [Ca2+]i oscillations cause strong fluctuations in the airway SMC length but nearly no fluctuations for arteriole SMCs (Fig. 9 A). The reason for this is that arteriole SMCs relax more slowly than airway SMCs (smaller g1, Table 1) and is thus better able to integrate the slow oscillations. For calcium oscillations with higher frequencies (>5 spikes/min), the fluctuations in the SMC length for both airway and arteriole are almost undetectable. The reason these length fluctuations remain small at high frequencies is that, according to our model, the kinetics of cross-bridge formation cannot closely follow the change in [Ca2+]i because the time required for MLCP activation and cross-bridge attachment/detachment is much longer than the period of the oscillations.
FIGURE 9.
Contractile response of airway and arteriole to Ca2+ oscillations. (A) Length changes of an airway (black) and arteriole (gray) SMC to a step increase in agonist a and frequency at the time points indicated. The initial Ca2+ oscillations (1 spike/min) in the absence of agonist cause strong variations only in the length of the airway SMC. Ca2+ oscillations with higher frequencies (>5 spike/min) cause continuous contraction in both airway and arteriole SMC. (B) Relative area changes in response to calcium oscillations (solid lines) and a constant signal of the same average [Ca2+]i (dashed lines). We assume that six and three SMCs form an airway and arteriole, respectively. The phase difference in the calcium oscillations between cells in the airway and arteriole is chosen to be 2π/6 and 2π/3, respectively. Ca2+ oscillations are modeled as a periodic piecewise linear function. The spike widths are 20, 5, and 2.5 s at a = 0, 0.3, and 1.2, respectively. The peak [Ca2+]i is 1.3 μM at a = 0, and 0.6 μM at a = 0.3 and 1.2. Basal [Ca2+]i is 0.2 μM; initial [Ca2+]i is 0.1 μM. The constant signal [Ca2+]i with and without agonist is 0.4 and 0.56 μM, respectively.
Because calcium oscillations are not synchronous between the cells of the airway or arteriole (3,4), the overall contraction is computed by taking the average over multiple SMCs (six for the airway, three for the arteriole); the overall changes in the area are smoother (Fig. 9 B). As expected from the previous results, the response to a constant [Ca2+]i (Fig. 9 B, dashed line) is always less than the response to the oscillation.
DISCUSSION
Although the basic smooth muscle cross-bridge model based on actin and myosin interactions was established in 1988, our understanding of enzymes that regulate contraction remains largely incomplete. In particular, our understanding of MLCP and its biochemical pathways is rather limited in comparison to our understanding of MLCK.
Our model suggests that in murine lung slices, both MLCK and MLCP are upregulated by Ca2+, but because this activation occurs on different timescales, airway SMC contraction adapts to maintained increases in [Ca2+]i, first contracting and then relaxing. Just as importantly, agonists induce contraction in two ways: first, by activating the “on” step (increased MLCK activity), via an increase in [Ca2+]i, and second, by inactivating the “off” step (decreased MLCP activity). The implication of these results is that increases in [Ca2+]i alone are less effective in stimulating contraction and that MLCP must be inactivated by the agonist before significant contraction can occur (Fig. 3).
The enhancement of Ca2+ sensitization by the inhibition of MLCP by agonist in detergent or toxin-permeabilized SMCs has been previously reported (14,18–20). MLCP activation causing relaxation of SMCs has been observed in cells with elevated cyclic GMP concentration (21–23). However, in comparison to the responses of lung slices (2,5), the increased Ca2+ sensitivity was limited and activation by Ca2+ of MLCP was not observed. The reasons for the discrepancy between these results are unclear but may be explained by the fact that membrane permeabilization changes the integrity of the SMCs. In the mathematical model we assumed a direct interaction of Ca2+ and MLCP. However, the action of Ca2+ is likely to depend on signaling pathways that may have been disrupted in permeabilized cells. Furthermore, SMCs at different locations of the respiratory tract and from different animals may not have the same contractile properties.
Although the contractile responses of intrapulmonary arterioles are different from those of airways (4), our model of SMC contraction can explain the two types of behavior. Our model predicts that in arteriole SMCs, MLCP activation is dependent on agonist but not dependent on Ca2+ to any significant extent, whereas in airway SMCs, Ca2+ activation of MLCP is the mechanism that leads to adaptation.
The model also predicts that at low agonist concentration, contraction is mainly controlled by the latch state. Although application of agonist causes a transient increase in the number of phosphorylated cross-bridges, most move quickly to the latch state. At higher agonist concentrations, cross-bridge phosphorylation makes a greater contribution to contraction. Removal of agonist or Ca2+ quickly causes dephosphorylation of myosin. The slower relaxation of arteriole compared to airway (4,17) is predicted to be due to slower dissociation of the latch state.
The normal response of airway or arteriole SMCs to agonists consists of Ca2+ oscillations (2–5). To address the role of these signals in modulating airway contraction, we mimicked Ca2+ oscillations with a periodic step-wise function. For a given average [Ca2+]i, higher oscillation frequency results in a greater contractile response. Typically, we found that the contraction obtained with an oscillatory signal was stronger than the contraction obtained with a constant signal of equal average [Ca2+]i. This may be explained by the nonlinear dependency of the SMCs' contractile response on [Ca2+]i (Fig. 9). The peak [Ca2+]i during oscillations is higher than the [Ca2+]i for the constant signal; this causes a more pronounced rMLC phosphorylation, and so a larger contractile force. Furthermore, for high-frequency oscillations, only a small fraction of myosin detaches from actin in the interspike interval. Our results are in agreement with previous theoretical and experimental studies that show how Ca2+ oscillations can be the more potent activator for Ca2+-dependent proteins (see, e.g., 24–27).
Arteriole SMCs exhibit their maximal contraction at ∼0.5 Ca2+ spikes/min, whereas airway SMCs do not attain maximum contraction until the frequency of the Ca2+ spikes reaches ∼5 spikes/min. Because of this difference in the frequency responses, the low-frequency Ca2+ spikes induced by KCl cause a smooth contraction in arteriole SMC but no coordinated contraction in airway SMC. It is interesting to note that, in vivo, calcium oscillations have higher frequencies in airway (5–25 spikes/min) than in arteriole (0.5–6 spikes/min). The model thus predicts that agonist-induced Ca2+ oscillations in both airway and arteriole are optimized for maximal contraction.
APPENDIX
Parameter estimation
A midpoint implicit upwind method (28) was used to solve the model equations. We used a time step of Δt = 100 ms and a space discretization of Δx = 0.05h. A smaller time step or discretization did not improve the simulations. Parameter values involved in MLCK and MLCP activities and AM dissociation (Table 1) were determined for the airway by fitting the model to experimental data from Bai and Sanderson (5) reproduced in Figs. 3, 4, and 6. The experimental data in Figs. 5 and 7 were not used in the fitting process, although they agree well with the model. For the arteriole model we used the data from Figs. 6 and 7.
Parameter values involved in the position-dependent attachment and detachment rates (Table 1) were taken from Mijailovich et al. (8), with the exception of g1, the dissociation rate constant of the cross-bridges in the latch state, which was included in the fitting process. With the value given in Mijailovich et al. (8), the AM cross-bridges would remain immobile in the latch state and the airway relaxation after agonist removal would be extremely slow. For β of Eq. 16, we take a value of 2. This allows complete contraction when all cross-bridges are attached to actin. The average length of a contractile unit in airway SMCs varies, and a range from 0.7 to 2.2 μm has been reported (29,30). We take L0/N = 0.7 μm and obtain for the parameter rescaling the velocity γ = L0/(2Nh)β a value of 44.87.
Parameter fitting was done using a Bayesian Markov-Chain Monte Carlo (MCMC) approach. Briefly, we constructed the posterior distribution of the parameters p given the data d, Pr(p|d), by using the Bayesian formalism. Thus
 |
(20) |
Given a parameter set, we calculate the probability of the data given the parameters, Pr(d|p), by solving the model equations numerically. We assume that the error at each data point is Gaussian distributed with variance (0.051)2; this is approximately the variance (5.1%) observed between different lung slices (5) when the data are plotted as a relative area. We have
 |
(21) |
where  is the computed approximation of the ith data point, di the ith data point. The prior Pr(p) was chosen uniform for positive parameter values and 0 otherwise. MCMC sampling of the posterior distribution Pr(p|d) was done using a Metropolis-Hastings algorithm.
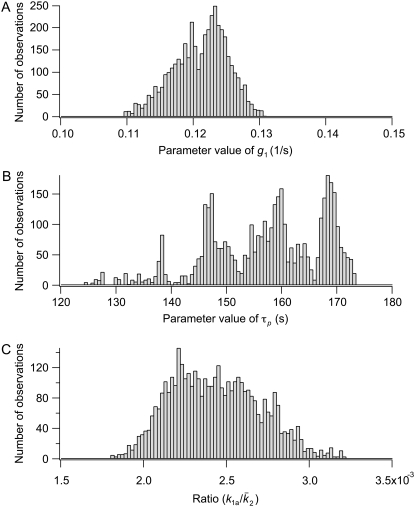
The 95% confidence intervals computed from the parameter distributions are listed in Table 1. Although we cannot determine a specific value for all of the parameters, the distributions were all bounded, thus determining the range in which each parameter is most likely to be found. Fig. 10 shows three representative traces for the parameter distributions obtained with MCMC. For the parameters g1, kon1, koff1, and koff2, we found distributions that show a clearly preferred parameter value (e.g., g1 in Fig. 10 A). Distributions with more than one peak were observed for the other parameters (e.g., τp in Fig. 10 B). We found that the parameters k1a,  and k1b, kon2 are correlated and have a similar multipeaked distribution. However, their ratio is well determined and gave a distribution with a well-defined peak, as shown in Fig. 10 C for
  For the arteriole, we obtained convergence for all parameters (not shown). The dissociation rate constant of MLCK to Ca2+, k1b, has been set to 0.7 μM, the value reported in the literature (31,32). Including this parameter in the fitting gave a better agreement between model and arteriole data (the sum of the squared residuals was 2.4 instead of 9.2, F-ratio p < 0.01) but a nonphysiological low value of 0.27 μM.
FIGURE 10.
Representative parameter distributions obtained from MCMC. (A) A typical parameter distribution with a clear preferred parameter value. (B) A typical parameter distribution with more than one peak. A mean and variance is not a useful characterization of this distribution, but the 95% confidence interval still tells us the most likely range for the parameter. (C) The ratio of parameters that show correlations has a clear preferred value.
To conclude, similar good fits to data were possible with different combinations of parameters in the range as shown in Table 1. This, however, does not modify the predictions of the model concerning the role of MLCP and MLCK regulation, the contribution of the latch state, or the effect of Ca2+ oscillations on the airway and arteriole contractile response. All the computations done with parameter sets in the given ranges give qualitatively similar results.
Mean relative airway area
The mean relative area during one oscillation period T, shown in Fig. 8, is computed from
 |
(22) |
when the Ca2+-driven oscillations of the area have reached a periodic state. We first compute the time average of AM and AMp during one period, 〈AM〉 and 〈AMp〉 respectively and then calculate the force from  For low- and high-frequency Ca2+ oscillations, we derived analytical expressions for 〈AM〉 and 〈AM〉p, which have been used to compute the mean area for these two limiting cases (Fig. 8, C and D).
For low-frequency oscillations the period T and spike width d are much larger than the characteristic time of the system. This means that when the calcium concentration changes, the airway and MLCP have enough time to reach a new steady state. Neglecting the transient from one steady state to another we obtain
 |
(23) |
where Δ = d/T, c0 and c1 are the basal and peak [Ca2+]i during oscillations. The steady state  attained at a [Ca2+]i of c is calculated by solving Eqs. 5–7
 |
(24) |
with
 |
(25) |
and  Similar expressions are derived for 〈AM〉 with
 |
(26) |
For high-frequency oscillations, the amplitude of the cross-bridges and MLCP oscillations is small compared to their mean and the system integrates over the calcium signal. For instance, the fraction of active MLCP can be written as P = 〈P〉 + δP, with average 〈P〉 and amplitude δP. Integrating Eq. 1 gives
 |
(27) |
with an average activation rate 〈kon〉 = kon(c1)Δ + kon(c0)(1 − Δ). Because  the last term in the previous equation can be neglected so that
 |
(28) |
Similar reasoning can be used to obtain the average attached cross-bridges. 〈AM〉p and 〈AM〉 are given, respectively, by Eqs. 24 and 26 where k1 and  have been replaced with their mean 〈k1〉 = k1(c1)Δ + k1(c0)(1 − Δ) and 〈P〉.
Inga Wang and Antonio Z. Politi contributed equally to this work.
Editor: Arthur Sherman.
References
- 1.Stephens, N. 2002. Airway Smooth Muscle. Springer-Verlag, New York.
- 2.Bergner, A., and M. J. Sanderson. 2002. Acetylcholine-induced calcium signaling and contraction of airway smooth muscle cells in lung slices. J. Gen. Physiol. 119:187–198. [DOI] [PMC free article] [PubMed] [Google Scholar]
- 3.Perez, J. F., and M. J. Sanderson. 2005. The frequency of calcium oscillations induced by 5-HT, ACH, and KCl determine the contraction of smooth muscle cells of intrapulmonary bronchioles. J. Gen. Physiol. 125:535–553. [DOI] [PMC free article] [PubMed] [Google Scholar]
- 4.Perez, J. F., and M. J. Sanderson. 2005. The contraction of smooth muscle cells of intrapulmonary arterioles is determined by the frequency of Ca2+ oscillations induced by 5-HT and KCl. J. Gen. Physiol. 125:555–567. [DOI] [PMC free article] [PubMed] [Google Scholar]
- 5.Bai, Y., and M. J. Sanderson. 2006. Modulation of the Ca2+ sensitivity of airway smooth muscle cells in murine lung slices. Am. J. Physiol. 291:L208–L221. [DOI] [PubMed] [Google Scholar]
- 6.Somlyo, A. P., and A. V. Somlyo. 2003. Ca2+ sensitivity of smooth muscle and nonmuscle myosin II: modulated by G proteins, kinases and myosin phosphatase. Physiol. Rev. 83:1325–1358. [DOI] [PubMed] [Google Scholar]
- 7.Hai, C., and R. Murphy. 1988. Cross-bridge phosphorylation and regulation of latch state in smooth muscle. Am. J. Physiol. 254:c99–c106. [DOI] [PubMed] [Google Scholar]
- 8.Mijailovich, S. M., J. P. Butler, and J. J. Fredberg. 2000. Perturbed equilibria of myosin binding in airway smooth muscle: bond-length distributions, mechanics, and ATP metabolism. Biophys. J. 79:2667–2681. [DOI] [PMC free article] [PubMed] [Google Scholar]
- 9.Hai, C., and R. Murphy. 1988. Regulation of shortening velocity by cross-bridge phosphorylation in smooth muscle. Am. J. Physiol. 255:c86–c94. [DOI] [PubMed] [Google Scholar]
- 10.Hai, C., and R. Murphy. 1989. Ca2+, crossbridge phosphorylation, and contraction. Annu. Rev. Physiol. 51:285–298. [DOI] [PubMed] [Google Scholar]
- 11.Murphy, R. 1994. What is special about smooth muscle? The significance of covalent crossbridge regulation. FASEB J. 8:311–318. [DOI] [PubMed] [Google Scholar]
- 12.Mbikou, P., A. Fajmut, M. Brumen, and E. Roux. 2006. Theoretical and experimental investigation of calcium-contraction coupling in airway smooth muscle. Cell Biochem. Biophys. 46:233–252. [DOI] [PubMed] [Google Scholar]
- 13.Bates, J. H., and A. M. Lauzon. 2007. Parenchymal tethering, airway wall stiffness, and the dynamics of bronchoconstriction. J. Appl. Physiol. 102:1912–1920. [DOI] [PubMed] [Google Scholar]
- 14.Woodsome, T. P., A. Polzin, K. Kitazawa, M. Eto, and T. Kitazawa. 2006. Agonist and depolarization-induced signals for myosin light chain phosphorylation and force generation of cultured vascular smooth muscle cells. J. Cell Sci. 119:1769–1780. [DOI] [PubMed] [Google Scholar]
- 15.Huxley, A. F. 1957. Muscle structure and theories of contraction. Prog. Biophys. Biophys. Chem. 7:255–318. [PubMed] [Google Scholar]
- 16.Malvern, L. E. 1969. Introduction to the Mechanics of a Continuous Medium. Prentice-Hall, Englewood Cliffs, NJ.
- 17.Bai, Y., M. Zhang, and M. J. Sanderson. 2007. Contractility and Ca2+ signaling of smooth muscle cells in different generations of mouse airways. Am. J. Respir. Cell Mol. Biol. 36:122–130. [DOI] [PMC free article] [PubMed] [Google Scholar]
- 18.Kitazawa, T., M. Masuo, and A. P. Somlyo. 1991. G protein-mediated inhibition of myosin light-chain phosphatase in vascular smooth muscle. Proc. Natl. Acad. Sci. USA. 88:9307–9310. [DOI] [PMC free article] [PubMed] [Google Scholar]
- 19.Somlyo, A. P., and A. V. Somlyo. 2000. Signal transduction by G-protein, rho-kinase and protein phosphatase to smooth muscle and non-muscle myosin II. J. Physiol. 522:177–185. [DOI] [PMC free article] [PubMed] [Google Scholar]
- 20.Niiro, N., Y. Koga, and M. Ikebe. 2003. Agonist-induced changes in the phosphorylation of the myosin-binding subunit of myosin light chain phosphatase and CPI17, two regulatory factors of myosin light chain phosphatase, in smooth muscle. Biochem. J. 369:117–128. [DOI] [PMC free article] [PubMed] [Google Scholar]
- 21.Lee, M. R., L. Li, and T. Kitazawa. 1997. Cyclic GMP causes Ca2+ desensitization in vascular smooth muscle by activating the myosin light chain phosphatase. J. Biol. Chem. 272:5063–5068. [DOI] [PubMed] [Google Scholar]
- 22.Wu, X., T. A. Haystead, R. K. Nakamoto, A. V. Somlyo, and A. P. Somlyo. 1998. Acceleration of myosin light chain dephosphorylation and relaxation of smooth muscle by telokin. Synergism with cyclic nucleotide-activated kinase. J. Biol. Chem. 273:11362–11369. [DOI] [PubMed] [Google Scholar]
- 23.Lukas, T. J. 2004. A signal transduction pathway model prototype II: application to Ca2+-calmodulin signaling and myosin light chain phosphorylation. Biophys. J. 87:1417–1425. [DOI] [PMC free article] [PubMed] [Google Scholar]
- 24.Dolmetsch, R. E., K. Xu, and R. Lewis. 1998. Calcium oscillations increase the efficiency and specificity of gene expression. Nature. 392:933–936. [DOI] [PubMed] [Google Scholar]
- 25.Tomida, T., K. Hirose, S. Takizawa, and F. Shibasaki. 2003. NFAT functions as a working memory of Ca2+ signals in decoding Ca2+ oscillation. EMBO J. 22:3825–3832. [DOI] [PMC free article] [PubMed] [Google Scholar]
- 26.Larsen, A. Z., and U. Kummer. 2003. Information processing in calcium signal transduction. Lect. Notes Phys. 5623:153–178. [Google Scholar]
- 27.Salazar, C., A. Z. Politi, and T. Höfer. 2007. Decoding of calcium oscillations by phosphorylation cycles: analytic results. Biophys. J. In press. [DOI] [PMC free article] [PubMed]
- 28.Leveque, R. J. 2002. Finite Volume Methods for Hyperbolic Problems. Cambridge Texts in Applied Mathematics. Cambridge University Press, Cambridge, UK.
- 29.Tonino, P., M. Simon, and R. Craig. 2002. Mass determination of native smooth muscle myosin filaments by scanning transmission electron microscopy. J. Mol. Biol. 318:999–1007. [DOI] [PubMed] [Google Scholar]
- 30.Herrera, A. M., B. E. McParland, A. Bienkowska, R. Tait, P. D. Paré, and C. Y. Seow. 2005. ‘Sarcomeres’ of smooth muscle: functional characteristics and ultrastructural evidence. J. Cell Sci. 118:2381–2392. [DOI] [PubMed] [Google Scholar]
- 31.Geguchadze, R., G. Zhi, K. Lau, E. Isotani, A. Persechini, K. Kamm, and J. Stull. 2004. Quantitative measurements of Ca(2+)/calmodulin binding and activation of myosin light chain kinase in cells. FEBS Lett. 557:121–124. [DOI] [PubMed] [Google Scholar]
- 32.Fajmut, A., M. Jagodic, and M. Brumen. 2005. Mathematical modeling of the myosin light chain kinase activation. J. Chem. Inf. Model. 45:1605–1609. [DOI] [PubMed] [Google Scholar]


