Abstract
Xanthine/α-ketoglutarate (αKG) dioxygenase (XanA) is a non-heme mononuclear FeII enzyme that decarboxylates αKG to succinate and CO2 while hydroxylating xanthine to generate uric acid. In the absence of a XanA crystal structure, a homology model was used to target several putative active site residues for mutagenesis. Wild-type XanA and ten enzyme variants were purified from recombinant Escherichia coli cells and characterized. The H149A and D151A variants were inactive and the H340A variant exhibited only 0.17 % of the wild-type enzyme activity, consistent with the proposed role of His149, Asp151, and His340 as Fe ligands. The K122A variant led to a 2-fold increase in the Kd of αKG as measured by fluorescence quenching analysis, in agreement with Lys122 acting to stabilize the binding of αKG. The N358A variant exhibited a 23-fold decrease in kcat/Km compared to wild-type XanA, pointing to a key role of Asn358 in catalysis. 9-Methylxanthine was exploited as an alternate substrate, and the C357A, E137A, and D138A variants were found to exhibit relatively enhanced activity consistent with Cys357, Glu137, and Asp138 being proximal to N-9 or involved in its proper positioning. 6,8-Dihydroxypurine was identified as a slow-binding competitive inhibitor of XanA, and significant decreases (E137A and D138A) or increases (Q356A and N358A) in Kiapp of the variants were interpreted in terms of distinct interactions between this compound and the corresponding active site side chains. Further support for Cys357 residing at the active site was obtained using thiol-specific reagents that inactivated wild-type enzyme (with partial protection by substrate), whereas the C357A variant was resistant to these reagents. The Q101A, Q356A, and C357A variants showed elevated ferroxidase activity in the absence of substrates, pointing to the presence of the corresponding side chains at the active site. These results confirm most aspects of the homology model and provide additional insight into the enzyme reactivity.
Keywords: xanthine, dioxygenase, hydroxylase, mutagenesis, active site, α-ketoglutarate
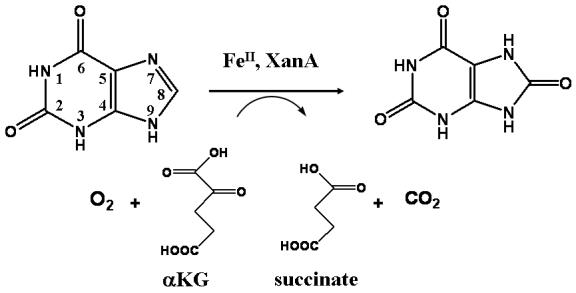
Xanthine dehydrogenases and xanthine oxidases are molybdopterin cofactor (Moco)1-containing enzymes that transform xanthine into uric acid [1]. These enzymes are conserved throughout living organisms, including archaea, bacteria, fungi, plants, and metazoans. Surprisingly, mutants of Aspergillus nidulans with known defects in xanthine dehydrogenase activity (i.e., with mutations affecting the structural gene hxA, the cnx genes for Moco synthesis, or hxB for sulfuration of Moco) were found to retain the ability to grow on xanthine as sole nitrogen source [2]. This capacity arises from an alternative xanthine-degrading activity encoded by the xanA gene found only in selected fungi [3]. Recombinant His6-tagged XanA protein was purified from both A. nidulans mycelia and Escherichia coli cells and shown to be an FeII- and α-ketoglutarate (αKG)-dependent hydroxylase that catalyzes the reaction shown in Scheme 1 [4]. On the basis of its sequence similarity to taurine/αKG dioxygenase or TauD [5], a well-studied and crystallographically characterized member of the FeII/αKG dioxygenase family [6, 7 , 8], a homology model was constructed for XanA [4]. The overall sequence identity of XanA and TauD is only 18 % over 280 residues, and three loops in XanA could not be modeled; however, the relevant structural regions near the active sites are 33 % identical and the model likely captures the overall features correctly. The XanA model predicts that (i) FeII binds to His149, Asp151, and His340 residues of the protein, (ii) Lys122 and Arg352 stabilize the binding of αKG (which by analogy to other systems chelates the metal via its C-1 carboxylate and C-2 keto group) by hydrogen bonding to the C-1 carboxylate and salt bridge formation with the C-5 carboxylate, and (iii) the active site pocket is lined with potential hydrogen bond donors or acceptors (Gln99, Gln101, Lys122, Glu137, Asp138, Gln356, Cys357, and Asn358) whereas aromatic residues are not important for binding substrate.
Scheme 1.
In this study, the three residues thought to bind FeII and each of the potential hydrogen-bonding residues at the XanA active site was replaced by Ala. Fluorescence quenching methods were used to assess the Kd of αKG for the mutant enzymes. The steady-state kinetic properties of the variants were analyzed with both xanthine and the alternate substrate 9-methylxanthine. 6,8-Dihydroxypurine (6,8-DHP) was shown to be a slow-binding competitive inhibitor of XanA and its effects on the variant proteins were examined. Chemical modification studies were carried out with thiol-specific reagents for the wild-type enzyme and the C357A variant. Finally, the reactivity of each metallocenter with oxygen was examined in the absence of primary substrate. On the basis of these results, we confirm many features of the homology model and generate additional insights into the enzyme reactivity.
Materials and methods
Site-directed mutagenesis, protein overproduction, and enzyme purification
The Q99A, Q101A, K122A, E137A, D138A, H149A, D151A, H340A, Q356A, C357A, and N358A variants of XanA were created by mutagenesis of xanA (encoding a His6-tagged version of XanA, termed wild-type XanA for convenience) in a modified version of vector pThioHisC [4] using the Quickchange II site-directed mutagenesis kit (Stratagene). Each mutation was confirmed by sequence analysis (Davis Sequencing, Davis, CA). Plasmids were transformed into XL1Blue E. coli cells (Stratagene) and the variant proteins were overproduced during cell growth in Luria Base Broth (Difco) and induced by using isopropyl-β-D-thiogalactopyranoside as described previously [4]. Cultures were harvested by centrifugation at 8,000 g for 10 min at 4 °C, the cells were disrupted by use of a French pressure cell, membranes and insoluble materials were removed by ultracentrifugation (45 min at 100,000 g), and the wild-type and variant forms of XanA were purified by using Ni-loaded nitrilotriacetic acid (NTA)-bound resin, as previously reported [4].
Fluorescence quenching analyses of αKG binding
Fluorescence measurements were made on a luminescence spectrometer, model LS-50B (Perkin Elmer Limited, UK). The temperature of the cells was maintained at 25 °C. Fluorescence measurements were carried out at an excitation wavelength of 280 nm (10 nm band-width) with emission monitored from 300 to 400 nm (5 nm bandwidth). Samples were prepared in 50 mM Tris buffer, pH 8.0, and αKG was added to 350 μM. The data were fit to equation 1, where [Lf] is the concentration of free ligand (αKG) derived by subtracting the bound ligand (obtained by the fractional change in fluorescence) from the total concentration of ligand added.
| (1) |
Enzyme assays
Enzymatic assays of XanA and its variants were carried out at 25 °C by using the following typical assay conditions (total volume of 1 mL): 1 mM αKG, 40 μM Fe(NH4)2(SO4)2, and 200 μM xanthine in 50 mM MOPS buffer, pH 7.4 [4]. For kinetic analyses, the concentrations of αKG or xanthine were varied while holding the concentrations of the other components constant. The absorbance at 294 nm was monitored to determine the uric acid production (overall change in ε294 of 10,200 M-1 cm-1). Units of activity (U) were defined as μmol min-1 of uric acid produced and the specific activity (U mg-1) was measured as μmol min-1 (mg of purified XanA)-1. Analogous studies were carried out with 9-methylxanthine (Sigma-Aldrich), but in this case the absorbance at 291 nm was used to calculate the production of 9-methyluric acid (overall change in ε291 of 6,800 M-1 cm-1). Trace activity was detected with 1-methylxanthine (Sigma-Aldrich), but complete kinetic studies could not be performed.
In addition to the spectrophotometric measure of xanthine conversion to uric acid (or the use of substituted xanthines to form substituted uric acids), the various forms of the enzyme were analyzed for ferroxidase activity (reduction of oxygen by using excess ferrous ions as reductant) by use of a Clark-type oxygen electrode. These assays were carried out in air-saturated MOPS medium (pH 7.4) at 25 °C. Less than 12% of the initial levels of O2 were consumed in these assays, and the data were fit to equation 2. [O2]t is the O2 concentration at time t, [O2]o is the initial O2 concentration, vb is the background rate of O2 reduction under the given conditions, vo is the ferroxidase initial velocity, and kapp is the apparent first-order rate constant for the transition from vo to vb.
| (2) |
As a complement to the electrode assay for O2 reduction, the production of hydrogen peroxide was quantified by using a spectrophotometric assay. Timed aliquots of reaction mixtures were added to assay solutions containing 100 mM potassium phosphate (pH 5.0), 8.7 mM 2,2′-azino-bis(3-ethylbenzthiazoline-6-sulfonic acid) (ABTS), and approximately 0.003 units of horseradish peroxidase (Sigma-Aldrich). The oxidation of ABTS was monitored at 420 nm and compared to a standard curve generated with hydrogen peroxide.
A final method to assay the activity of the enzyme focused on quantification of the αKG consumed during the reaction. Aliquots (250 μL) of reaction mixtures were incubated for selected time periods, quenched by addition of 1 mL 0.5 mg/ml o-phenylenediamine (OPDA, Sigma-Aldrich) stock solution (dissolved in 1 M phosphoric acid, pH 2, containing 0.25% (v/v) β-mercaptoethanol), and the samples were heated for 3 min at 100 °C. The absorbance at 333 nm was monitored to determine αKG consumption by comparison to standard curves.
Kinetic analysis of 6,8-DHP inhibition
Spectrophotometric progress curves (containing 90 or more data points, typically at 15 s intervals) were initiated by adding XanA to solutions containing several fixed concentrations of substrate and selected concentrations of 6,8-DHP (graciously provided by D. J. Lowe and F. Jourdan). The data were analyzed according to equation 3 by using a nonlinear regression program to give the individual parameters for each progress curve: A (absorbance at 294 nm), A0 (for baseline correction), vi (initial velocity), vs (steady-state velocity), and kobs (apparent first-order rate constant for the transition from vi to vs).
| (3) |
Results and discussion
To identify the active site residues and better define the reactivity of XanA, a recently identified FeII/αKG-dependent xanthine hydroxylase [4], we characterized a suite of enzyme variants (Q99A, Q101A, K122A, E137A, D138A, H149A, D151A, H340A, Q356A, C357A, and N358A). The residues targeted for mutagenesis were selected on the basis of a homology model of the enzyme [4] that depicts them binding FeII (His149, Asp151, and His340) or lining the active site pocket. Significantly, these residues generally are well conserved in sequences of XanA orthologues [4]. For example, Gln101, His149, Asp151, His340, Gln356, Cys357, and Asn358 are universally conserved in the available XanA sequences. Gln99 often is present, but Val occupies this position in some representatives. Lys122, which is well positioned in the model to interaction with the C-1 carboxylate of αKG, either is retained or replaced by Arg or Thr. Glu137 is replaced by Asp, Gln, and Ser in other XanA orthologues, and even more flexibility exists for Asp138 which is replaced by Glu, Gln, His, and Lys in other XanA sequences. Aromatic residues are not predicted to lie near the active site, eliminating the possibility of π-π stacking interactions with the base, though other hydrophobic residues are suggested to occur in this region. In addition to the indicated side chains, the substrate might also interact with backbone amide and carbonyl groups.
Purification of XanA and its variants
XanA and its variants were produced in E. coli XL1Blue cells as His6-tagged fusion proteins. Seven variant proteins were purified to homogeneity from cell extracts by Ni-NTA chromatography, three (H149A, D151A, and H340A) were enriched by this chromatographic step (data not shown), and Q99A XanA failed to bind to Ni-loaded NTA resin. We interpret the Q99A XanA results to indicate protein misfolding during overexpression, and this variant was not further investigated.
Measurement of αKG binding
Previous studies reported that the binding of αKG and xanthine to XanA resulted in quenching of the endogenous fluorescence of the protein, thus allowing estimation of the Kd of the substrates [4]. We now find that the apparent quenching of fluorescence by xanthine is complicated by the significant absorption of the excitation wavelength by the substrate, precluding the confident estimation of the Kd of xanthine by this method. In contrast, we were able to extend the fluorescence quenching approach to study the Kd of αKG (which does not absorb at 280 nm) for the mutant proteins (Table 1). The K122A variant exhibited a 2-fold increase in Kd, the largest change observed among the variants. This result suggests that Lys122 might assist in stabilizing the binding of the cosubstrate (along with a critical salt bridge between the C-5 carboxylate of αKG and Arg352). Of interest the fluorescence of the H149A variant was not quenched by addition of αKG, suggesting that it binds αKG very poorly or that αKG binding does not lead to fluorescence quenching in this variant. Mutants lacking side chains corresponding to the other postulated metal ligands, D151A and H340A, had larger Kd values than the control enzyme, as did the N358A variant. These results support the identification of Lys122, His149, Asp151, His340, and Asn358 as being located at the active site.
Table 1.
Kd of αKG for XanA and selected variants
| Mutant | Kd of αKG (μM) a |
|---|---|
| XanA | 115 ± 2 |
| Q101A | 107 ± 4 |
| K122A | 235 ± 6 |
| E137A | 146 ± 3 |
| D138A | 136 ± 4 |
| H149A | NDb |
| D151A | 171 ± 4 |
| H340A | 176 ± 4 |
| Q356A | 108 ± 2 |
| C357A | 123 ± 4 |
| N358A | 168 ± 2 |
Estimated on the basis of quenching of the endogenous fluorescence with excitation at 280 nm and emission at 335 nm at 25 °C. The protein concentrations: 0.12 μM for XanA, 0.01 μM for H149A, 0.03 μM for D151A, 0.04 μM for H340A, 0.5 μM for Q101A, 0.12 μM for K122A, 0.13 μM for E137A, 0.18 μM for D138A, 0.05 μM for Q356A, 0.10 μM for C357A, and 0.11 μM for N358A.
ND, fluorescence quenching was not detected.
Kinetic comparison of XanA and its variants with xanthine
Although all variants appeared to be equally overproduced, the Q99A, H149A, D151A, and H340A variants displayed no activity in cell extracts. When purified, H340A XanA exhibited trace activity (0.13 U mg-1) corresponding to 0.17 % of that associated with wild-type enzyme. These four variants were not further analyzed kinetically. The kinetic parameters for XanA and the seven active mutant proteins are listed in Table 2. These variants generally exhibit only minor perturbations in their Km (xanthine), Km (αKG), and kcat compared to the control enzyme. The N358A variant displayed the largest increase in Km (xanthine) and largest decrease in kcat/Km of all of the mutants retaining significant activity, consistent with this side chain having a more critical role in catalysis than the other residues examined. The modest effects on the kinetic parameters for the other variants are interpreted to indicate that a constellation of residues is responsible for substrate binding and hydroxylation, with the loss of any one side chain not having severe repercussions on catalysis.
Table 2.
Substrate, cosubstrate, and substrate analog kinetic parameters of XanA and selected variants
| XanA samplea | Xanthineb | αKGc | 9-Methylxanthined | ||||||
|---|---|---|---|---|---|---|---|---|---|
| Km (μM) | kcat (s-1) | kcat/ Km (μM-1 s-1) | Km (μM) | kcat (s-1) | kcat/ Km (μM-1 s-1) | Km (mM) | kcat (s-1) | kcat/ Km (mM-1 s-1) | |
| Wild-Type | 45 ± 4 | 72 ± 2 | 1.6 | 31 ± 2 | 67 ± 1 | 2.16 | 0.40 ± 0.07 | 3.8 ± 0.3 | 9.5 |
| Q101A | 122 ± 9 | 36 ± 1 | 0.30 | 59 ± 6 | 21 ± 1 | 0.36 | 0.78 ± 0.07 | 0.66 ± 0.03 | 0.85 |
| K122A | 88 ± 5 | 60 ± 1 | 0.68 | 32 ± 2 | 42 ± 1 | 1.31 | 0.88 ± 0.07 | 1.9 ± 0.1 | 2.16 |
| E137A | 71 ± 5 | 40 ± 1 | 0.56 | 41 ± 8 | 31 ± 1 | 0.76 | 1.09 ± 0.17 | 5.9 ± 0.5 | 5.41 |
| D138A | 69 ± 6 | 34 ± 2 | 0.49 | 53 ± 7 | 25 ± 1 | 0.47 | 0.58 ± 0.09 | 4.25 ± 0.24 | 7.33 |
| Q356A | 57 ± 5 | 35 ± 1 | 0.61 | 42 ± 3 | 28 ± 1 | 0.67 | 0.68 ± 0.07 | 1.4 ± 0.1 | 2.05 |
| C357A | 58 ± 5 | 32 ± 1 | 0.55 | 47 ± 4 | 19 ± 1 | 0.40 | 0.55 ± 0.05 | 4.5 ± 0.2 | 8.18 |
| N358A | 554 ± 24 | 38 ± 2 | 0.07 | 48 ± 8 | 17 ± 1 | 0.34 | 1.0 ± 0.4 | 1.26 ± 0.35 | 1.26 |
Except for the compound being analyzed, the assay solutions contained 40 μM FeII, 1 mM αKG, and 200 μM xanthine in 50 mM MOPS buffer, pH 7.4, and were maintained at 25 °C.
Xanthine concentrations ranged from 0-250 μM, except for the N358A variant, which ranged from 0-400 μM.
αKG concentrations ranged from 0-500 μM.
9-methylxanthine concentrations ranged from 0-1.0 mM.
Alternative substrates for XanA and its variants
XanA is incapable of using 3-methylxanthine, 6-methylpurine, or 7-methylxanthine as the primary substrate [4]. In contrast, we detected trace levels of activity for 1-methylxanthine (about 10-4 of that observed for xanthine) when using highly concentrated enzyme solutions, and low levels of activity were observed with 9-methylxanthine. The absorbance spectra of the products arising from 1-methylxanthine and 9-methylxanthine exhibited features at 289 nm and 291 nm (Fig. 1), consistent with the formation of 1-methyluric acid and 9-methyluric acid [9], respectively. Generation of the product from 9-methylxanthine was coupled to O2 consumption, as shown by use of an oxygen electrode, and to the decomposition of αKG, as analyzed by the OPDA assay (data not shown).
Fig. 1.
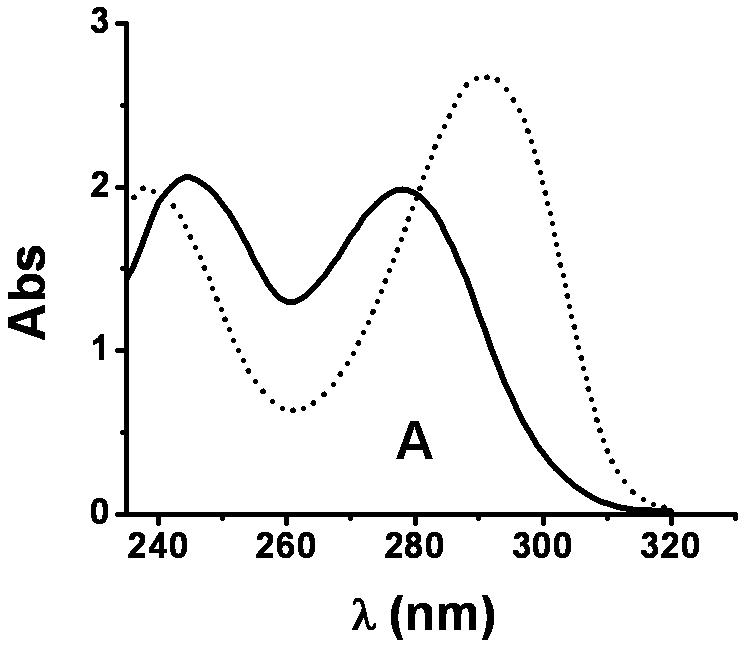
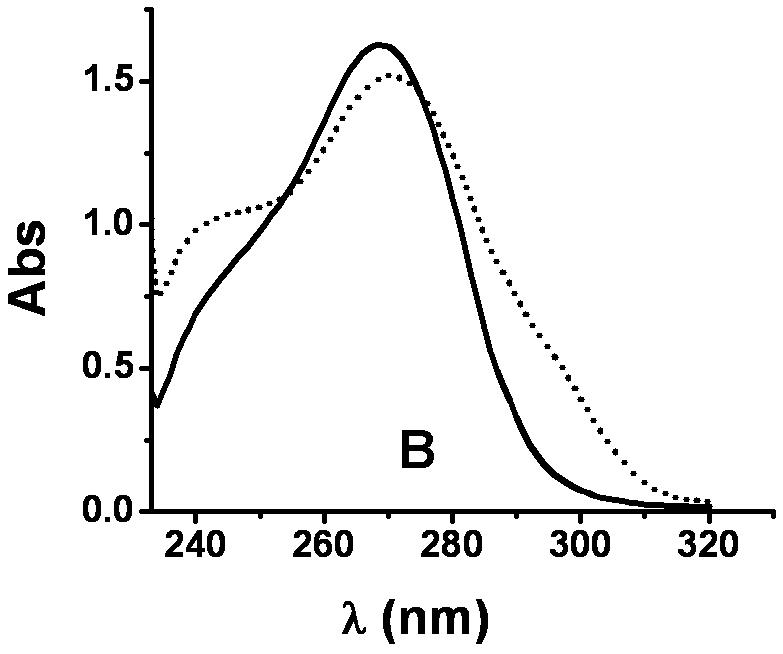
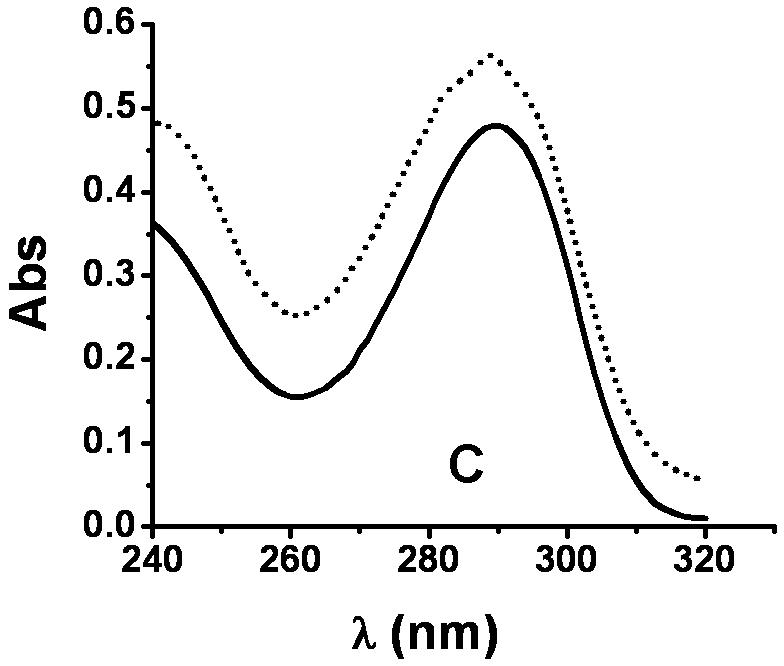
UV-visible spectra of 1-methylxanthine, 9-methylxanthine, and their products. (A) Spectrum of 9-methylxanthine in assay solution (solid) and the sample after 30 min of reaction (dotted) at 25 °C. The assay solution included 40 μM FeII, 1 mM αKG, 3.6 μM XanA, and 200 μM 9-methylxanthine in 50 mM MOPS, pH 7.4. (B) Spectrum of 1-methylxanthine in assay solution (solid) and the sample after 100 min of reaction at 25 °C (dotted), using conditions as above. (C) The spectrum of the product arising from the enzymatic transformation of 1-methylxanthine was calculated from B (dotted line) by measuring the absorption at 290 nm (0.747 absorbance units), determining ε290 for 1-methylxanthine (1,497 M-1 cm-1) and 1-methyluric acid (10,273 M-1 cm-1), using these results to estimate that the concentrations of 1-methylxanthine (149 μM) and 1-methyluric acid (51 μM) which totaled to 200 μM, and subtracting the spectrum of 149 μM 1-methylxanthine from the spectrum of the mixture. This was compared to the spectrum of authentic 1-methyluric acid (solid line).
The kinetic parameters associated with XanA utilization of 9-methylxanthine for wild-type enzyme and the seven variants are shown in Table 2. For wild-type XanA, the Km of 9-methylxanthine is 8.9-fold larger than that of xanthine while the kcat is approximately 5 % of that for the true substrate. Comparison of the data obtained for the wild-type enzyme with those for the mutant proteins provides insight into potential protein interactions involving the 9-methyl group. For example the E137A variant exhibited a 1.6-fold increase in kcat for 9-methylxanthine versus the wild-type enzyme. Small increases (1.1- and 1.2-fold) in kcat also were noted for the D138A and C357A variants. Moreover, the kcat/Km for all three mutants approach that of the control enzyme (57%, 77%, and 86%, respectively), whereas the effects of these same variants are greater with the natural substrate xanthine (35%, 31%, and 34% of the wild-type kcat/Km, respectively). One possible explanation of these results is that substitution of the small side chain of Ala for the carboxylates at position 137 and 138 or for Cys357, partially compensates for the presence of a methyl group at N-9 of xanthine. Thus, Glu137, Asp138, and Cys357 are suggested to be proximal to the N-9 position of substrate or their removal allows for more productive binding of the methylated xanthine.
6,8-DHP inhibition
6,8-DHP was previously shown to inhibit wild-type XanA [4], but its mechanism of inhibition was not examined. By contrast only very modest inhibition was noted with 2,8-DHP, and 8-hydroxypurine did not inhibit the enzyme [4]. These results indicated that XanA interactions with the C-6 oxygen were most important for inhibitor binding.
To examine the inhibitory effect of 6,8-DHP on XanA, progress curves of uric acid production were obtained under different inhibitor and substrate concentrations. The curves obtained for a constant substrate concentration and varied levels of inhibitor reveal a time-dependent inhibition of XanA by 6,8-DHP (Fig. 2A) whereby the initial rate, vi, decreases to a steady-state rate, vs, providing an apparent first-order rate constant, kobs. The values of vi, vs, and kobs were characterized according to equation 3 by using a variety of assay conditions. The vs is always very small (essentially zero) and could not be reliably estimated due to potential drifting of absorbance in these extended assays and to concern about the stability of XanA when diluted to these very low concentrations. For varied inhibitor concentrations, kobs exhibited a hyperbolic dependence on the concentration of 6,8-DHP (Fig. 2B), consistent with a slow-binding inhibitory mechanism involving the reversible binding of inhibitor followed by a conformational change to create a tightly bound state [10]. To distinguish the type of slow-binding inhibition mechanism, progress curves were obtained for a constant concentration of 6,8-DHP in the presence of varied substrate concentration (Fig. 2C). A replot of kobs versus substrate concentration reveals a negative slope (Fig. 2D) and confirms the mechanism as being competitive [11], as depicted in Scheme 2. Thus, 6,8-DHP competes with substrate to form an initial enzyme inhibitor complex (E·I) that slowly transforms to a more stable complex (E·I*). For such a mechanism, kobs varies with the inhibitor concentration [I] according to equation 4 [10] , where Ki = k4/k3. This equation simplifies to equation 5 when one defines Kiapp = Ki(1 + [S]/Km). Using the data from Fig. 2B for wild-type XanA, k5 = 2.0 × 10⁻³ s-1, k6 = 8.1 × 10⁻⁴ s-1, and Kiapp = 12.6 μM. k5 is larger than k6 suggesting the rate of formation of E·I* complex is much faster than its dissociation, which is in agreement with slow-binding inhibition mechanism.
| (4) |
| (5) |
Fig. 2.
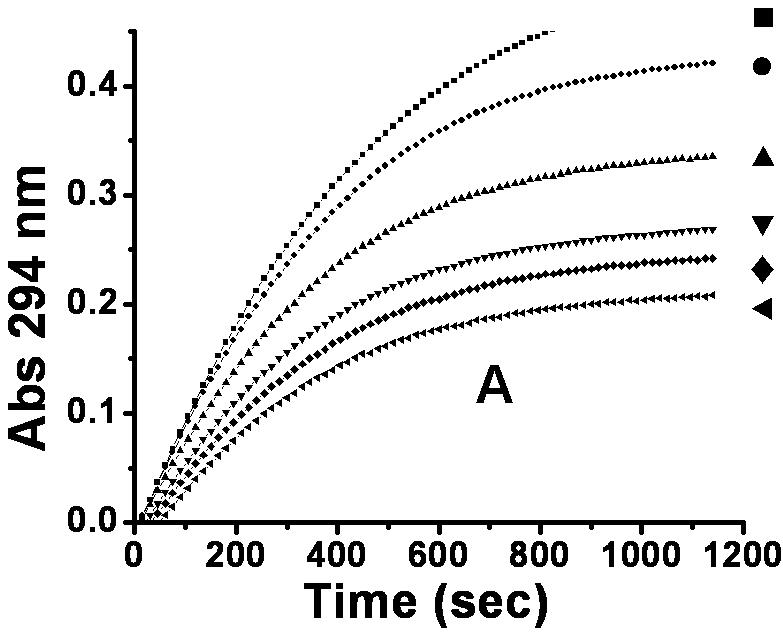
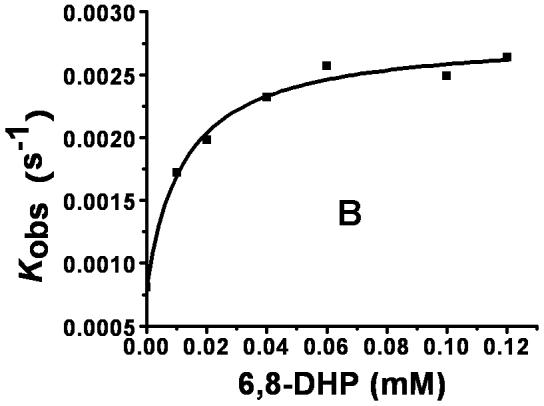
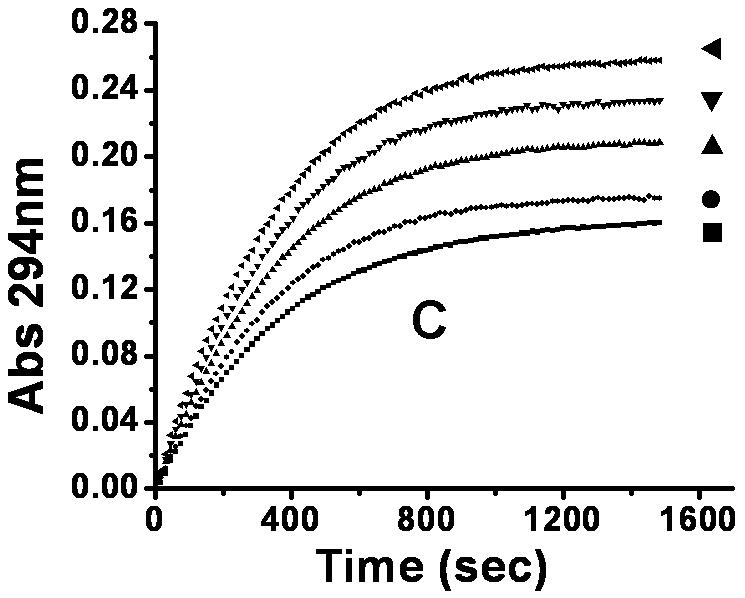
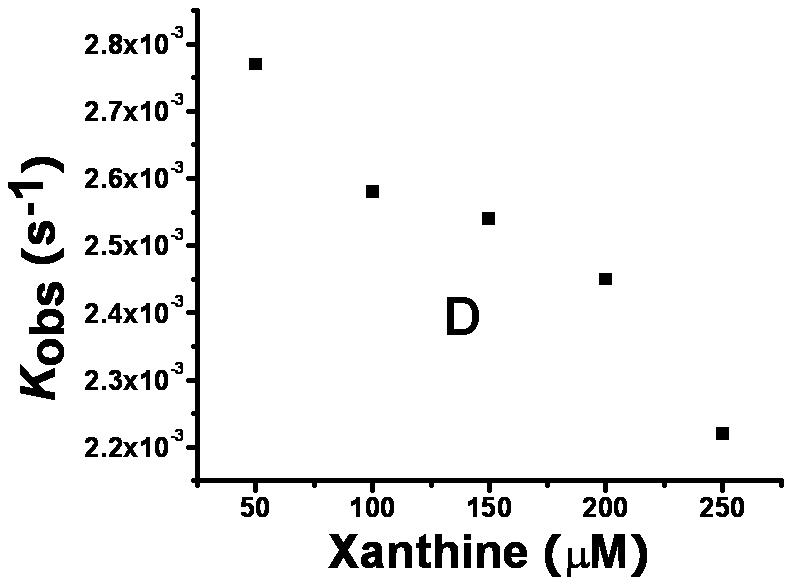
Interaction of XanA with 6,8-DHP. (A) Progress curves for XanA inhibition by varied concentrations of 6,8-DHP. 2.4 nM XanA was added to 50 mM MOPS buffer, pH 7.4, at 25 °C containing 40 μM FeII, 1 mM αKG, 200 μM xanthine, and 0 mM (■), 0.02mM (●), 0.04mM (▲), 0.06 mM (▼), 0.1 mM (◆) or 0.12 mM (◀) 6,8-DHP. The production of uric acid was monitored at 294 nm and the progress curves were fit to equation 3. (B) Dependence of kobs on the concentration of 6,8-DHP. The curve was fit to equation 5. (C) XanA progress curves were obtained as above, but in the presence of 0.1 mM 6,8-DHP and 50 μM (◀), 100 μM (▼), 150 μM (▲), 200 μM (●) or 250 μM (■) xanthine. The progress curves were fit to equation 3. (D) Dependence of kobs on the concentration of xanthine.
Scheme 2.
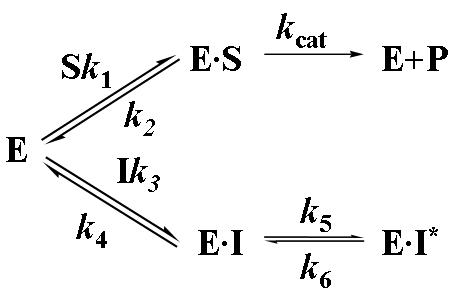
We analyzed the slow-binding inhibition kinetics of the putative active variant forms of XanA with 6,8-DHP in a similar manner (Table 3). Compared with the Kiapp of 12.6 μM calculated for wild-type XanA, the values for the E137A and D138A proteins were smaller, ranging from 3.0-3.6 μM. We attribute this decrease in Kiapp to the elimination of negative charge repulsion between the Glu137 or Asp138 carboxylates and the deprotonated C-8 hydroxyl group of 6,8-DHP that likely binds to FeII. This result provides additional support for Glu137 and Asp138 being located at the active site. The Kiapp increased significantly for both the Q356A and N358A proteins, suggesting that stabilizing interactions provided by the active site Gln356 and Asn358 side chains are abolished in these mutants. In particular, this result is consistent with hydrogen bonding between the C-6 hydroxyl group (or the corresponding keto tautomer) of 6,8-DHP and Gln356 and Asn358. For most of the mutants, k5 is larger than k6; however, the N358A variant exhibited the opposite result (k5 = 9.4 × 10⁻⁴ s-1, k6 = 2.3 × 10⁻³ s-1). This finding is consistent with the N358A enzyme lacking an important stabilizing hydrogen bond(s) to the C-6 hydroxyl group of 6,8-DHP, perhaps involved in the k5 transition and formation of the E·I* complex (Scheme 2).
Table 3.
Inhibition of wild-type XanA and its variants by 6,8-DHP
| XanA sample | k5 (s-1) a | k6 (s-1) | Kiapp (μM) |
|---|---|---|---|
| Wild-Type | (2.0 ± 0.1) × 10-3 | (8.1 ± 0.8) × 10-4 | 12.6 ± 2.4 |
| Q101A | (3.7 ± 0.2) × 10-3 | (5.4 ± 1.2) × 10-4 | 9.8 ± 1.7 |
| K122A | (3.7 ± 0.1) × 10-4 | (2.0 ± 0.1) × 10-4 | 10.4 ± 1.1 |
| E137A | ( 3.8 ± 0.1) × 10-3 | (2.5 ± 1.1) × 10-4 | 3.1 ± 0.4 |
| D138A | (6.0 ± 0.2) × 10-3 | (3.1 ± 1.7) × 10-4 | 3.6 ± 0.4 |
| Q356A | (5.8 ± 0.2) × 10-3 | (1.2 ± 0.1) × 10-3 | 102 ± 12 |
| C357A | (3.1 ± 0.1) × 10-3 | (7.5 ± 0.7) × 10-4 | 16.6 ± 2.0 |
| N358A | (9.4 ± 1.3) × 10-4 | (2.3 ± 0.1) × 10-3 | 81 ± 39 |
Kinetic analyses were carried out as described in the text, with the kinetic parameters defined according to equation 5.
Identification of a reactive thiol at the XanA active site
The homology model of XanA places Cys357 at the active site, a prediction that was directly tested by chemical modification studies. As illustrated in Fig. 3A, the incubation of XanA with various concentrations of 5,5′-dithiobis(2-nitrobenzoic acid) (DTNB or Ellman’s reagent, specific for reacting with thiol groups) led to concentration-dependent, first-order losses of activity. Significantly, the added presence of xanthine provided some protection to the enzyme (Δ symbols in Fig. 3A), consistent with a reaction between DTNB and a Cys residue at the active site. In contrast, αKG had much less of a protective effect when examined alone (□ symbols) or with xanthine (data not shown). When the DTNB inactivation studies were repeated with the C357A variant enzyme, the reagent yielded very little inactivation compared to the control enzyme (Fig. 3B and 3C). This result confirms the positioning of Cys357 at the XanA active site. Inactivation studies also were carried out with iodoacetamide (data not shown), a less specific reagent to thiol groups than DTNB. Higher concentrations of iodoacetamide were required to obtain XanA inactivation rates compared to DTNB, and either xanthine or αKG provided some protection against enzyme inactivation by this reagent with their combined presence yielding increased protection. The results obtained with iodoacetamide agree well with those using DTNB and are consistent with the presence of a reactive Cys residue near the xanthine-binding site.
Fig. 3.
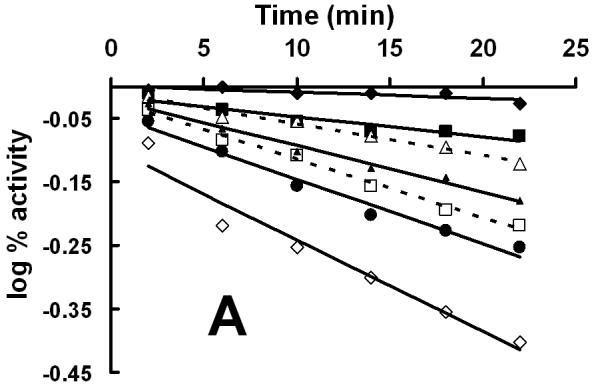
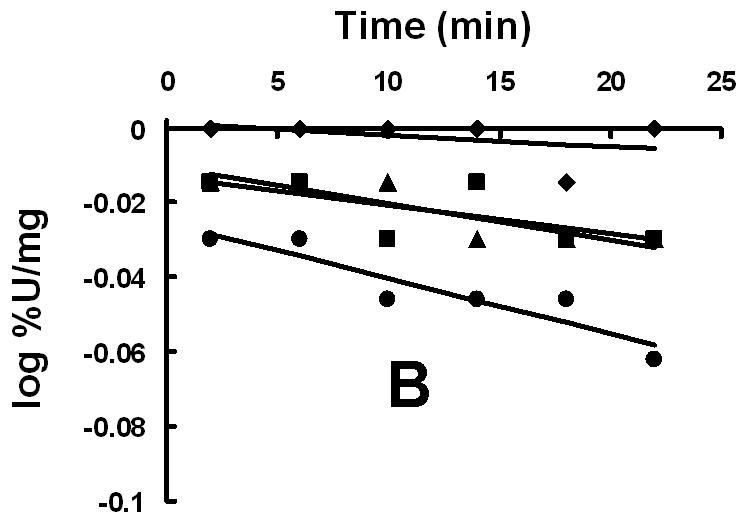
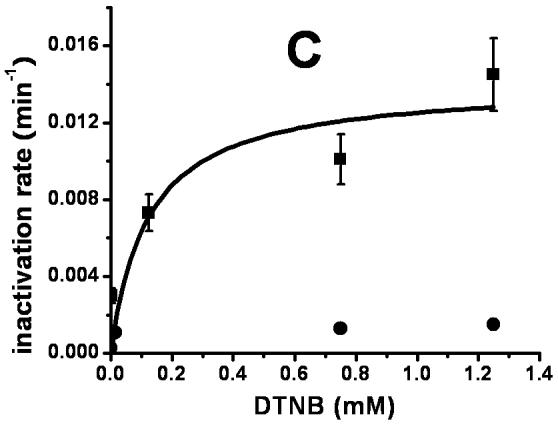
Inactivation of XanA by DTNB. (A) XanA (51 μg ml-1) was incubated on ice with 0 (◆), 2.5 μM (■), 125 μM (▲), 750 μM (●) or 1.25 mM (◇) DTNB in 50 mM MOPS buffer, pH 7.4, for the indicated times, then diluted 100-fold into buffer containing 40 μM FeII and 1 mM αKG. After blanking the spectrophotometer, xanthine was added to 200 μM. Additional samples containing 750 μM DTNB were examined with added 0.2 mM xanthine (--Δ--) or 1 mM αKG (--□--). The combination of added xanthine plus αKG was equivalent to added xanthine alone. (B) C357A XanA (51 μg ml-1) was incubated on ice with 0 (◆), 15 μM (■), 0.75 mM (▲), and 1.25 μM (●) DTNB in 50 mM MOPS buffer, pH 7.4, for the indicated times, and diluted and assayed as above. (C) Time-dependent inactivation of wild-type XanA (■) and the C357A variant (◆). The data for inactivation of wild-type protein were fit to the equation kinact = kinact(max)[DTNB]/(Kd + [DTNB]), where kinact(max) = 0.014 ± 0.003 min-1 and the Kd of DTNB = 0.12 ± 0.10 mM.
Oxygen reactivity of XanA in the absence of primary substrate
The addition of XanA to a buffered solution containing 40 μM FeII led to a slow rate of O2 consumption, similar to the background rate of consumption that occurred in the absence of enzyme (data not shown). For the Q101A, Q356A, and C357A mutant proteins, and to a lesser extent the E137A variant, a distinct pattern was observed with 15-20 μM O2 being consumed at a much greater initial rate (data not shown). These data were fit to equation 2 and the rapid initial rates of oxygen consumption, denoted vo, for all enzyme samples are shown in Table 4. The rapid phase of oxygen consumption also was observed for enzyme samples added to solutions containing FeII plus αKG (Fig. 4). The presence of cosubstrate led to increases in vo, which is especially noticeable for the K122A and N358A variants (Table 4). Control experiments carried out with Q101A and E137A forms of XanA confirmed that the amount of oxygen consumed in this rapid process correlated with the concentration of added FeII, so that approximately twice the amount of O2 was consumed when using 100 μM FeII (Fig. 4). The use of higher concentrations of the metal ion in the assay also led to increases in the background rate of oxygen consumption.
Table 4.
Oxygen reactivity of XanA and selected variants in the absence of primary substrate
| Mutant | FeII only vo (μM s-1) a | FeII + αKG vo (μM s-1) |
|---|---|---|
| Wild-type | 0.023 ±0.0001 | 0.030 ± 0.002 (0.136 ± 0.002) |
| Q101A | 0.38 ± 0.008 | 0.46 ± 0.01 (0.240 ± 0.002) |
| K122A | 0.051 ± 0.001 | 0.143 ± 0.001 |
| E137A | 0.17 ± 0.03 | 0.192 ± 0.018 (0.264 ± 0.004) |
| D138A | 0.061 ± 0.003 | 0.097 ± 0.002 |
| Q356A | 0.39 ± 0.01 | 0.48 ± 0.03 |
| C357A | 0.70 ± 0.03 | 0.73 ± 0.01 |
| N358A | 0.064 ± 0.001 | 0.159 ± 0.002 |
These representative rate data were obtained by using an oxygen electrode to measure the effects of adding enzyme samples (final concentrations of 1 μM) to solutions containing 50 mM MOPS buffer, pH 7.4, and 40 μM Fe (or 100 μM Fe for the values shown in parentheses), or the same plus 1 mM αKG, with the data fit to equation 2. The data shown for each sample are derived from replicate measurements obtained on the same day. The immediate response (vo) is attributed to ferroxidase activity with electrons from excess FeII used to reduce oxygen.
Fig. 4.
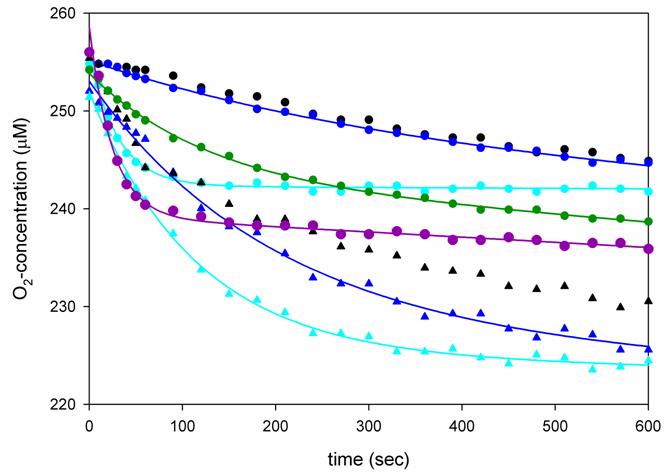
Oxygen consumption studies of XanA and its variants. An oxygen electrode was used to monitor O2 consumption at 25 °C in 50 mM MOPS buffer, pH 7.4, containing 1 mM αKG and 40 μM FeII (circles) or 100 μM FeII (triangle), and 1 μM enzyme (wild-type, dark blue; Q101A, cyan; D138A, purple; C357A, green). Enzyme-free control samples (black symbols, no lines) were analyzed for comparison. The data were fit using equation 2.
We attribute the rapid phase of oxygen consumption in the above studies to enzyme-catalyzed ferroxidase activity in which the exogenous metal ions are used to provide electrons for the reduction of O2 to hydrogen peroxide. Support for this activity was obtained by using the ABTS assay for quantifying peroxide production. To illustrate, the Q101A variant stimulated the production of hydrogen peroxide significantly faster than the wild-type protein, which generated H2O2 more rapidly than the non-protein controls (Fig. 5) when assayed in the presence of 120 μM FeII and 1 mM αKG. The initial rates of H2O2 production correlated with the initial rates of oxygen consumption for the mutant examined. The H2O2 produced in these reactions accounted for 48-63 % of the expected levels of this product (with the low stoichiometry likely due to the known FeIII inhibition of peroxidase). The increased levels of ferroxidase activity observed in several of the mutants compared to the wild-type enzyme could reasonably relate to increased accessibility of exogenous FeII to the enzyme metallocenter or to altered binding of αKG resulting in enhanced metal center reactivity. These results further support the placement of Gln101, Lys122, Asp137, Gln356, Cys357, and Asn358 at the active site in accordance to the homology model.
Fig. 5.
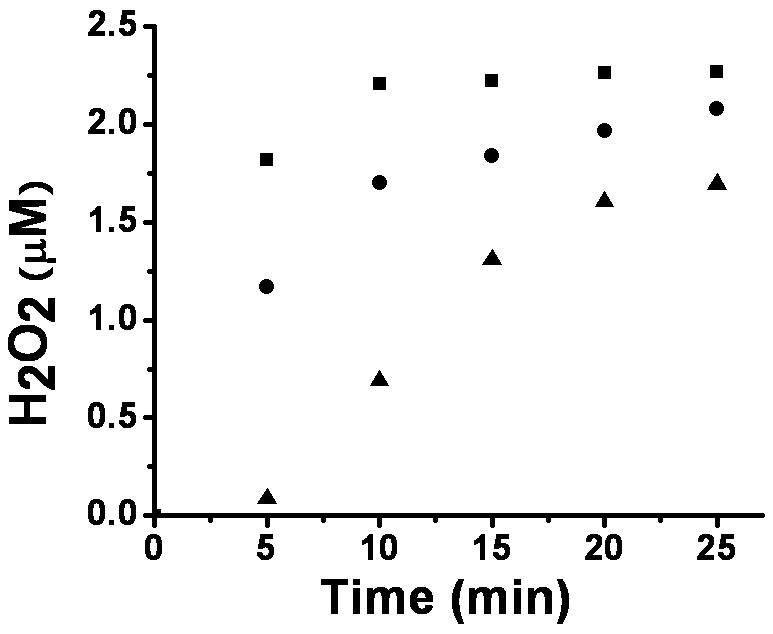
Hydrogen peroxide production by Q101A and wild-type XanA. The wild-type (●) and mutant (■) XanA samples (1 μM) were incubated with 120 μM FeII and 1 mM □KG in 50 mM MOPS buffer, pH 7.4, at room temperature. At selected time intervals, aliquots were mixed with ABTS assay solution (pH 5.0) containing horseradish peroxidase and the absorbance was monitored at 420 nm. A non-protein control sample (▲) was examined for comparison.
Model of the XanA active site based on analyses of its variants
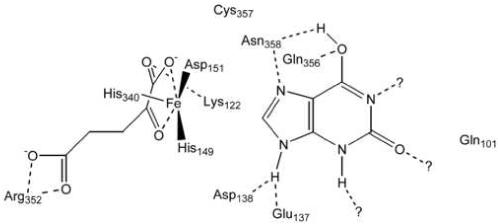
Our determinations of Kd (αKG), kinetic analyses with substrates and inhibitors, and measurements of ferroxidase activities for wild type and variant XanA enzymes were combined into the model for the XanA active site depicted in Scheme 3 (with substrates entering the active site from the right and some hydrogen bonds likely to arise from interactions with backbone amide groups). In this scheme, the FeII is shown bound by the His149, Asp151, and His340 side chains, as is almost certain from sequence comparisons to other related enzymes [4]. Mutations involving these residues abolished or greatly diminished activity. The αKG is illustrated as chelating the metal, in agreement with other members of this enzyme family, with stabilization provided by the appropriately positioned Arg352 (supported by sequence comparisons) and possibly by Lys122 (indicated by the increased Kd of the K122A variant). The primary substrate is shown binding to the enzyme active site via a constellation of hydrogen bonding interactions (some of which cannot be identified from our analyses), so that the disruption of any one hydrogen bond will lead to only modest effects on the kinetics. The Km and kcat parameters measured by steady-state kinetics for xanthine utilization by the wild type and variant enzymes cannot be used to directly infer which residues bind the substrate; however, this baseline information allows for such inferences to be made when combined with data obtained from studies using 9-methylxanthine (highlighting the possible importance of Glu137, Asp138, and Cys357) or 6,8-DHP (emphasizing negative interactions of inhibitor with Glu137 and Asp138 versus positive interaction with Gln356 and Cys357). Finally, the ferroxidase measurements of the variants provide added support for Gln101, Lys122, Asp137, Gln356, Cys357, and Asn358 being active site residues. Thus, our characterization of these mutant forms of XanA provides substantial confirmation of the homology model.
Scheme 3.
Lack of binding by related compounds
The proposed binding interactions for xanthine illustrated in Scheme 3 are consistent with the exquisite specificity of XanA. It is suggested that xanthine derivatives methylated at N-1, N-3, or the C-6 hydroxyl group are very poor or not substrates [4] because of steric clashes or the interruption of critical interactions. Although hypoxanthine (lacking the C-2 oxygen compared to xanthine) might appear to be a close mimic of the normal substrate, this mono-hydroxylated compound will have too little resonance energy to overcome the lactam intrinsic stability so hypoxanthine will predominate as the C-6 keto tautomer [12], thus disrupting several features important to binding. Xanthine derivatives hydroxylated at C-8 (such as 6,8-DHP) do not serve as substrates for the enzyme, but the hydroxyl group at C-8 could reasonably function as a metal ligand and contribute to inhibition. It is clear, however, that 8-hydroxypurine lacks many interactions proposed to be critical for binding xanthine, explaining why it is not an inhibitor of the enzyme [4]. 2,8-DHP is a somewhat better inhibitor, but it still lacks several hydrogen bond interactions likely to be present with xanthine and exhibits only weak binding. By contrast, the model correctly predicts that 6,8-DHP should be a potent inhibitor due to the interactions involving its N-1, C-6 hydroxyl group, N-7, and N-9 proton, along with metal coordination by the C-8 hydroxyl group.
The product of the xanthine/αKG dioxygenase reaction, uric acid, does not significantly inhibit the enzyme despite its close structural resemblance to the substrate. A critical difference between xanthine and uric acid is the distinction in pKa of the compounds. Whereas the pKa of xanthine is 7.4 [13], that of uric acid is 5.8 with the singly ionized species identified as the deprotonated N-3 and the dianion shown to be the N-3 plus N-9 deprotonated species [14]. Thus, in solution at neutral pH, uric acid is predominantly a species in which the C-2 enol is deprotonated while C-6 and C-8 are keto groups. The binding mode of substrate shown in Scheme 3 is inconsistent with these interactions, perhaps leading to ejection of the product from the active site.
To better understand the weak interaction of uric acid with XanA it is also instructive to examine the structure of a protein that specifically accepts uric acid as a substrate. Uric acid oxidase has been crystallized in the presence of several substrate analogues, including 9-methyluric acid [15]. In that case, the compound binds as the 2,6,8-tri-keto species where both N-3 and N-7 are deprotonated. Specifically, a Gln OE1 hydrogen bonds to the N-1 proton, the C-2 keto oxygen hydrogen bonds to a backbone amide as well as to an Arg residue, the same Arg is bound by the deprotonated N-3, the C-6 keto oxygen binds a Gln EN2, the deprotonated N-7 binds to a backbone amide, and the C-8 keto group binds to another backbone amide. If the uric acid formed in XanA were to adopt this structure, many of the postulated hydrogen bond interactions suggested for xanthine would be disrupted. In addition, the C-8 keto oxygen would likely exhibit repulsion by the nearby Asp151. Thus, one can readily rationalize the dissociation of the product from XanA.
Comparison to xanthine binding in other systems
Although the structural details differ greatly, the general features of the proposed mode of xanthine binding in XanA resemble the suggested interactions of xanthine with xanthine hydroxylase [16, 17] and the fungal xanthine/uric acid transporter [18, 19]. Similar to the proposed Gln356 and Asn358 hydrogen bonds to the xanthine C-6 enol proton, a Glu binds to the xanthine C-6 hydroxyl group in xanthine hydroxylase. In addition, the uncharacterized stabilization of the xanthine C-2 keto group in XanA is reminiscent of the C-2 keto group binding to an Arg residue in xanthine hydroxylase. Furthermore, the potentially bridging interactions of XanA Asn358, between the N-7 and C-6 hydroxyl group of xanthine resemble the interaction of a Glu in xanthine hydroxylase with both the N-3 and N-9 protons. No structure is available for any xanthine/uric acid transporter, but mutagenesis studies [18, 19] suggest that a particular Gln residue binds the deprotonated xanthine N-9 nitrogen, much like the model generated here. Final determination of XanA interactions with substrate must await elucidation of the crystal structure in the presence of substrate or inhibitor.
Acknowledgments
We thank David Lowe and Fabrice Jourdan (John Innes Centre, Norwich, U.K.) for providing the 6,8-DHP, Claudio Scazzocchio (Université Paris-Sud and Institut Universitaire de France) for insights related to xanthine binding in other systems, and Karen Friderici (Michigan State University) for use of her spectrofluorometer. These studies were supported by the National Institutes of Health (GM063584)
Footnotes
- αKG
- α-ketoglutarate
- ABTS
- 2,2′-azino-bis(3-ethylbenzthiazoline-6-sulfonic acid)
- 6,8-DHP
- 6,8-dihydroxypurine
- DTNB
- 5,5′-dithiobis(2-nitrobenzoic acid)
- Moco
- molybdopterin cofactor
- NTA
- nitrilotriacetic acid
- OPDA
- o-phenylenediamine
- TauD
- taurine/αKG dioxygenase
- XanA
- xanthine//αKG dioxygenase
Publisher's Disclaimer: This is a PDF file of an unedited manuscript that has been accepted for publication. As a service to our customers we are providing this early version of the manuscript. The manuscript will undergo copyediting, typesetting, and review of the resulting proof before it is published in its final citable form. Please note that during the production process errors may be discovered which could affect the content, and all legal disclaimers that apply to the journal pertain.
References
- [1].Hille R. Arch. Biochem. Biophys. 2005;433:107–116. doi: 10.1016/j.abb.2004.08.012. [DOI] [PubMed] [Google Scholar]
- [2].Darlington AJ, Scazzocchio C. Biochim. Biophys. Acta. 1968;166:557–568. doi: 10.1016/0005-2787(68)90243-8. [DOI] [PubMed] [Google Scholar]
- [3].Cultrone A, Scazzocchio C, Rochet M, Montero-Moràn G, Drevet C, Fernàndez-Martìn R. Molec. Microbiol. 2005;57:276–290. doi: 10.1111/j.1365-2958.2005.04686.x. [DOI] [PubMed] [Google Scholar]
- [4].Montero-Moràn GM, Li M, Rendóm-Huerta E, Jourdan F, Lowe DJ, Stumpff-Kane AW, Feig M, Scazzocchio C, Hausinger RP. Biochemistry. 2007;46:5293–5304. doi: 10.1021/bi700065h. [DOI] [PMC free article] [PubMed] [Google Scholar]
- [5].Eichhorn E, van der Ploeg JR, Kertesz MA, Leisinger T. J. Biol. Chem. 1997;272:23031–23036. doi: 10.1074/jbc.272.37.23031. [DOI] [PubMed] [Google Scholar]
- [6].Hausinger RP. Crit. Rev. Biochem. Mol. Biol. 2004;39:21–68. doi: 10.1080/10409230490440541. [DOI] [PubMed] [Google Scholar]
- [7].Clifton IJ, McDonough MA, Ehrismann D, Kershaw NJ, Granatino N, Schofield CJ. J. Inorg. Biochem. 2006;100:644–669. doi: 10.1016/j.jinorgbio.2006.01.024. [DOI] [PubMed] [Google Scholar]
- [8].Purpero VM, Moran GR. J. Biol. Inorg. Chem. 2007;12:587–601. doi: 10.1007/s00775-007-0231-0. [DOI] [PubMed] [Google Scholar]
- [9].Forrest HS, Hatfield D, Lagowski JM. J. Chem. Soc., Dalton Trans. 1961:963–968. [Google Scholar]
- [10].Morrison JF, Walsh CT. Adv. Enzymol. Rel. Areas Mol. Biol. 1988;61:201–301. doi: 10.1002/9780470123072.ch5. [DOI] [PubMed] [Google Scholar]
- [11].Ha TJ, Kudo I. J. Agric. Food Chem. 2007;55:446–451. doi: 10.1021/jf0616457. [DOI] [PubMed] [Google Scholar]
- [12].Pullman B, Pullman A. Quantum Biochemistry. Interscience Publishers; New York: 1963. [Google Scholar]
- [13].Dawson RMC, Elliott DC, Elliott WH, Jones KM. Data for Biochemical Research. Clarendon Press; Oxford: 1986. [Google Scholar]
- [14].Kahn K, Serfozo P, Tipton PA. J. Am. Chem. Soc. 1997;119:5435–5442. [Google Scholar]
- [15].Retailleau P, Colloc’h N, Vivarés D, Bonneté F, Castro B, El Hajji M, Mornon J-P, Monard g., Prangé T. Acta Crystallogr. 2004;D60:453–462. doi: 10.1107/S0907444903029718. [DOI] [PubMed] [Google Scholar]
- [16].Okamoto K, Matsumoto K, Hille R, Eger BT, Pai EF, Nishino T. Proc. Natl. Acad. Sci. USA. 2004;101:7931–7936. doi: 10.1073/pnas.0400973101. [DOI] [PMC free article] [PubMed] [Google Scholar]
- [17].Truglio JJ, Theis K, Leimkühler S, Rappa R, Rajagopalan KV, Kisker C. Structure. 2002;10:115–125. doi: 10.1016/s0969-2126(01)00697-9. [DOI] [PubMed] [Google Scholar]
- [18].Goudela S, Karatza P, Koukaki M, Frilingos S, Diallinas G. Molec. Membrane Biol. 2005;22:263–275. doi: 10.1080/09687860500093016. [DOI] [PubMed] [Google Scholar]
- [19].Koukaki M, Vlanti A, Goudela S, Pantazopoulou A, Gioule H, Tournaviti S, Diallinas G. J. Mol. Biol. 2005;350:499–513. doi: 10.1016/j.jmb.2005.04.076. [DOI] [PubMed] [Google Scholar]


