

Abstract
Time-domain (TD) electron paramagnetic resonance (EPR) imaging at 300 MHz for in vivo applications requires resonators with recovery times less than 1 microsecond after pulsed excitation to reliably capture the rapidly decaying free induction decay (FID). In this study, we tested the suitability of the Litz foil coil resonator (LCR), commonly used in MRI, for in vivo EPR/EPRI applications in the TD mode and compared with parallel coil resonator (PCR). In TD mode, the sensitivity of LCR was lower than that of the PCR. However, in continuous wave (CW) mode, the LCR showed better sensitivity. The RF homogeneity was similar in both the resonators. The axis of the RF magnetic field is transverse to the cylindrical axis of the LCR, making the resonator and the magnet co-axial. Therefore, the loading of animals, and placing of the anesthesia nose cone and temperature monitors was more convenient in the LCR compared to the PCR whose axis is perpendicular to the magnet axis.
Keywords: EPR, EPRI, Litz coil, parallel coil, in vivo imaging
Introduction
Radiofrequency (RF) electron paramagnetic resonance imaging (EPR/EPRI) is a powerful technique to obtain the spectroscopic and/or spatial information of free radical distribution in vivo. For small animal investigations, spin probes such as nitroxides (for probing free radical generation and reactions) or triarylmethyl (TAM) radicals (for oxymetry) are used. Employing nitroxides with in vivo EPR, the involvement of free radicals in animal disease models were investigated [1-3]. TAM radical, which shows single line EPR spectrum with a narrow and oxygen dependent line width, has been utilized for in vivo oxymetry [4; 5]. The feasibility of performing in vivo oxymetry by time domain (TD) EPR at 300 MHz has been demonstrated by administering TAM radical based contrast agent to mice and examining regional anatomies [6]. Subsequent efforts were directed to provide capability to study whole animals and evaluate receiver configurations and data-acquisition methodologies to enhance sensitivity [7].
To sample the rapidly decaying FID of the free radical probes such as TAM in vivo, receiver configurations with sub-microsecond recovery times are necessary [6, 7]. A variety of lumped circuit devices, including loop-gap resonator and reentrant resonator have been developed for EPR studies [5; 8-13]. We developed a parallel coil resonator (PCR) for CW EPR as well as TD EPR measurements [14]. A cross-loop resonator configuration was also developed for TD EPR at 250 MHz with ∼50 dB isolation between transmit and receive coils and successfully tested in phantom objects. [5; 8-13]. PCR works well in the low frequency (300 ∼ 750 MHz) range, which has adequate RF penetration in small animals and provides optimal sensitivity in detecting paramagnetic species such as TAM. However, with the present magnet configuration, the PCR has limited accessibility especially for in vivo experiments (Fig. 1). It was observed during many of our in vivo studies, that the animal core body temperature was slowly varying, which may influence the physiological parameters measured. The limited access space inside the magnet (Fig. 1) makes the placement of accessories for temperature control difficult. The Litz foil coils (LCR; Doty Scientific, Columbia, SC 29229) for MRI have demonstrated substantial improvement in B1 homogeneity at frequencies from 10 to 600 MHz for coil diameters from 6 to 300 mm [15]. The Doty Litz resonator consists of etched foil patterns with insulated crossovers to obtain RF flux transparency and improved SNR. The special symmetries permit an ideal current distribution that is compatible with high-frequency operation and is independent (to first order) of tuning, balancing, and matching adjustments. The LCR is reported to have higher sensitivity and homogeneity than quadrature birdcage under identical conditions [15]. Such features in the Litz resonator prompted us to evaluate its suitability for time-domain EPR imaging. In addition to these advantages, the direction of B1 field in LCR is transverse to the cylindrical axis of the coil support (Fig. 1A). In other words, resonator bore axis (the animal access direction) is co-axial with the Bo field of external magnet. Therefore, LCR has the advantage of easy accessibility for animal housing, and facilitates the placement of accessories for maintenance of the temperature control and anesthesia during in vivo measurement. In this paper, we compare the suitability of the LCR and the PCR for in vivo CW and TD EPRI study.
Figure 1.

Schematic configuration of resonators in EPR instrument, A) LCR and B) PCR in the magnet.
Results
Figure 2 shows the EPR spectra of 1 mM (CW mode) or 3 mM (TD mode) Oxo63 sample (2.5 mL) obtained from LCR, and PCR under identical conditions of the CW and TD EPR measurements. In the CW EPR operation, the LCR and PCR were tuned to have the maximum unloaded Q values of 327 and 244 respectively. The CW EPR signal intensity of Oxo63 solutions in LCR was higher than that in the PCR (Fig. 2A). The noise level in LCR was less compared to that found PCR coil. In the TD mode, the Q of LCR and PCR were adjusted to a value of 20 by a combination of overcoupling and resistive damping. In the case of TD EPR, FID of oxo63 reached maximum after dead time, and then decreased within 2 μs (Fig. 2B). The dead time of LCR and PCR were 438 and 480 ns, respectively. The signal intensity of Oxo63 (3 mM, 2.5 ml) was higher using the PCR compared to LCR (Fig. 2C).
Figure 2.

The 1D EPR spectra and FIDs of Oxo63. A) The EPR spectrum of Oxo63 in of LCR and PCR was obtained using 300 MHz CW EPR spectroscopy. The aqueous solution of Oxo63 had the total spin counts of 1.5 × 10¹⁸. B) Typical FIDs of oxo63 in LCR and PCR obtained by TD EPR. The instrumental parameters were follows: CW EPR sweep width = 5 G; scan time = 2 s, time constant = 0.003 s, modulation amplitude = 0.08 G and RF power = 2.5 mW. TD EPR pulse length = 120 ns, average = 20000 and repetition time = 20 μs. C) The absorption spectra obtained by Fourier transformation of the FIDs.
The SNR values determined from the spectra of Oxo63 at various concentrations measured in CW and TD modes are plotted in Fig. 3. In the CW EPR method, the performance of LCR was superior compared to PCR. The SNR values of LCR were nearly 2.5 times higher than those obtained from PCR (Fig. 3A). On the other hand, in TD EPR measurements, the PCR performed better than the LCR. The SNR values were 2.4 times larger than those from the LCR (Fig. 3B). The paramagnetic charge transfer compound N-methylpyridinium tetracyanoquinodimethane (NMP-TCNQ) was measured by TD EPR in the two resonators to check SNR. The SNR for a point sample of NMP-TCNQ in LCR and PCR were 99 and 183, respectively. The reason for the reversal in performance of LCR over PCR between CW EPR and TD EPR may be because of coupling differences brought about in damping the Q value. Since the unloaded Q of LCR was higher than PCR and both resonators need to be adjusted to a Q of 20 for TD EPR, a combination of overcoupling and resistive damping (2.4 kΩ for PCR vs 0.7 kΩ for LCR) was used. The levels of resistive damping used in LCR and PCR may account for the reversal of sensitivity in TD EPR. The lower damping resistance in the LCR leads to more dissipation of RF energy leading to relatively lower power inside the coil. The length of the 90° pulse width with a nominal 200 W output power from the amplifier was measured and it was found that the corresponding pulse widths were 100 ns for the PCR and 140 ns for the LCR as expected.
Figure 3.

Comparison of SNR of Oxo63 solution using (A) CW and (B) TD EPR. The instrumental parameters of CW measurement were: Sweep width = 1 G, scan time = 2 s, time constant = 0.003 s, modulation amplitude = 0.08 G; and RF power 2.5 mW. TD EPR measurement; Q = 25, pulse width 100 ns for PCR and 140 ns for LCR, Sampling rate = 500 MS/s, number of averages = 1000, number of experiments = 5.
Homogeneity of B1 field in both coils was mapped using NMP-TCNQ and the results are shown for the XZ plane in Fig. 4. The variation of EPR signal intensities of a point source in the FOV indicated in the figure was <10 % except in the four high intensity areas. On the other hand, the variation in intensities of PCR was also <10 %, however, and the sensitivity showed a decrease at both axial ends, which was not observed with LCR. Additionally, the intensity of the homogeneous area in LCR was globally higher than that of the PCR. The CW EPR image of the flat phantom shown in Figure 5A illustrates this result (Fig. 5B).
Figure 4.

The B1 homogeneity maps in A) LCR and B) PCR obtained using signal intensity from point sample of NMP TCNQ measured using 300 MHz CW EPR. This is shown as a 2D image, with the B1 homogeneity in terms of the CW EPR image intensity distribution (arbitrary units) shown on the color bar.
Figure 5.

Comparison of the image homogeneity from PCR and LCR using a flat slab-like spins phantom containing 2 mM Oxo63 solution. A) Schematic of the flat plate phantom. B) 2D CW EPR images of the flat plate phantom in LCR (left) and PCR (right). CW EPR imaging conditions were as follows: microwave frequency = 300 MHz, microwave power = 2.5 mW, modulation frequency = 13.5 kHz, modulation amplitude = 0.15 G, time constant = 0.003 s, FOV = 5 cm × 5 cm sweep width = 5 G, scan time = 2 s, number of projection = 18, field gradient = 1 G/cm and number of averages = 1. EPR image was reconstructed on 128 × 128 matrix by filtered back-projection method using Shepp-Logan filter.
In animal studies, placing temperature probe and nose cone for anesthesia was conveniently achieved using LCR. The mouse was positioned in the resonator that the lower abdomen was in the FOV. The pharmacokinetic images of mouse injected with Oxo63 were obtained using the LCR and a series of 2D images parallel to the coronal plane shown in Fig. 6. The kidney area showed increased intensity immediately after the injection. Clearance of the spin probe gradually from kidney to bladder area was clearly observed.
Figure 6.
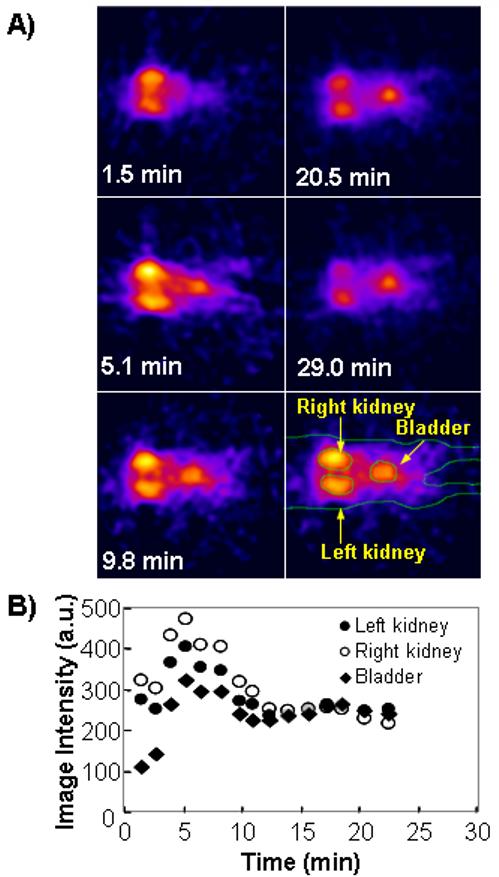
2D CW EPR images of a mouse in LCR with temperature control after injection of Oxo63 solution (A). The region of interest (ROI) was selected using EPR image (right-bottom). The time course of Oxo63 in kidney was computed by selecting the corresponding regions in the sequential images and averaging the pixel intensities. In vivo CW EPR, imaging conditions were the same as the phantom study except for time constant = 0.003 s, FOV was 7 × 7 cm, scan time = 162 s, sweep width = 15 G, number of projection = 18 and the magnitude of the field gradient = 2.5 G/cm. EPR image was reconstructed on 128 × 128 matrix by filtered back-projection with Shepp-Logan filter.
Discussion
There is always a demand for improved resonance structures for small animal imaging both in the CW mode and pulsed mode. Suitable large size resonators with good sensitivity, B1 field homogeneity and easy animal handling accessibility are essential for obtaining reliable physiological information from imaging experiments. Here we have examined the capability of LCR, widely used in NMR, for RF EPR imaging which allows for convenient animal handling compared to existing configurations [12-14]. Specifically, issues such as resonator recovery times, SNR, B1 field homogeneity, ease of animal handling were the aspects compared.
Our results indicate that both the PCR and the LCR are equally suitable for small animal EPR imaging in CW & TD mode. Both the LCR and PCR displayed sub-microsecond recovery times making it possible to capture the FIDs which typically last between 1-3 microseconds. The geometry of the LCR with its B1 transverse to the cylinder axis makes it easy for loading the mouse. The LCR and the Zeeman magnet have their axes parallel, and irrespective of the length of the coil, there is enough space available at both ends of the LCR for accommodating temperature control and anesthesia delivery accessories. Further, it was noticed that with the same Q the LCR had a 90°pulse duration which was longer by a factor of 40% compared to that of PCR. This means that the LCR had a relatively poorer RF power to magnetic field conversion efficiency. There were multiple resonance modes for the LCR, but these were too far beyond the RF band width of the resonator at 300 MHz to cause any leakage of power to these non-resonant modes. In CW operations when the resonators were critically coupled, the Q of LCR was higher than that of the PCR which may account for its higher sensitivity. The higher sensitivity (detection efficiency) of the LCR over PCR for CW operations is due to the higher unloaded Q of the former, and the small solid state point sample of TCNQ that was used to check the relative sensitivities of the two resonators did not change the Q very much. On the other hand, the higher sensitivity of the PCR over LCR for time domain applications may be a result of the different contributions from resistive damping between LCR and PCR to lower the Q to 20 from their unloaded values leading to difference in the RF power to magnetic field conversion efficiency. This is further corroborated by the larger 90° pulse width (140 ns) for the LCR (compared to that of 100 ns for the PCR) and its consequent reduced sensitivity for pulsed operations.
In the evaluation of in vivo imaging, the pharmacokinetics, metabolism, and reaction of the probe are critically influenced by the body temperature of the mouse. Under anesthesia, the mouse temperature decreases with time. Therefore, the maintaining of the temperature is important to obtain correct physiological information. Reijnders et al. [16] reported that it is important to maintain normal core temperature in BOLD effect of MRI. Actually, the 2D CW EPR image of the mouse with temperature control using LCR showed a different pharmacokinetics of the spin probe compared to our previous results with the PCR without temperature control (data not shown). Therefore, LCR enabled the measurement of small animals while maintaining the physiological temperature, which was difficult with the PCR.
Conclusion
The utility of LCR was compared with the PCR using CW and TD EPR spectroscopy and imaging. The LCR in the CW EPR operation showed better sensitivity compared to PCR. Additionally, axial configuration of the Litz coil provides more space at both ends of the coil enabling easy animal handling. With this increased accessibility, it was possible to measure accurately the pharmacokinetics of the spin probe with temperature control under the physiological conditions.
Experimental
Chemicals
Tris[8-carboxy-2,2,6,6-tetrakis (2-hydroxymethyl) benzo [1,2-d:4,5-d_] bis(1,3)dithio-4-yl]methyl radical (Oxo63) was obtained from Nycomed Innovation AB (Malmo, Sweden). Deionized water was used for all experiments. Other materials used were of analytical grade.
Animals
Female C3H mice were supplied by the Frederick Cancer Research Center, Animal Production (Frederick, MD). Animals, received at six weeks of age, were housed five per cage in climate controlled circadian rhythm-adjusted rooms and were allowed food and water ad libitum. Experiments were carried out in compliance with the Guide for the Care and Use of Laboratory Animal Resources (1996), National Research Council, and approved by the National Cancer Institute Animal Care and Use Committee. Imaging studies were performed within 4 weeks of their arrival at the facility. Their body weights measured before the experiments were in the range 20-25 g. Squamous cell carcinoma was implanted and grown on the right hind leg of the animal for a week.
EPR Spectrometers and Resonators
Spectroscopy/imaging were carried out by 300 MHz TD and CW EPR spectrometers [17; 18]. LCR was purchased from Doty Scientific Inc. (South Carolina, USA). The dimensions of LCR and PCR were identical: 30 mm diameter and 50 mm length [14; 15]. The matching and tuning is done remotely, and a resistance added in parallel allows the Q to be damped to a lower value when used in pulsed mode. The Q may also be lowered by over-coupling. It should be noted that unlike a conventional resonance circuit with C in parallel with a series combination of L and R, the PCR used in our imaging experiments is a parallel resonant circuit with inductance L, capacitance C and resistance R, are all in parallel. The LCR was tuned to a frequency of 300 MHz and matched to 50 Ω impedance. Provision was also made in the LCR to insert damping resistance of appropriate value to lower the Q as needed. For CW measurements, both PCR and LCR were used in a critically coupled mode. For CW measurements, the unloaded Q values of LCR and PCR were adjusted to the maximum values of 327 and 244, respectively. The loaded Q values with 20 mL phosphate buffered saline (PBS) of those coils were 69 and 57 respectively. For TD EPR, Q values of both the coils were adjusted to Q of 20 by a combination of both over-coupling and resistive damping to achieve optimal B1 as well as minimal reflected power.
CW EPR conditions were as follows: operating frequency = 300 MHz, RF power = 2.5 mW, modulation frequency = 13.5 kHz, modulation amplitude = 0.08 G, time constant = 0.003 s, sweep width = 5 G, and number of averages = 1. TD EPR; number of averages per projection = 1000, and record length per FID = 4K points at a sampling rate of 500 MS/s.
Sensitivity and B1 field distribution
To compare sensitivity of both LCR and PCR, aqueous solutions of different spin concentrations (2.4 ∼ 24 × 1016 spins) of Oxo63 were used. EPR spectra of these samples (each 2 mL volume) were measured using LCR and PCR in CW and TD EPR modes. The signal to noise ratios (SNR) of these spectra for various concentrations of Oxo63 were calculated by dividing the total height of the derivative spectrum divided by the standard deviation in noise in the case of CW spectrum, and by dividing the absorption peak height by the standard deviation in noise for the time-domain spectrum. These are plotted in Fig. 3. In addition to avoid filling-factor differences, a point NMP-TCNQ sample (less 1 mg) was used for SNR study and placed at the center of the both resonators and measured by TD EPR. In order to examine the B1 field homogeneity, EPR signal intensities of a point source of solid charge-transfer complex, NMP-TCNQ was utilized as described previously [14]. A lucite holder was fabricated that allowed the placement of NMP-TCNQ sample at different (total of 84) points to sample the radial and axial regions uniformly. The NMP-TCNQ sample showed single narrow EPR spectrum line width (200 mG) and occupied a total volume of ∼ 5 μL which was below the expected spatial resolution in the EPR image. By moving this point source radially and axially in small steps, EPR spectra were collected at each location to map the B1 field (Fig. 4). Since the point sample of NMP-TCNQ did not cause any reduction in the Q the B1 profile explored in this experiment corresponds to the unloaded resonator.
Phantom imaging
For phantom imaging, a flat plate containing 2 mM aqueous Oxo63 solution, shown in Fig. 5, were used. Two-dimensional EPR images of the phantom were obtained in the 300 MHz CW imager using both LCR and PCR. CW EPR imaging conditions were as follows: frequency = 300 MHz, RF power = 2.5mW, modulation frequency = 13.5 kHz, modulation amplitude = 0.15 G, time constant = 0.03 s, FOV = 5 cm × 5 cm sweep width = 5 G, scan time = 54 s, number of projection = 18, field gradient = 1 G/cm and number of averages = 1. CW EPR images were reconstructed on 128 × 128 matrix by filtered back-projection method using a Shepp-Logan filter.
Animal imaging
Mice were anesthetized using isoflurane (1.5 %) in medical air (700 mL/min). The mouse was placed inside the 30 × 50 mm LCR or PCR. The tail vein was cannulated for the injection of Oxo63 solution. Data acquisition was started simultaneously with the injection of the Oxo63 (1.8 μmol/g b.w., i.e. 10 μL/g b.w. of 75 mM solution). EPRI data acquisition was carried out using home built 300 MHz CW and TD EPR imagers [19]. In vivo CW EPR, imaging conditions were the same as the phantom study except for time constant = 0.03 s, scan time = 8 s, modulation amplitude = 0.15 G, FOV = 7 × 7 cm, sweep width = 15 G and the magnitude of the field gradient = 2.5 G/cm. EPR image was reconstructed on 128 × 128 matrix by filtered back-projection with Shepp-Logan filter.
Acknowledgment
This research was supported by the intramural research program of the NIH, NCI, and the Center for Cancer Research.
Footnotes
Publisher's Disclaimer: This is a PDF file of an unedited manuscript that has been accepted for publication. As a service to our customers we are providing this early version of the manuscript. The manuscript will undergo copyediting, typesetting, and review of the resulting proof before it is published in its final citable form. Please note that during the production process errors may be discovered which could affect the content, and all legal disclaimers that apply to the journal pertain.
Reference
- [1].Yasukawa K, Kasazaki K, Hyodo F, Utsumi H. Non-invasive analysis of reactive oxygen species generated in rats with water immersion restraint-induced gastric lesions using in vivo electron spin resonance spectroscopy. Free Radic Res. 2004;38:147–55. doi: 10.1080/1071576036001641196. [DOI] [PubMed] [Google Scholar]
- [2].Mikuni T, He G, Petryakov S, Fallouh MM, Deng Y, Ishihara R, Kuppusamy P, Tatsuta M, Zweier JL. In vivo detection of gastric cancer in rats by electron paramagnetic resonance imaging. Cancer Res. 2004;64:6495–502. doi: 10.1158/0008-5472.CAN-04-0319. [DOI] [PubMed] [Google Scholar]
- [3].Yamato M, Egashira T, Utsumi H. Application of in vivo ESR spectroscopy to measurement of cerebrovascular ROS generation in stroke. Free Radic Biol Med. 2003;35:1619–31. doi: 10.1016/j.freeradbiomed.2003.09.013. [DOI] [PubMed] [Google Scholar]
- [4].Matsumoto K, Subramanian S, Devasahayam N, Aravalluvan T, Murugesan R, Cook JA, Mitchell JB, Krishna MC. Electron paramagnetic resonance imaging of tumor hypoxia: enhanced spatial and temporal resolution for in vivo pO2 determination. Magn Reson Med. 2006;55:1157–63. doi: 10.1002/mrm.20872. [DOI] [PubMed] [Google Scholar]
- [5].Mailer C, Sundramoorthy SV, Pelizzari CA, Halpern HJ. Spin echo spectroscopic electron paramagnetic resonance imaging. Magn Reson Med. 2006;55:904–12. doi: 10.1002/mrm.20849. [DOI] [PubMed] [Google Scholar]
- [6].Murugesan R, Cook JA, Devasahayam N, Afeworki M, Subramanian S, Tschudin R, Larsen JA, Mitchell JB, Russo A, Krishna MC. In vivo imaging of a stable paramagnetic probe by pulsed-radiofrequency electron paramagnetic resonance spectroscopy. Magn Reson Med. 1997;38:409–14. doi: 10.1002/mrm.1910380309. [DOI] [PubMed] [Google Scholar]
- [7].Subramanian S, Devasahayam N, Murugesan R, Yamada K, Cook J, Taube A, Mitchell JB, Lohman JA, Krishna MC. Single-point (constant-time) imaging in radiofrequency Fourier transform electron paramagnetic resonance. Magn Reson Med. 2002;48:370–9. doi: 10.1002/mrm.10199. [DOI] [PubMed] [Google Scholar]
- [8].Subczynski WK, Lukiewicz S, Hyde JS. Murine in vivo L-band ESR spin-label oximetry with a loop-gap resonator. Magn Reson Med. 1986;3:747–54. doi: 10.1002/mrm.1910030510. [DOI] [PubMed] [Google Scholar]
- [9].Ono M, Suenaga A, Hirata H. Experimental investigation of RF magnetic field homogeneity in a bridged loop-gap resonator. Magn Reson Med. 2002;47:415–9. doi: 10.1002/mrm.10030. [DOI] [PubMed] [Google Scholar]
- [10].Chzhan M, Kuppusamy P, Samouilov A, He G, Zweier JL. A tunable reentrant resonator with transverse orientation of electric field for in vivo EPR spectroscopy. J Magn Reson. 1999;137:373–8. doi: 10.1006/jmre.1998.1689. [DOI] [PubMed] [Google Scholar]
- [11].Placidi G, Brivati J, Alecci M, Testa L, Sotgiu A. Two-demensional 220 MHz fourier transform EPR imaging. Phys Med Biol. 1998;43:1845–50. doi: 10.1088/0031-9155/43/7/004. [DOI] [PubMed] [Google Scholar]
- [12].Curto CA, Placidi G, Sotgiu A, Alecci M. An open volume, high isolation, radio frequency surface coil system for pulsed magnetic resonance. J Magn Reson. 2004;171:353–8. doi: 10.1016/j.jmr.2004.09.015. [DOI] [PubMed] [Google Scholar]
- [13].Rinard G, Quine R, Eaton G, Eaton S. 250 MHz Crossed-Loop resonator for pulsed electron paramagnetic resonance. Concepts in Magnetic Resonance. 2002;15:37–46. [Google Scholar]
- [14].Devasahayam N, Subramanian S, Murugesan R, Cook JA, Afeworki M, Tschudin RG, Mitchell JB, Krishna MC. Parallel coil resonators for time-domain radiofrequency electron paramagnetic resonance imaging of biological objects. J Magn Reson. 2000;142:168–76. doi: 10.1006/jmre.1999.1926. [DOI] [PubMed] [Google Scholar]
- [15].Doty FD, Entzminger G, Jr., Hauck CD. Error-tolerant RF litz coils for NMR/MRI. J Magn Reson. 1999;140:17–31. doi: 10.1006/jmre.1999.1828. [DOI] [PubMed] [Google Scholar]
- [16].Reijnders K, English SJ, Krishna MC, Cook JA, Sowers AL, Mitchell JB, Zhang Y. Influence of body temperature on the BOLD effect in murine SCC tumors. Magn Reson Med. 2004;51:389–93. doi: 10.1002/mrm.10695. [DOI] [PubMed] [Google Scholar]
- [17].Koscielniak J, Devasahayam N, Moni S, Kuppusamy P, Yamada K, Mitchell JB, Krishna MC, Subramanian S. 300 MHz continuous wave electron paramagnetic resonance spectrometer for small animal in vivo imaging. Rev. Sci. Instrum. 2000;71:4273–81. [Google Scholar]
- [18].Devasahayam N, Subramanian S, Murugesan R, Hyodo F, Matsumoto K, Mitchell JB, Krishna MC. Strategies for improved temporal and spectral resolution in in vivo oximetric imaging using time-domain EPR. Magn Reson Med. 2007;57:776–83. doi: 10.1002/mrm.21194. [DOI] [PubMed] [Google Scholar]
- [19].Yamada K, Murugesan R, Devasahayam N, Cook JA, Mitchell JB, Subramanian S, Krishna MC. Evaluation and comparison of pulsed and continuous wave radiofrequency electron paramagnetic resonance techniques for in vivo detection and imaging of free radicals. J Magn Reson. 2002;154:287–97. doi: 10.1006/jmre.2001.2487. [DOI] [PubMed] [Google Scholar]