Abstract
Iron depletion improves insulin resistance in patients with nonalcoholic fatty liver disease and diabetes and also stabilizes the hypoxia-inducible factor (HIF)-1, resulting in increased glucose uptake in vitro. This study investigated the effect of iron depletion by deferoxamine on insulin signaling and glucose uptake in HepG2 hepatocytes and in rat liver. In HepG2 cells, deferoxamine stabilized HIF-1α and induced the constitutive glucose transporter Glut1 and the insulin receptor. Up-regulation of insulin receptor by deferoxamine was mimicked by the intracellular iron chelator deferasirox and the hypoxia inducer CoCl2 and required the HIF-1 obligate partner ARNT/HIF-1β. Iron depletion increased insulin receptor activity, whereas iron supplementation had the opposite effect. Deferoxamine consistently increased the phosphorylation status of Akt/PKB and its targets FoxO1 and Gsk3β, which mediate the effect of insulin on gluconeogenesis and glycogen synthesis, and up-regulated genes involved in glucose uptake and utilization. Iron depletion of Sprague-Dawley rats increased HIF-1α expression, improved glucose clearance, and was associated with up-regulation of insulin receptor and Akt/PKB levels and of glucose transport in hepatic tissue. Conversely, gluconeogenic genes were not affected. In rats with fatty liver because of a high-calorie and high-fat diet, glucose clearance was increased by iron depletion and decreased by iron supplementation. Thus, iron depletion by deferoxamine up-regulates glucose uptake, and increases insulin receptor activity and signaling in hepatocytes in vitro and in vivo.
Increased serum ferritin and body iron stores have been recognized as a feature of the metabolic syndrome and type 2 diabetes.1,2,3,4 Hepatic iron deposition has been detected in up to one third of patients with nonalcoholic fatty liver disease (NAFLD),5 characterized by hepatic insulin resistance, which affects ∼20% of the general population,6 and is considered a manifestation of the metabolic syndrome.7,8 A reciprocal influence between iron metabolism and insulin has been suggested to explain these findings. Genetic and acquired factors lead to increased iron absorption and storage in hepatocytes, with consequent alteration in the redox status.9 Insulin stimulates ferritin synthesis and facilitates iron uptake,10 and conversely, iron reduces the hepatic extraction and the metabolism of insulin, leading to peripheral hyperinsulinemia,11 and may increase oxidative stress, which inhibits the internalization and the actions of insulin.12 Based on these findings,10 preliminary studies have evaluated the effect of iron depletion by phlebotomy on glucose metabolism. Iron depletion reduced hyperinsulinemia, hyperglycemia, and improved liver function in patients with diabetes and NAFLD.13,14,15 However, whether mild iron overload contributes to insulin resistance by affecting redox status in hepatocytes, as well as the cellular pathways by which iron depletion is effective in improving glucose homeostasis are undemonstrated.13,16
Insulin exerts a wide range of metabolic functions in target tissues17 by interacting with specific, high-affinity insulin receptors (InsR),18,19,20 which are down-regulated in diabetes, because of hyperinsulinemia and hyperglycemia.21,22 Insulin directly regulates hepatic glucose output by binding to InsR,23 and the liver is the major site for insulin clearance via InsR-mediated uptake and degradation.24 Genetic deletion of InsR in mice leads to severe insulin resistance, hyperglycemia, and fatty liver,25,26 a picture similar to that of patients with severe NAFLD.
Decreased expression of the hypoxia-inducible factors (HIFs), involved in iron and oxygen sensing, has been implicated in the pathogenesis of diabetes through the down-regulation of the expression of InsR, of the dependent kinase Akt/PKB, and of molecules involved in glucose utilization in pancreatic β-cells.27 Indeed, HIF-1α levels are regulated by a family of prolyl-4-hydroxylases, which require iron and oxygen. In the presence of iron and/or oxygen, HIF-1α is hydroxylated and is bound by the Von Hippel-Lindau tumor suppressor protein and targeted for proteosomal degradation. The reduction of oxygen tension or iron deficiency results in HIF-1α stabilization28; the stabilized HIF-1α dimerizes with the obligate partner HIF-1β/ARNT and regulates gene transcription by binding to hypoxia-responsive elements in the promoters of several genes orchestrating the response to hypoxic conditions. Besides regulating erythropoiesis and angiogenesis, HIF-1α has also been shown to increase glucose uptake by inducing Glut1,28 and glucose metabolism,29,30 thus favoring a shift to anaerobic metabolism. We thus hypothesized that HIF-1α could represent a link between glucose and iron metabolism.
The aim of this study was to analyze whether iron depletion influences glucose uptake and InsR activity in hepatocellular cell lines characterized by physiological regulation of insulin signaling,22 and in an in vivo model of iron depletion. We chose to induce iron depletion by deferoxamine (Dfo), a clinically used compound derived from a bacterial sideramine that chelates free Fe3+ in extracellular spaces, thus progressively depleting cells of this metal.
Experimental Procedures
Cell Culture
Human HepG2 cells were grown in RPMI 1640 medium. Hepa-1 C4 mouse hepatocytes, not expressing HIF-1β/ARNT, and their wild-type control Hepa-1 C1C7 mouse hepatocytes31 were grown in α-minimal essential medium. Media were supplemented with 10% fetal calf serum (FCS), 1% Penicillin Streptomycin, and 1% L-GLN (Invitrogen, Carlsbad, CA). SV40 immortalized mouse hepatocytes, isolated from embryonic livers of transgenic mice lacking InsR (InsR−/−) and wild-type controls were maintained in α-minimal essential medium supplemented with 1 mmol/L L-GLN, 200 nmol/L dexamethasone, and 4% FCS.32 Cells were maintained in a humidified atmosphere with 5% CO2 at 37°C. Cell viability was assessed in triplicate by Trypan blue exclusion. Unless otherwise specified, cells were treated with 100 μmol/L Dfo, 150 μmol/L cobalt chloride (CoCl2), 150 μmol/L ferric ammonium citrate (FAC), 25 μmol/L deferasirox (Novartis, Basel, Switzerland), 33 mmol/L glucose, and 0.33 μmol/L insulin for 24 hours before experiments.
Iron Responsive Protein (IRP) Activity Assay
Total IRP activity, reflecting intracellular free iron availability (the higher IRP activity, the lower iron availability), was measured by RNA band shift assay as previously described.33
Oxidative Stress Evaluation
Oxidative stress was measured by protein carbonylation, measured by Oxyblot (Chemicon, Temecula, CA),12 according to the manufacturer’s instructions.
Western Blot Analysis
Cells were lysed in RIPA buffer containing 1 mmol/L Na-orthovanadate, 200 mmol/L phenylmethyl sulfonyl fluoride, and 0.02 μg/μl aprotinin. Equal amounts of total cellular proteins (50 μg) were separated by sodium dodecyl sulfate-polyacrylamide gel electrophoresis and transferred electrophoretically to polyvinylidene difluoride membrane (Bio-Rad, Hercules, CA). Membranes were incubated with anti-HIF-1α, InsR, Akt/PKB, FoxO1, and Gsk3 antibodies (Santa Cruz Biotechnology, Santa Cruz, CA), and phosphorylated Akt/PKB (p-Akt), phosphorylated FoxO1 (p-FoxO1), and phosphorylated Gsk3β (p-Gsk3β) antibodies (Cell Signaling Technology, Danvers, MA). For quantitative analysis, gels were scanned and analyzed by ImageJ software provided by the National Institutes of Health (Bethesda, MD), as previously described.34
Isolation of Cellular RNA
RNA was isolated by a guanidinium isothiocyanate-phenol-chloroform procedure using Trizol (Invitrogen).
Quantitative Real Time-Polymerase Chain Reaction (PCR)
First-strand cDNA was synthesized with equal amounts (1 μg) of total RNA, by the SuperScript first strand synthesis system (Invitrogen). Quantitative reverse transcriptase (qRT)-PCR was performed with TaqMan universal master mix (1×), plus the assays specific for the genes of interest (MyScience; Applied Biosystem, Foster City, CA). All of the reactions were performed in triplicate in the ABI Prism 7700 sequence detector, in a 25-μl final volume.
Insulin Iodination and InsR Activity Assay
Bovine insulin was purchased from Sigma, St. Louis, MO. Insulin (1.5 μg) was iodinated before each experiment with 18.5 MBq 125iodine (Amersham, Stockholm, Sweden) and 1,3,4,6-tetrachloro-3α,6α-diphenylglycouril (1 mg/ml, Iodogen; Sigma), obtaining a specific radioactivity of 80,000 to 130,000 cpm/ng of protein. Cells were incubated for 60 minutes at 37°C with 125I-insulin in the presence of a 100-fold excess of unlabeled hormone. Unbound 125I-insulin was removed from the culture dishes by rinsing the cells three times with phosphate-buffered saline and the bound radioactivity measured by gamma-counter.35 Results represent the means and standard deviations of at least two independent experiments performed in triplicate.
Northern Blot Analysis
Northern blot was performed by standard methods. Briefly, the gel was blotted to nylon membrane (Amersham), and the film densitometrically scanned to quantify the relative proportion of InsR mRNA. β-Actin probes were used as reference standards. Images were analyzed as above.34
RT-PCR of InsR mRNA Isoforms
We performed PCR amplification according to Savkur and colleagues36; the experimental protocol allows semiquantitative evaluation of InsR isoforms A and B. β-Actin was used as reference standard; gels were densitometrically scanned and analyzed as above.
In Vivo Cell Imaging
FoxO1-GFP was constructed in pEGFPN1 (Clontech Laboratories, Palo Alto, CA). FoxO1 from FoxO1-pCMV29 was subcloned into this vector. Cells expressing FoxO1-GFP were transiently transfected by FuGene6 (Roche, Mannheim, Germany) using 2.5 μg/ml DNA. We plated and observed cells in LabTek chambers (Nalgene). We captured confocal microscope images on a LSM 510 META microscope (Zeiss, Jena, Germany) using 488-nm laser excitation for GFP and 568 nm for rhodamine. Images were captured with a 63 × 1.2 water objective and an open pinhole to collect fluorescence from the entire depth of the cell.
Animal Model
Male Sprague-Dawley rats weighing 180 to 200 g (Charles River, Calco, Italy) were maintained at the Preclinical Research Center of the Ospedale Policlinico, Milan, Italy, in compliance with the Principles of Laboratory Animal Care (National Institutes of Health publication no. 86-23, revised 1985). They were fed ad libitum and kept in a climate-controlled room with a 12-hour dark-light cycle. Rats were either iron depleted by daily injections of 200 mg/kg deferoxamine mesylate (Novartis)37 or submitted to injections of solvent (0.9% saline), for 2 weeks. The experimental protocol was approved by the local ethical committee. Basal weight and glucose levels (measured by glucose-oxidase assay) were in the reference range and not significantly different between treated and untreated animals (19 ± 66 versus 186 ± 6 g and 152 ± 31 versus 169 ± 34 mg/dl, respectively).
Animals were fasted overnight and an intraperitoneal glucose tolerance test (GTT, 2g/kg) was performed. Animals were sacrificed under anesthesia by exsanguination and samples of liver, calf muscle, and peritoneal adipose tissue harvested. Blood hematocrit and serum iron levels were measured by standard methods. Hepatic iron concentration was measured by atomic absorption spectrometry. Insulin was measured by Elisa (Linco Research, St. Charles, MS). Quantitative RT-PCR and Western blotting were performed as described above. Results were normalized for β-actin.
To test the effect of iron status on glucose metabolism in the presence of fatty liver, 18 rats were fed for 8 weeks with a high-calorie, high-fat diet (HFD), previously demonstrated to induce fatty liver,38 and 6 with normal diet. Iron depletion was induced in six HFD-fed rats as described above. Iron supplementation was provided to six HFD-fed rats by three weekly subcutaneous injections of ferric gluconate (20 mg/week).
Statistical Analysis
We performed descriptive statistics and analysis of variance using the JMP 6.0 software (SAS Institute Inc., Cary, NC). Results were expressed as means SD and compared by analysis of variance. P was considered significant when P < 0.05 (two-tailed).
Results
Effect of Iron Manipulation on Intracellular Iron Pool, Cell Viability, and Oxidative Stress
Dfo and FAC did not significantly affect cell viability at the concentrations used in this study (up to 120 μmol/L and 2500 μmol/L, respectively) (Figure 1A). Modulation of intracellular iron status by Dfo and FAC treatment was confirmed by measuring total IRP activity, which increases with decreasing intracellular free iron availability (Figure 1A). IRP activity increased in HepG2 cells treated with Dfo in a concentration-dependent manner, with a 62 ± 9% increase at 100 μmol/L (P < 0.05). Conversely, FAC addition decreased IRP activity, with a 43 ± 10% decrease at 150 μmol/L (P < 0.05). Glucose or insulin addition had no effect on IRP activity. Protein carbonylation levels were increased by FAC (150 μmol/L), but were not decreased by DFO (100 μmol/L) (Figure 1B).
Figure 1.
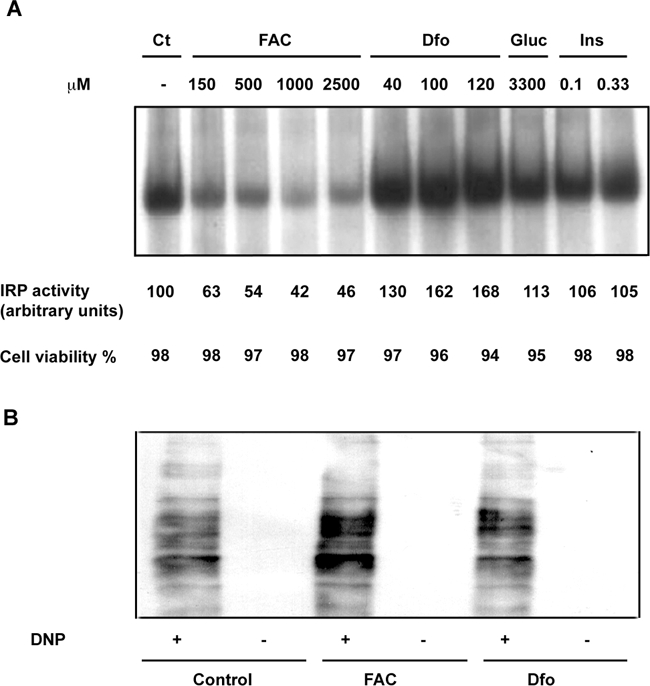
Effect of iron manipulation on IRP activity, cell viability, and oxidative stress. A: IRP activity assay. Cytoplasmic extract of HepG2 exposed to increasing concentrations of FAC, Dfo, glucose (33 mmol/L, Glu), and insulin (0.33 μmol/L, Ins), were incubated with an excess of a 32P-labeled iron-responsive element probe; RNA-protein complexes were separated on nondenaturing 6% polyacrylamide gels and revealed by autoradiography. The corresponding percent cell viability, evaluated by Trypan blue, is indicated at the bottom. B: Protein carbonylation by Oxyblot in cells treated with FAC, Dfo, and untreated. DNP+, derivatization to 2,4-dinitrophenylhydrazone; DNP−, negative control.
Iron Depletion Stabilizes HIF-1α and Increases Glut1 and InsR Expression
Treatment of HepG2 cells for 24 hours with either Dfo or the hypoxia mimicker CoCl2 (150 μmol/L) resulted in HIF-1α stabilization and increased InsR mRNA and protein levels. The effect of Dfo and CoCl2 appeared to be additive (Figure 2A). We then analyzed the effect of Dfo on InsR in Hepa-1 hepatocytes lacking Hif-1β/ARNT (C4), and in wild-type controls (C1C7). Dfo significantly increased InsR mRNA and protein levels in C1C7, but not in C4 Hepa-1 cells, suggesting that the presence of HIF-1β is required for the effect of Dfo on InsR expression (Figure 2B).
Figure 2.
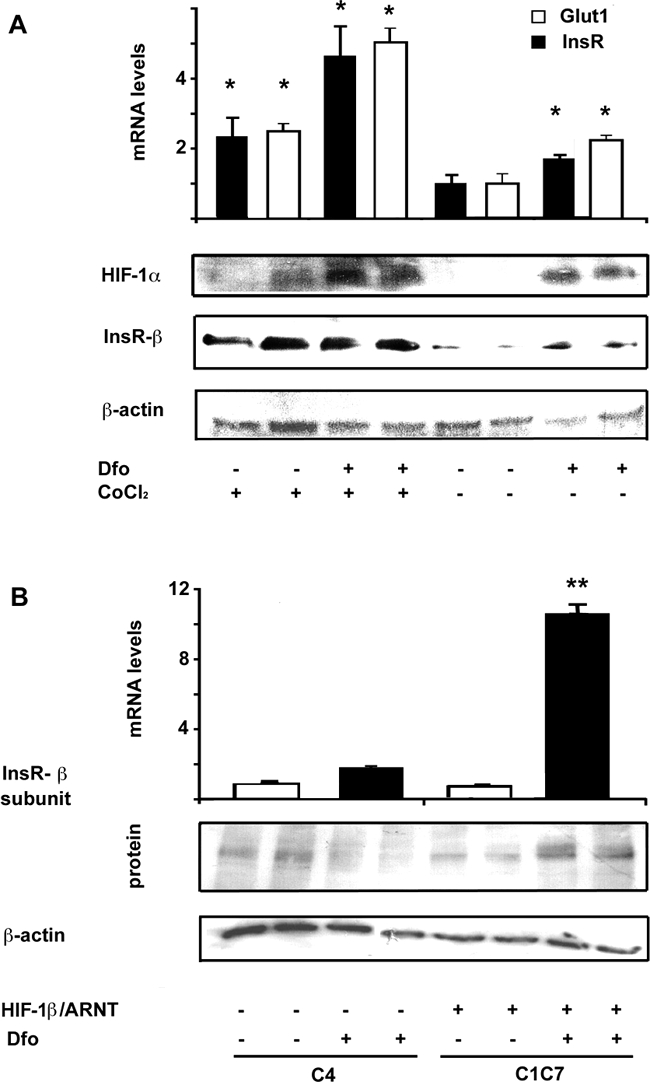
Effect of iron depletion and hypoxia on glucose uptake and InsR expression. A: Effect of incubation with CoCl2 (150 μmol/L) and Dfo (100 μmol/L) for 24 hours in HepG2 on InsR and Glut1 mRNA, evaluated by qRT-PCR, and on HIF-1α and InsR protein levels. *P < 0.05 versus untreated cells. B: Iron depletion (Dfo, 100 μmol/L, for 24 hours) increased InsR expression in wild-type (C1C7) but not in HIF-1β lacking (C4) Hepa-1 hepatocytes. Results are the mean and SD of two independent experiments. White bars, controls; black bars, Dfo-treated rats. *P < 0.05 for Dfo induced up-regulation of InsR versus wild-type C4 hepatocytes.
Time Course Analysis of HIF-1α, Glut1, and InsR Expression after Dfo and CoCl2 Treatment
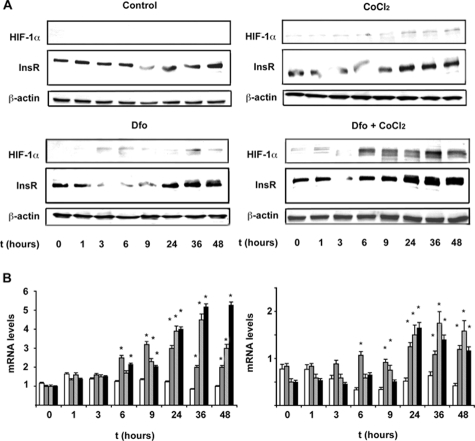
Next, we evaluated the time course of HIF-1α, Glut1, and InsR expression in cells cultured in the presence of Dfo (100 μmol/L), CoCl2 (150 μmol/L), and Dfo plus CoCl2 compared to control cells. We observed HIF-1α stabilization after 6 hours of treatment with Dfo and/or CoCl2 (Figure 3A), which was paralleled by increased Glut1 mRNA levels (Figure 3B), about fourfold after 24 hours of treatment. Up-regulation of InsR mRNA and protein levels appeared to be delayed compared to Glut1, starting 9 to 24 hours after treatment with Dfo and/or CoCl2 (Figure 3, A and B). Taken together, these data suggest that InsR induction may not be directly related to HIF-1α binding to InsR promoter.
Figure 3.
Effect of Dfo and CoCl2 on the time-course expression of InsR. A: Time-course expression of HIF-1α and InsR protein levels in HepG2 hepatocytes untreated, treated with Dfo (100 μmol/L), CoCl2 (150 μmol/L), or with Dfo (100 μmol/L) and CoCl2 (150 μmol/L). β-Actin is shown as a control. B: Time-course expression (normalized mRNA levels) of Glut1 (left panel) and InsR (right panel), as evaluated by qRT-PCR. White bars, untreated HepG2 cells; gray bars, cells treated with Dfo (100 μmol/L); dashed bars, cells treated with CoCl2 (150 μmol/L); black bars, cells treated with Dfo (100 μmol/L) and CoCl2 (150 μmol/L). *P < 0.05, **P < 0.005 for treated versus untreated cells.
Effect of Deferasirox on HIF-1α and InsR Expression
To confirm that the effect of Dfo on InsR expression was attributable to iron depletion, we compared HIF-1α and InsR protein levels in HepG2 cells treated with Dfo, deferasirox (ICL670, 25 μmol/L), or a combination thereof (Figure 4). Deferasirox and Dfo increased HIF-1α and InsR levels to a similar extent, whereas the effect of combination treatment was enhanced, suggesting that the effect of Dfo on InsR expression was dependent on iron chelation, and that it may be enhanced by chelators targeting a different iron pool.
Figure 4.
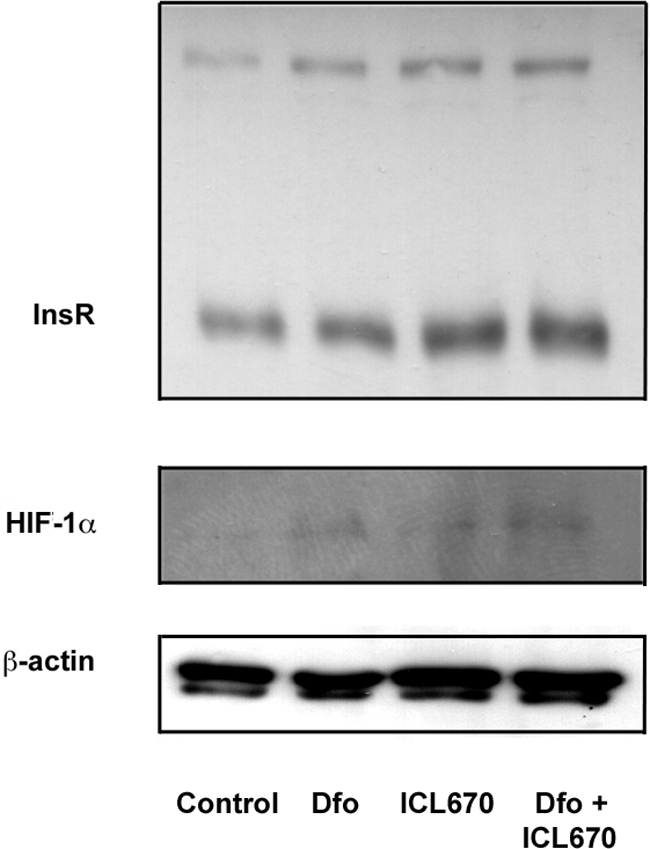
Effect of Dfo (100 μmol/L) and deferasirox (ICL670, 25 μmol/L) on HIF-1α and InsR expression in HepG2 hepatocytes. β-Actin is shown as a control.
Iron Availability Regulates InsR Expression and Activity in Hepatocytes
We next evaluated the effect of iron status on InsR expression and activity in HepG2 cells. We first analyzed the effect of iron status on InsR mRNA levels. Northern blot analysis (Figure 5A) showed five major bands of InsR mRNA (9.2, 8, 7, 5.7, and 4.2 kb, corresponding to untranslated precursors and mature mRNAs). Densitometric analysis showed a twofold increase of InsR mRNA levels in cells treated with Dfo compared to untreated cells, and decreased expression in cells treated with FAC and glucose compared to untreated cells (P < 0.05). We next determined by RT-PCR whether iron manipulation could differentially affect the two alternatively spliced InsR isoforms, the A isoform, lacking exon 11, and B isoform containing exon 11, which encode for proteins characterized by different affinity, activity, and tissue distribution. Semiquantitative assessment indicated that Dfo treatment increased mRNA levels of both isoforms, but the fold induction appeared greater for the B isoform, whereas FAC specifically decreased the B isoform (Figure 5B).
Figure 5.
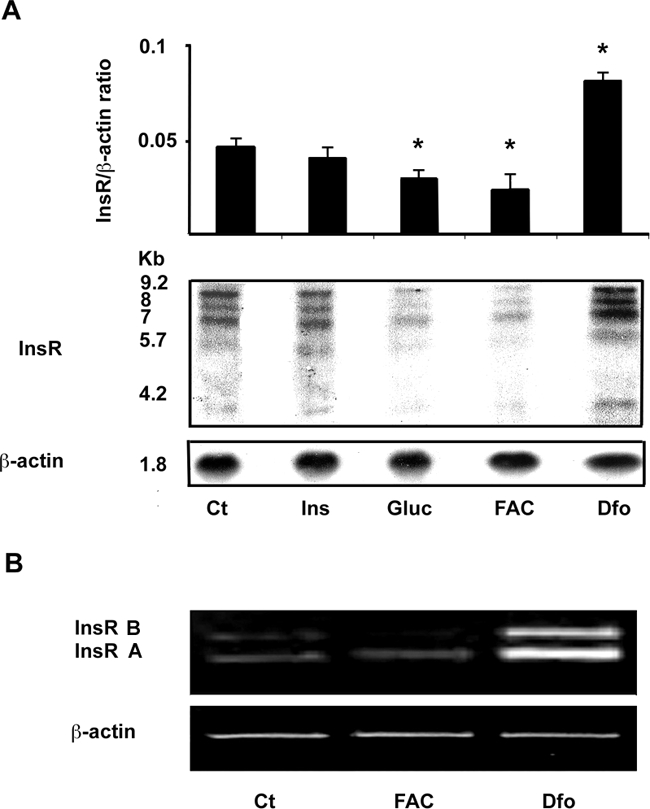
Effect of iron manipulation on InsR expression in HepG2 cells. A: Northern blot analysis of InsR mRNA. Cells were incubated with insulin (0.33 μmol/L, Ins), glucose (33 mmol/L, Gluc), FAC (150 μmol/L), and Dfo (100 μmol/L) for 24 hours. β-Actin probe is shown as reference standard. The relative quantification presented above is representative of two independent experiments. *P < 0.05 versus untreated cells. B: RT-PCR of InsR mRNA. Cells were treated with FAC and Dfo as above. The primers generated two fragments encoding the B and A isoform of InsR; β-actin cDNA was used as reference standard.
We then evaluated InsR activity by a 125I-insulin binding assay. Addition of increasing amounts of 125I-insulin to untreated cells showed a saturable specific insulin binding and uptake at 1.6 nmol/L (Figure 6A). As a negative control for the specificity of the assay, we also analyzed 125I-insulin binding to SV40 hepatocytes; competition curves were consistent with the absence of specific insulin binding to InsR−/− cells. Dfo increased by twofold InsR binding activity at the half-maximal concentration of 1.1 nmol/L, whereas iron addition as FAC or holo-transferrin reduced InsR activity by 30% (P < 0.005). The effect of Dfo was similar to that obtained by treating cells with 33 mmol/L glucose (Figure 6B; 44% reduction, P < 0.005), previously reported to down-regulate InsR.20
Figure 6.
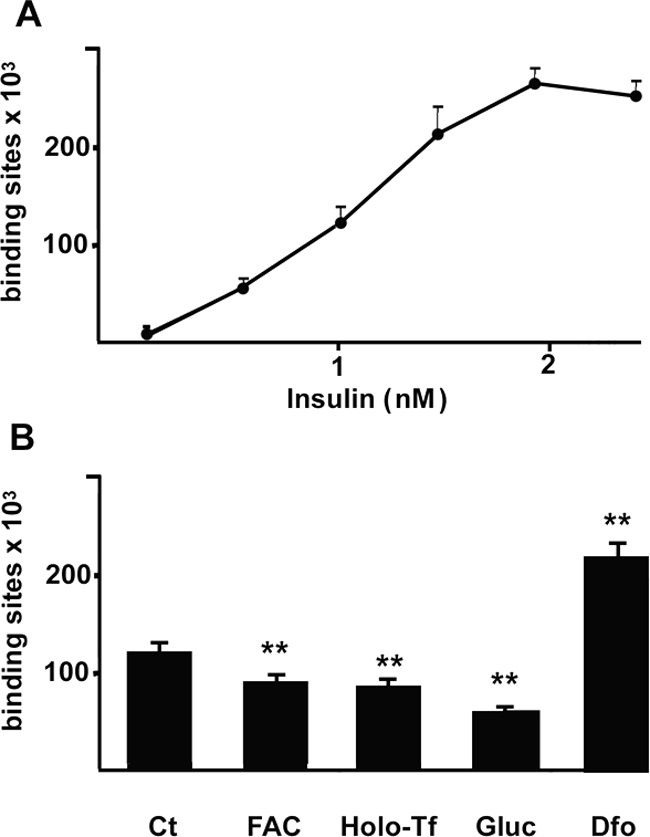
Iron availability regulates 125I-insulin-specific binding and uptake in HepG2. A: Addition of increasing amounts of 125I-insulin to untreated cells showed a saturable binding (bound radioactivity was evaluated by gamma-counter). B: Effect of iron status on InsR binding activity. Cells were incubated with Dfo (100 μmol/L), FAC (150 μmol/L), holo-transferrin (5 mg/ml), and glucose (33 mmol/L) for 24 hours. *P < 0.05, **P < 0.005 versus controls.
Iron Depletion Affects Insulin Signaling Pathways and Glucose Utilization
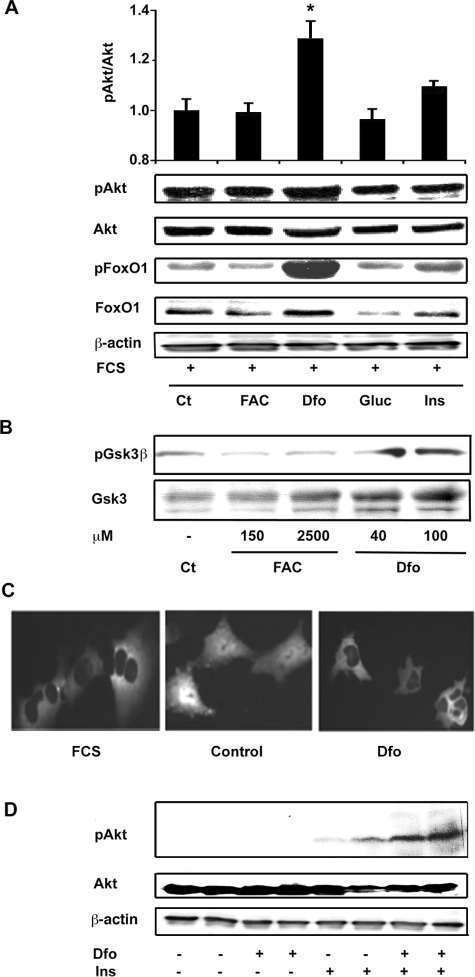
We then evaluated in HepG2 cells whether iron manipulation affects insulin-signaling cascade, focusing our attention on the Akt/PKB pathway. To simulate normal growth conditions, we first performed experiments in the presence of growth factors. In the presence of FCS, iron depletion obtained by Dfo treatment for 24 hours induced an increase in p-Akt/total Akt/PKB levels as compared to untreated cells (Figure 7A). We also observed a parallel Dfo-induced increase in the phosphorylation status of FoxO1 (Figure 7A) and of Gsk3β (Figure 6B), Akt/PKB targets that mediate the effect of insulin on gluconeogenesis and glycogen synthesis, respectively. To definitively exclude increased FoxO1 activity and gluconeogenesis, we looked at FoxO1-GFP intracellular localization in SV40 hepatocytes by in vivo cell imaging. Consistently with increased Akt/PKB activity, FoxO1-GFP was localized to the cytoplasm in Dfo-treated hepatocytes, as observed in the presence of growth factors (FCS), whereas it was nuclear in FCS-depleted cells (Figure 7C). In the absence of FCS, insulin treatment (0.33 μmol/L for 15 minutes) was more effective in inducing Akt/PKB activation in Dfo-treated HepG2 compared to control cells (Figure 7D). These data suggest that Dfo up-regulates Akt/PKB activity in HepG2 by enhancing insulin- and InsR-dependent Akt/PKB activity.
Figure 7.
Effect of iron manipulation on insulin signaling in HepG2. A: Effect of a 24-hour treatment with FAC (150 μmol/L), Dfo (100 μmol/L), glucose (33 mmol/L, Gluc), and insulin (0.33 μmol/L, Ins) in the presence of FCS on Akt expression and activity, and on FoxO1 phosphorylation status. B: Effect of different concentrations of FAC and Dfo on Gsk3β expression and activity in cells cultured in the presence of FCS. C: Effect of Dfo on FoxO1-GFP intracellular localization. Results are representative of three independent experiments. Control, cells cultured without FCS for 8 hours; Dfo, cells preincubated with Dfo (100 μmol/L) for 24 hours. D: Effect of Dfo preincubation (100 μmol/L for 24 hours) on insulin induced (0.33 μmol/L for 15 minutes) Akt activation in cells cultured in the absence of FCS.
To look at the metabolic outcome, we analyzed the effect of iron status on the expression of genes involved in glucose uptake and glycolysis. Dfo treatment induced Glut1 and glucokinase (Gk), the latter involved in glucose activation for metabolic utilization in hepatocytes (Figure 8A, P < 0.005), but not Glut2. Dfo also increased the expression of the glycolytic genes phosphofructokinase (Pfk) and glyceraldehyde-3-phosphate dehydrogenase (Gapd), whereas pyruvate kinase (Pk) mRNA levels were not affected (Figure 8B). Taken together, these results suggest that glucose uptake and utilization are increased in Dfo-treated hepatocytes.
Figure 8.
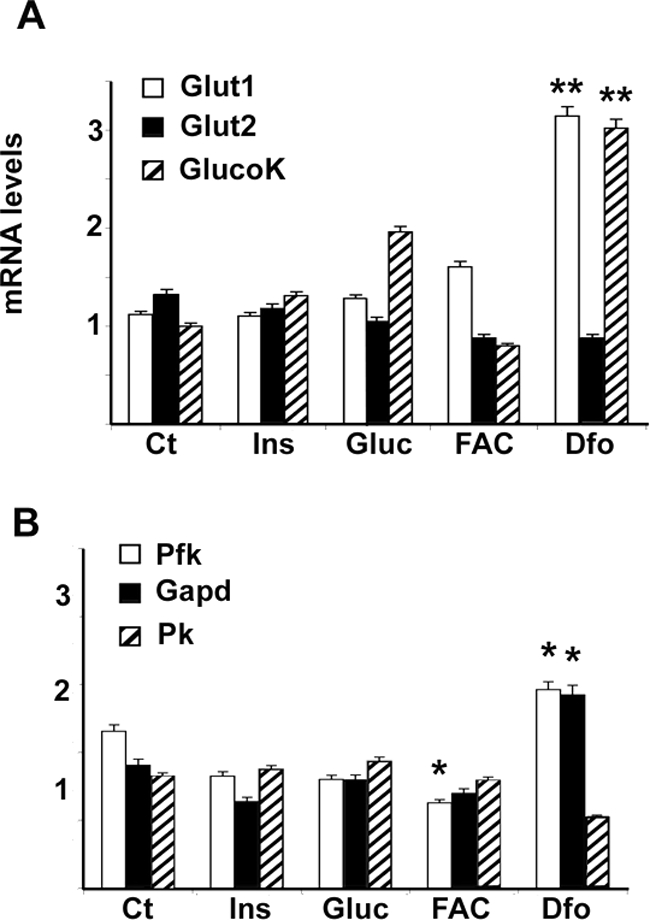
Effect of iron status on the expression of genes involved in glucose uptake and glycolysis in HepG2 cells, as evaluated by qRT-PCR. A and B: Cells were treated as described in the legend of Figure 4; mRNA levels adjusted for β-actin. Results are mean values of three independent experiments. GlucoK, glucokinase; Pfk, phosphofructokinase; Gapd, glyceraldehyde-3-phosphatedehydrogenase; Pk, pyruvate kinase. **P < 0.005.
Iron Depletion by Dfo Results in HIF-1α Stabilization and Increased Glucose Uptake, Hepatic InsR Expression, and Signaling in an in Vivo Model
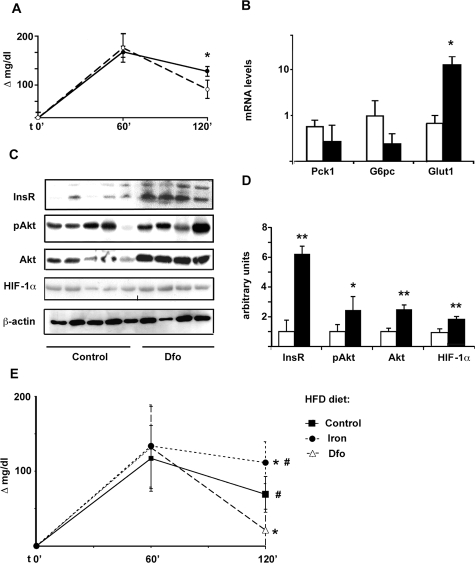
At the end of Dfo or control treatment, nonfasting glucose levels (198 ± 29 mg/dl versus 185 ± 25 mg/dl) and body weight (260 ± 14 g versus 243 ± 13 g) were not significantly different between control (n = 5) and Dfo-treated rats (n = 4). Dfo induced a significant decrease in serum iron (38 ± 13 μg/dl versus 83 ± 37 μg/dl, P = 0.03) and blood hematocrit (43 ± 8% versus 53 ± 2%, P = 0.03). It also reduced liver iron concentration (42 ± 25 versus 106 ± 88 μg/100 mg dry tissue; P = 0.1). Two hours after intraperitoneal GTT Dfo-treated rats had a lower increase in glucose values compared to baseline levels versus control rats (P = 0.007, Figure 9A), in the presence of lower serum insulin levels (1 ± 0.3 ng/ml versus 1.7 ± 1.3 ng/ml; P = ns). Gene expression analysis in liver samples showed up-regulation of Glut1 mRNA levels (up to 10-fold, P < 0.005; Figure 9B) in Dfo-treated rats, whereas levels of glycolytic genes, and of the rate limiting genes of gluconeogenesis glucose-6-phosphatase (G6pc) and phosphoenolpyruvate-carboxy-kinase (Pck1) were not significantly different between the two groups (Figure 9B). We did not observe significant differences in Glut1 mRNA levels in the muscle and adipose tissue between Dfo-treated and control rats (not shown).
Figure 9.
Effect of iron depletion by Dfo on glucose clearance, HIF-1α expression, and hepatic glucose metabolism in Sprague-Dawley rats. A: Variation in glucose levels compared to baseline values after 2 g/kg i.p. GTT in Dfo-treated and control rats. Filled circles, controls; open circles, Dfo-treated rats. *P < 0.05. B: Effect of iron depletion on mRNA levels of genes involved in glucose uptake (Glut1) and production (Pck1, G6pc). Results were normalized for β-actin. White bars: control rats; black bars, Dfo-treated rats. C: Hepatic expression of InsR, pAkt and total Akt, and HIF-1α protein levels, in Dfo-treated (n = 4) and control (n = 5) rats, as evaluated by Western blotting. D: Corresponding protein expression levels, normalized for β-actin, in Dfo-treated (black bars) versus control rats (white bars, reference). *P < 0.05, **P < 0.005. E: Effect of iron status on glucose clearance in Sprague-Dawley rats on HFD diet. Variation in glucose levels compared to baseline values after 2 g/kg i.p. GTT are shown. *P < 0.05 versus control; #P < 0.05 versus Dfo-treated rats.
Dfo treatment significantly increased hepatic HIF-1α protein levels (P < 0.005; Figure 9, C and D). InsR protein levels, as well as Akt/PKB and activated Akt/PKB, were significantly higher in the liver of Dfo-treated rats (Figure 9, C and D). These data indicate that iron depletion by Dfo was associated with increased glucose clearance, characterized by up-regulated InsR expression, insulin signaling, and glucose uptake by the liver.
Effect of Iron Status in a Rat Model of Fatty Liver
At the end of treatment HFD fed rats had significantly higher basal glucose levels compared to littermates (105 ± 18 versus 73.8 ± 38, P < 0.05). Basal glucose levels were not significantly different among controls, iron-depleted, and iron-supplemented rats. After intraperitoneal GTT, after 2 hours Dfo-treated rats had a lower increase, whereas iron supplemented rats had a higher increase, in glucose values compared to baseline levels versus controls (Figure 9E, P < 0.05).
Discussion
In this study, we investigated the effect of iron depletion by Dfo on glucose metabolism in hepatocytes using established cell lines characterized by physiological regulation of insulin signaling,20 and an in vivo model. Results indicate that treatment with Dfo induced cellular iron depletion comparable to that observed in humans,33 and increased glucose uptake, InsR expression, and insulin signaling. Our data suggest also that HIF-1α up-regulation plays a role in this process.
We hypothesized that iron depletion influences glucose metabolism by stabilizing HIF-1α, regulated at posttranscriptional level by iron status and oxygen tension. Both hypoxia and iron depletion by Dfo stabilized HIF-1α and stimulated InsR to a similar extent to Glut1, a known HIF-1α target.28 Up-regulation of InsR was also achieved by treating cells with the intracellular iron chelator deferasirox. Oxidative stress did not appear to be involved in InsR regulation by iron because Dfo did not reduce oxidative stress, as detected by Oxyblot,12 in our model. InsR increase induced by Dfo was hampered in cells lacking the HIF-1α obligate co-factor HIF-1β/ARNT, indicating that HIFs up-regulation is involved in the modulation of InsR expression by iron depletion. In the attempt to clarify the mechanism whereby, we studied the time course of Glut1 and InsR expression after HIF-1α activation. Results confirm that Glut1 up-regulation closely follows and is probably directly related to HIF-1α stabilization,28 whereas InsR induction appears to be a secondary phenomenon. It could be hypothesized that increased glucose uptake leads to an activation of glucose sensitive elements, including HIF-1β/ARNT consensus sequences, present in the InsR promoter, as also demonstrated for other genes involved in glucose metabolism.39,40
Modulation of InsR mRNA levels by Dfo resulted in increased binding and internalization activity, whereas iron addition, either transferrin-bound or nontransferrin-bound, reduced InsR activity to a similar extent to high-glucose concentrations, known to induce oxidative stress and InsR down-regulation.22,41 Semiquantitative assessment suggested that iron status influenced the levels of both InsR isoforms, but in particular of the B isoform, predominantly expressed in the liver and associated with increased signaling activity.36
To determine whether the InsR increase enhanced insulin signaling, we next investigated the activation status of the Akt/PKB pathway, involved in the transduction of insulin signaling. Iron depletion induced an increase in p-Akt/Akt/PKB ratio, and of p-FoxO1 and p-Gsk3β levels, which mediate the effect of insulin on the inhibition of gluconeogenesis and the activation of glycogen synthesis, respectively. These data suggest that iron depletion may decrease hepatic glucose production and glycogen breakdown. Interestingly, it has been demonstrated that Akt/PKB activation is also involved in the insulin-mediated inhibition of apoptosis in hepatocytes through FoxO1 phosphorylation, suggesting that improved insulin sensitivity during iron depletion may decrease susceptibility to liver damage in patients with metabolic syndrome and NAFLD.42 Increased phosphorylation of Gsk3β induced by iron depletion may also contribute to stabilize HIF-1α in our model, as previously demonstrated in HepG2.43
The expression of genes involved in glucose uptake and glycolysis was quantified to define the metabolic outcome. Dfo up-regulated Glut1, which mediates constitutive glucose uptake, and has recently been reported to be the most abundant glucose transporter in human tissues.27 In addition, Dfo induced Gk, the prevalent hexokinase in hepatocytes, and the rate limiting glycolytic genes Gapd and Pfk. Based on these data, it could be speculated that iron overload determines the suppression of the low basal HIF-1α activity in hepatocytes, determining InsR down-regulation and reduced insulin clearance and insulin signaling. The greater effect of Dfo compared to FAC on insulin signaling and gene expression is possibly related to the culturing conditions of cells: control cells cultured by standard methods were exposed to moderate iron concentration and high oxygen tension and, in fact, HIF-1α levels were lower than that observed in vivo in rats. Thus, although in vitro FAC increased oxidative stress, it could affect HIF-1α levels less than Dfo. These results may contribute to explaining the pathogenesis of the so-called hepatic iron overload-insulin resistance syndrome,44 a common cause of patients referral to specialized clinical centers.
To confirm these findings in vivo, we determined the effect of iron depletion on HIF-1α stabilization, InsR expression and signaling, and glucose uptake in Sprague-Dawley male rats. Dfo treatment resulted in iron depletion and increased hepatic expression of HIF-1α. We showed for the first time in vivo, in nonneoplastic cells,45 that iron depletion by Dfo determined a 10-fold increase in Glut1 mRNA levels. In addition, we observed increased InsR protein levels and Akt/PKB pathway activity, the latter partially explained by up-regulation of total Akt/PKB levels in Dfo-treated rats. These data are in agreement with recent findings in pancreatic β-cells, supporting a regulation mechanism of InsR, Akt/PKB, and glucose uptake by HIFs.27 Although mRNA levels of the rate-limiting gluconeogenic enzymes G6pc and Pck1 were not significantly affected, there was a trend for lower Pck1 expression in Dfo-treated rats. As a result, we observed a lower increase of glucose levels after intraperitoneal GTT in Dfo-treated rats in the presence of lower insulin levels, suggesting increased glucose clearance during iron depletion. Importantly, iron depletion ameliorated glucose clearance in a model of fatty liver characterized by increased basal glucose levels, whereas iron supplementation had the opposite effect, suggesting that iron status may affect the progression to hyperglycemia in the presence of hepatic insulin resistance.
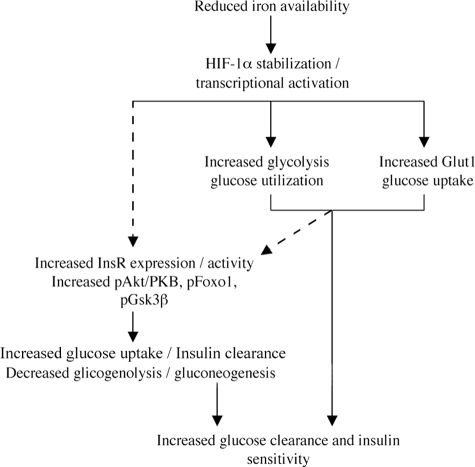
In conclusion, the present findings indicate that iron depletion by Dfo affects glucose metabolism inducing glucose uptake and utilization and increasing InsR binding activity and signaling, and that the mechanism is associated with HIF-1α stabilization and requires the presence of HIF-1β/ARNT. A working model summarizing our results is shown in Figure 10. These results may contribute to explain the positive effect of iron depletion on insulin sensitivity in patients with NAFLD and diabetes,14,46,47 and are consistent with clinical findings indicating that the benefit is not restricted to patients with iron overload.16 Because HIF-1α activity can be pharmacologically modulated, additional studies are required to better characterize the role of this transcription factor in the regulation of glucose metabolism and in the pathogenesis of diabetes.27
Figure 10.
Working model showing the mechanisms whereby iron depletion improves hepatic insulin resistance, according to the results of this study and previous findings. Arrows, direct effects; dashed arrows, possibly indirect effects.
Acknowledgments
We thank Prof. Domenico Accili (Department of Medicine, Columbia University, New York, NY) for providing wild-type and InsR−/− SV40 hepatocytes and the FoxO1-GFP construct; Lorenza Tacchini for providing the C4 and C1C7 hepatocytes; Daniela Intini (Department of Hematology, Policlinic Hospital, Milan, Italy), Francesca Bernuzzi, Alessandra Alberghini (Department of Pathology, University of Milan, Milan, Italy), Valeria De Barba, and Fabio Ambrosetti (Department of Surgery, Preclinical Research Center, University of Milan, Milan, Italy) for technical support; and Novartis (Basel, Switzerland) for providing deferasirox.
Footnotes
Address reprint requests to Prof. Silvia Fargion, Department of Internal Medicine, UO Medicina Interna IB, University of Milano Fondazione Policlinico Mangiagalli e Regina Elena IRCCS, Via F Sforza 35, 20122 Milano, Italy. E-mail: silvia.fargion@unimi.it.
Supported by COFIN 2004, FIRST 2004, FIRST 2005, and Ricerca Corrente Ospedale Maggiore Policlinico Mangiagalli Regina Elena Istituto Ricovero e Cura a Carattere Scientifico 2004, 2005, 2006.
P.D. and L.V. contributed equally to this study.
References
- Fargion S, Mattioli M, Fracanzani AL, Sampietro M, Tavazzi D, Fociani P, Taioli E, Valenti L, Fiorelli G. Hyperferritinemia, iron overload, and multiple metabolic alterations identify patients at risk for nonalcoholic steatohepatitis. Am J Gastroenterol. 2001;96:2448–2455. doi: 10.1111/j.1572-0241.2001.04052.x. [DOI] [PubMed] [Google Scholar]
- Fernández-Real JM, Ricart-Engel W, Arroyo E, Balanca R, Casamitjana-Abella R, Cabrero D, Fernandez-Castaner M, Soler J. Serum ferritin as a component of the insulin resistance syndrome. Diabetes Care. 1998;21:62–68. doi: 10.2337/diacare.21.1.62. [DOI] [PubMed] [Google Scholar]
- Bozzini C, Girelli D, Olivieri O, Martinelli N, Bassi A, De Matteis G, Tenuti I, Lotto V, Friso S, Pizzolo F, Corrocher R. Prevalence of body iron excess in the metabolic syndrome. Diabetes Care. 2005;28:2061–2063. doi: 10.2337/diacare.28.8.2061. [DOI] [PubMed] [Google Scholar]
- Wrede CE, Buettner R, Bollheimer LC, Scholmerich J, Palitzsch KD, Hellerbrand C. Association between serum ferritin and the insulin resistance syndrome in a representative population. Eur J Endocrinol. 2006;154:333–340. doi: 10.1530/eje.1.02083. [DOI] [PubMed] [Google Scholar]
- Valenti L, Dongiovanni P, Fracanzani AL, Santorelli G, Fatta E, Bertelli C, Taioli E, Fiorelli G, Fargion S. Increased susceptibility to nonalcoholic fatty liver disease in heterozygotes for the mutation responsible for hereditary hemochromatosis. Dig Liver Dis. 2003;35:172–178. doi: 10.1016/s1590-8658(03)00025-2. [DOI] [PubMed] [Google Scholar]
- Bellentani S, Saccoccio G, Masutti F, Croce LS, Brandi G, Sasso F, Cristanini G, Tiribelli C. Prevalence of and risk factors for hepatic steatosis in Northern Italy. Ann Intern Med. 2000;132:112–117. doi: 10.7326/0003-4819-132-2-200001180-00004. [DOI] [PubMed] [Google Scholar]
- Marchesini G, Brizi M, Bianchi G, Tomassetti S, Bugianesi E, Lenzi M, McCullough AJ, Natale S, Forlani G, Melchionda N. Nonalcoholic fatty liver disease: a feature of the metabolic syndrome. Diabetes. 2001;50:1844–1850. doi: 10.2337/diabetes.50.8.1844. [DOI] [PubMed] [Google Scholar]
- Marchesini G, Brizi M, Morselli-Labate AM, Bianchi G, Bugianesi E, McCullough AJ, Forlani G, Melchionda N. Association of nonalcoholic fatty liver disease with insulin resistance. Am J Med. 1999;107:450–455. doi: 10.1016/s0002-9343(99)00271-5. [DOI] [PubMed] [Google Scholar]
- Valenti L, Dongiovanni P, Piperno A, Fracanzani AL, Maggioni M, Rametta R, Loria P, Casiraghi MA, Suigo E, Ceriani R, Remondini E, Trombini P, Fargion S. alpha1-antitrypsin mutations in NAFLD: high prevalence and association with altered iron metabolism but not with liver damage. Hepatology. 2006;44:857–864. doi: 10.1002/hep.21329. [DOI] [PubMed] [Google Scholar]
- Fernández-Real JM, Lopez-Bermejo A, Ricart W. Cross-talk between iron metabolism and diabetes. Diabetes. 2002;51:2348–2354. doi: 10.2337/diabetes.51.8.2348. [DOI] [PubMed] [Google Scholar]
- Niederau C, Berger M, Stremmel W, Starke A, Strohmeyer G, Ebert R, Siegel E, Creutzfeldt W. Hyperinsulinaemia in non-cirrhotic haemochromatosis: impaired hepatic insulin degradation? Diabetologia. 1984;26:441–444. doi: 10.1007/BF00262217. [DOI] [PubMed] [Google Scholar]
- Houstis N, Rosen ED, Lander ES. Reactive oxygen species have a causal role in multiple forms of insulin resistance. Nature. 2006;440:944–948. doi: 10.1038/nature04634. [DOI] [PubMed] [Google Scholar]
- Facchini FS, Hua NW, Stoohs RA. Effect of iron depletion in carbohydrate-intolerant patients with clinical evidence of nonalcoholic fatty liver disease. Gastroenterology. 2002;122:931–939. doi: 10.1053/gast.2002.32403. [DOI] [PubMed] [Google Scholar]
- Facchini FS, Saylor KL. Effect of iron depletion on cardiovascular risk factors: studies in carbohydrate-intolerant patients. Ann NY Acad Sci. 2002;967:342–351. doi: 10.1111/j.1749-6632.2002.tb04290.x. [DOI] [PubMed] [Google Scholar]
- Valenti L, Fracanzani AL, Dongiovanni P, Bugianesi E, Marchesini G, Manzini P, Vanni E, Fargion S. Iron depletion by phlebotomy improves insulin resistance in patients with nonalcoholic fatty liver disease and hyperferritinemia: evidence from a case-control study. Am J Gastroenterol. 2007;102:1251–1258. doi: 10.1111/j.1572-0241.2007.01192.x. [DOI] [PubMed] [Google Scholar]
- Facchini FS. Effect of phlebotomy on plasma glucose and insulin concentrations. Diabetes Care. 1998;21:2190. [PubMed] [Google Scholar]
- Accili D. Lilly lecture 2003: the struggle for mastery in insulin action: from triumvirate to republic. Diabetes. 2004;53:1633–1642. doi: 10.2337/diabetes.53.7.1633. [DOI] [PubMed] [Google Scholar]
- Czech MP. The nature and regulation of the insulin receptor: structure and function. Annu Rev Physiol. 1985;47:357–381. doi: 10.1146/annurev.ph.47.030185.002041. [DOI] [PubMed] [Google Scholar]
- Kido Y, Burks DJ, Withers D, Bruning JC, Kahn CR, White MF, Accili D. Tissue-specific insulin resistance in mice with mutations in the insulin receptor. IRS-1, and IRS-2. J Clin Invest. 2000;105:199–205. doi: 10.1172/JCI7917. [DOI] [PMC free article] [PubMed] [Google Scholar]
- Hatada EN, McClain DA, Potter E, Ullrich A, Olefsky JM. Effects of growth and insulin treatment on the levels of insulin receptors and their mRNA in Hep G2 cells. J Biol Chem. 1989;264:6741–6747. [PubMed] [Google Scholar]
- Briata P, Gherzi R, Adezati L, Cordera R. Effect of two different glucose concentrations on insulin receptor mRNA levels in human hepatoma HepG2 cells. Biochem Biophys Res Commun. 1989;160:1415–1420. doi: 10.1016/s0006-291x(89)80162-7. [DOI] [PubMed] [Google Scholar]
- Nakajima K, Yamauchi K, Shigematsu S, Ikeo S, Komatsu M, Aizawa T, Hashizume K. Selective attenuation of metabolic branch of insulin receptor down-signaling by high glucose in a hepatoma cell line. HepG2 cells. J Biol Chem. 2000;275:20880–20886. doi: 10.1074/jbc.M905410199. [DOI] [PubMed] [Google Scholar]
- Edgerton DS, Lautz M, Scott M, Everett CA, Stettler KM, Neal DW, Chu CA, Cherrington AD. Insulin’s direct effects on the liver dominate the control of hepatic glucose production. J Clin Invest. 2006;116:521–527. doi: 10.1172/JCI27073. [DOI] [PMC free article] [PubMed] [Google Scholar]
- Kitamura T, Kahn CR, Accili D. Insulin receptor knockout mice. Annu Rev Physiol. 2003;65:313–332. doi: 10.1146/annurev.physiol.65.092101.142540. [DOI] [PubMed] [Google Scholar]
- Rother KI, Imai Y, Caruso M, Beguinot F, Formisano P, Accili D. Evidence that IRS-2 phosphorylation is required for insulin action in hepatocytes. J Biol Chem. 1998;273:17491–17497. doi: 10.1074/jbc.273.28.17491. [DOI] [PubMed] [Google Scholar]
- Michael MD, Kulkarni RN, Postic C, Previs SF, Shulman GI, Magnuson MA, Kahn CR. Loss of insulin signaling in hepatocytes leads to severe insulin resistance and progressive hepatic dysfunction. Mol Cell. 2000;6:87–97. [PubMed] [Google Scholar]
- Gunton JE, Kulkarni RN, Yim S, Okada T, Hawthorne WJ, Tseng YH, Roberson RS, Ricordi C, O'Connell PJ, Gonzalez FJ, Kahn CR. Loss of ARNT/HIF1beta mediates altered gene expression and pancreatic-islet dysfunction in human type 2 diabetes. Cell. 2005;122:337–349. doi: 10.1016/j.cell.2005.05.027. [DOI] [PubMed] [Google Scholar]
- Malhotra R, Tyson DG, Sone H, Aoki K, Kumagai AK, Brosius FC., III Glucose uptake and adenoviral mediated GLUT1 infection decrease hypoxia-induced HIF-1alpha levels in cardiac myocytes. J Mol Cell Cardiol. 2002;34:1063–1073. doi: 10.1006/jmcc.2002.2047. [DOI] [PubMed] [Google Scholar]
- Semenza GL, Roth PH, Fang HM, Wang GL. Transcriptional regulation of genes encoding glycolytic enzymes by hypoxia-inducible factor 1. J Biol Chem. 1994;269:23757–23763. [PubMed] [Google Scholar]
- Chen C, Pore N, Behrooz A, Ismail-Beigi F, Maity A. Regulation of glut1 mRNA by hypoxia-inducible factor-1. Interaction between H-ras and hypoxia. J Biol Chem. 2001;276:9519–9525. doi: 10.1074/jbc.M010144200. [DOI] [PubMed] [Google Scholar]
- Wood SM, Gleadle JM, Pugh CW, Hankinson O, Ratcliffe PJ. The role of the aryl hydrocarbon receptor nuclear translocator (ARNT) in hypoxic induction of gene expression. Studies in ARNT-deficient cells. J Biol Chem. 1996;271:15117–15123. doi: 10.1074/jbc.271.25.15117. [DOI] [PubMed] [Google Scholar]
- Park BC, Kido Y, Accili D. Differential signaling of insulin and IGF-1 receptors to glycogen synthesis in murine hepatocytes. Biochemistry. 1999;38:7517–7523. doi: 10.1021/bi9830718. [DOI] [PubMed] [Google Scholar]
- Cairo G, Tacchini L, Pogliaghi G, Anzon E, Tomasi A, Bernelli-Zazzera A. Induction of ferritin synthesis by oxidative stress. Transcriptional and post-transcriptional regulation by expansion of the “free” iron pool. J Biol Chem. 1995;270:700–703. doi: 10.1074/jbc.270.2.700. [DOI] [PubMed] [Google Scholar]
- Altomonte J, Richter A, Harbaran S, Suriawinata J, Nakae J, Thung SN, Meseck M, Accili D, Dong H. Inhibition of Foxo1 function is associated with improved fasting glycemia in diabetic mice. Am J Physiol. 2003;285:E718–E728. doi: 10.1152/ajpendo.00156.2003. [DOI] [PubMed] [Google Scholar]
- Fargion S, Fracanzani AL, Brando B, Arosio P, Levi S, Fiorelli G. Specific binding sites for H-ferritin on human lymphocytes: modulation during cellular proliferation and potential implication in cell growth control. Blood. 1991;78:1056–1061. [PubMed] [Google Scholar]
- Savkur RS, Philips AV, Cooper TA. Aberrant regulation of insulin receptor alternative splicing is associated with insulin resistance in myotonic dystrophy. Nat Genet. 2001;29:40–47. doi: 10.1038/ng704. [DOI] [PubMed] [Google Scholar]
- Sakaida I, Okita K. The role of oxidative stress in NASH and fatty liver model. Hepatol Res. 2005;33:128–131. doi: 10.1016/j.hepres.2005.09.019. [DOI] [PubMed] [Google Scholar]
- Svegliati-Baroni G, Candelaresi C, Saccomanno S, Ferretti G, Bachetti T, Marzioni M, De Minicis S, Nobili L, Salzano R, Omenetti A, Pacetti D, Sigmund S, Benedetti A, Casini A. A model of insulin resistance and nonalcoholic steatohepatitis in rats: role of peroxisome proliferator-activated receptor-alpha and n-3 polyunsaturated fatty acid treatment on liver injury. Am J Pathol. 2006;169:846–860. doi: 10.2353/ajpath.2006.050953. [DOI] [PMC free article] [PubMed] [Google Scholar]
- Carrière V, Le Gall M, Gouyon-Saumande F, Schmoll D, Brot-Laroche E, Chauffeton V, Chambaz J, Rousset M. Intestinal glucose-dependent expression of glucose-6-phosphatase: involvement of the aryl receptor nuclear translocator transcription factor. J Biol Chem. 2005;280:20094–20101. doi: 10.1074/jbc.M502192200. [DOI] [PubMed] [Google Scholar]
- Kietzmann T, Krones-Herzig A, Jungermann K. Signaling cross-talk between hypoxia and glucose via hypoxia-inducible factor 1 and glucose response elements. Biochem Pharmacol. 2002;64:903–911. doi: 10.1016/s0006-2952(02)01160-7. [DOI] [PubMed] [Google Scholar]
- Brownlee M. Biochemistry and molecular cell biology of diabetic complications. Nature. 2001;414:813–820. doi: 10.1038/414813a. [DOI] [PubMed] [Google Scholar]
- Valverde AM, Fabregat I, Burks DJ, White MF, Benito M. IRS-2 mediates the antiapoptotic effect of insulin in neonatal hepatocytes. Hepatology. 2004;40:1285–1294. doi: 10.1002/hep.20485. [DOI] [PubMed] [Google Scholar]
- Mottet D, Dumont V, Deccache Y, Demazy C, Ninane N, Raes M, Michiels C. Regulation of hypoxia-inducible factor-1alpha protein level during hypoxic conditions by the phosphatidylinositol 3-kinase/Akt/glycogen synthase kinase 3beta pathway in HepG2 cells. J Biol Chem. 2003;278:31277–31285. doi: 10.1074/jbc.M300763200. [DOI] [PubMed] [Google Scholar]
- Mendler MH, Turlin B, Moirand R, Jouanolle AM, Sapey T, Guyader D, Le Gall JY, Brissot P, David V, Deugnier Y. Insulin resistance-associated hepatic iron overload. Gastroenterology. 1999;117:1155–1163. doi: 10.1016/s0016-5085(99)70401-4. [DOI] [PubMed] [Google Scholar]
- Barthel A, Okino ST, Liao J, Nakatani K, Li J, Whitlock JP, Jr, Roth RA. Regulation of GLUT1 gene transcription by the serine/threonine kinase Akt1. J Biol Chem. 1999;274:20281–20286. doi: 10.1074/jbc.274.29.20281. [DOI] [PubMed] [Google Scholar]
- Fernández-Real JM, Penarroja G, Castro A, Garcia-Bragado F, Hernandez-Aguado I, Ricart W. Blood letting in high-ferritin type 2 diabetes: effects on insulin sensitivity and beta-cell function. Diabetes. 2002;51:1000–1004. doi: 10.2337/diabetes.51.4.1000. [DOI] [PubMed] [Google Scholar]
- Valenti L, Fracanzani AL, Fargion S. Effect of iron depletion in patients with nonalcoholic fatty liver disease without carbohydrate intolerance. Gastroenterology. 2003;124:866–867. doi: 10.1053/gast.2003.50130. [DOI] [PubMed] [Google Scholar]


