Abstract
While the glycoprotein (G) of rabies virus (RV) is known to play a predominant role in the pathogenesis of rabies, the function of the RV matrix protein (M) in RV pathogenicity is not completely clear. To further investigate the roles of these proteins in viral pathogenicity, we constructed chimeric recombinant viruses by exchanging the G and M genes of the attenuated SN strain with those of the highly pathogenic SB strain. Infection of mice with these chimeric viruses revealed a significant increase in the pathogenicity of the SN strain bearing the RV G from the pathogenic SB strain. Moreover, the pathogenicity was further increased when both G and M from SB were introduced into SN. Interestingly, the replacement of the G or M gene or both in SN by the corresponding genes of SB was associated with a significant decrease in the rate of viral replication and viral RNA synthesis. In addition, a chimeric SN virus bearing both the M and G genes from SB exhibited more efficient cell-to-cell spread than a chimeric SN virus in which only the G gene was replaced. Together, these data indicate that both G and M play an important role in RV pathogenesis by regulating virus replication and facilitating cell-to-cell spread.
Rabies virus (RV), the etiological agent of one of the oldest recognized infectious diseases, almost always causes a fatal encephalomyelitis in several species of mammals, including humans (4). RV, the prototype of the Lyssavirus genus of the family Rhabdoviridae, is an enveloped, nonsegmented, negative-stranded RNA virus. RV has a simple genome of about 12 kb encoding five proteins: the nucleoprotein (N), the phosphoprotein (P), the matrix protein (M), the glycoprotein (G), and the RNA-dependent RNA polymerase (L). The viral RNA, which is always encapsidated by N, forms the ribonucleoprotein (RNP), which is the template for viral replication and transcription (2). The RNP together with P and L forms the viral replication complex, which is surrounded by the host cell-derived membrane that also contains G. M has been proposed to bridge the RNP and the cytoplasmic domain (CD) of RV G to form the bullet-shaped virion (22).
The RV G, which is organized as a trimer, is the sole protein exposed on the surface of the virion. RV G interacts with cellular receptors (14, 17, 32, 33), mediates pH-dependent fusion, and promotes viral entry from a peripheral site into the nervous system (19). Moreover, RV G is involved in the transsynaptic spread within the central nervous system (3, 7, 16). Although RV pathogenicity is a multigenic trait (10), RV G is the major contributor to the pathogenicity of a particular RV (5, 6, 10, 15, 21, 23, 29, 30, 34). The efficient interaction of RV G with putative host cellular receptors can promote effective virus uptake, resulting in increased virulence. Pathogenic RVs reportedly use different receptors and routes of entry than nonpathogenic derivatives (3, 16). Differences in the distributions of various RV strains in the brain are determined at least in part by the RV G (35), and the RV G's of pathogenic strains have been shown to accelerate virus internalization (5, 10).
In addition to its role in the virus-receptor interaction, G can trigger apoptosis, as observed with nonpathogenic RV strains in which G expression leads to the attenuation of the virus, probably through the induction of the immune response and the premature death of the host cells (9, 25). Pathogenic RV strains express lower levels of G than nonpathogenic strains and induce less or no apoptosis (24, 36).
Nevertheless, the pathogenicity of RV is not determined exclusively by G, as indicated by the incomplete recovery of the pathogenic phenotype when the G of a nonpathogenic RV is exchanged with that of a pathogenic RV (10, 23, 31).
The virus replication rate is another important factor in RV pathogenesis. In general, pathogenic RV strains replicate at a lower rate than attenuated RV strains (for a review, see reference 28). The RV M plays a regulatory role in viral transcription and replication (11, 12), and with the deletion of the M gene resulting in a 500,000-fold reduction in viral production (21), M is also important for viral budding. Our previous studies have implicated RV M in the pathogenicity of the highly pathogenic SB strain of RV (10), although direct evidence for the role of RV M in pathogenesis has been lacking.
To further investigate the role of G and M in viral pathogenicity, we constructed chimeric recombinant viruses by exchanging the G and M genes of the attenuated SN strain with those of the highly pathogenic SB strain. We showed that the pathogenicity of the SN parental strain was significantly increased after the introduction of the RV G from the pathogenic SB strain. Moreover, the pathogenicity was further increased when both G and M from SB were introduced into SN, and this step was associated with a decrease in the rate of viral RNA synthesis. In addition, the exchange of the M and G genes in SN for the corresponding genes from SB led to more efficient cell-to-cell spread, probably through the combined action of G and M.
MATERIALS AND METHODS
Cells and viruses.
BSR cells, a derivative of BHK-21 cells (26); BSR-T7 cells, which constitutively express T7 RNA polymerase (1); and Vero cells were grown in Dulbecco modified essential medium (MEDIATECH, Inc., Herndon, VA) supplemented with 10% fetal bovine serum. BSR-T7 cells were maintained by adding 1 mg of G418 (MEDIATECH)/ml at every third passage as described previously (1). Mouse neuroblastoma NA cells were grown in RPMI 1640 medium (MEDIATECH) supplemented with 10% fetal bovine serum.
The SN strain of RV was derived from the SAD B19 cDNA clone (20, 23). The SB strain was rescued from a cDNA clone derived from the silver-haired-bat-associated RV strain SHBRV-18 (10). Virus stocks in BSR cells were prepared at 34°C using Opti-pro serum-free medium (Invitrogen, Carlsbad, CA) supplemented with 4 μM l-glutamine.
Virus titration.
NA cells were grown for 2 days, and monolayers were infected with virus in 10-fold serial dilutions. Forty-eight hours postinfection (pi), cells were fixed with 80% acetone and stained with fluorescein isothiocyanate (FITC)-labeled RV N-specific antibody (Centocor, Horsham, PA). Virus titers in triplicate samples were determined using a fluorescence microscope.
Infection of mice.
Five- to six-week-old female Swiss Webster mice were purchased from Taconic Farms (Germantown, NY). Groups of 10 mice were infected intramuscularly (i.m.) in the gastrocnemius muscle with 3 × 10⁴ infectious virus particles in 100 μl of phosphate-buffered saline (PBS). Mice were observed daily for 21 days for clinical signs of rabies. Moribund mice were euthanized. All animal experiments were performed according to Institutional Animal Care and Use Committee-approved protocols (Animal Welfare Assurance no. A3085-01). Statistical analysis was performed using two-way analysis of variance (ANOVA) with Bonferroni posttests.
Construction of chimeric RV cDNA clones.
cDNA clones of the SN and SB RV strains were used to construct chimeric viruses (10, 20, 23). To replace the G gene of SN with that from SB, a 1.6-kb fragment containing the SB G open reading frame was amplified using Vent polymerase (New England Biolabs, Ipswich, MA), and DraI and NheI restriction sites were introduced upstream and downstream of the G gene by using primers 5′Dra+G (5′-CCCTTTAAAAAGATGATCCCCCAGGCTCTTCTG-3′; the DraI restriction site is underlined, and the start codon is in boldface) and 3′G+Nhe (5′-ATAGCTAGCTCACATCCCGGTCTCACTTT-3′; the NheI restriction site is underlined, and the stop codon is in boldface). The fragment was digested with DraI and NheI and cloned into pSN predigested with SmaI and NheI. The resulting plasmid was designated pSN-BG.
The SB M gene was introduced into pSN at a KpnI restriction site generated upstream of the RV M gene start signal sequence by using the QuikChange site-directed mutagenesis kit according to the protocol of the manufacturer (Stratagene, La Jolla, CA) and primers 5′KSN (5′-CCTCTAGACAATAAAATCCGAGAGGTACCAAAGTCAACATGAAAAAAAC-3′; the KpnI restriction site is underlined) and 3′KSN (5′-GTTTTTTTCATGTTGACTTTGGTACCTCTCGGATTTTATTGTCTAGAGG-3′; the KpnI restriction site is underlined). In the next step, two DNA fragments were synthesized. The nucleotide sequence comprising the SB M gene was PCR amplified using Vent polymerase and primers 5′Kpn+P+BM (5′-ATAGGTACCAAAGTCAACATGAAAAAAACAGGCAACACCACTGATAAG-3′; the KpnI restriction site is underlined) and 3′Nru+M (5′-AATCGCGACTATTCCAGAAGCACTGAAGA-3′; the NruI restriction site is underlined, and the stop codon is in boldface). The fragment containing the pseudogene and the RV M-G intergenic region was amplified, and NruI and XmaI restriction sites were introduced upstream and downstream of the sequence by using primers 5′NruI+SN-M (5′-AATCGCGATATATCCCGCAAATTTATCAC-3′; the NruI restriction site is underlined) and 3′Xma-SN-M (5′-CATCTTCCCGGGGTCTTT-3′; the XmaI restriction site is underlined). The two DNA fragments were ligated utilizing the NruI site, digested with KpnI and XmaI, and cloned into pSN predigested with KpnI and XmaI. The resulting plasmid was designated pSN-BM.
To construct the chimeric SN virus containing the M and G from SB, the fragment containing the SB M and G open reading frames and the intergenic sequence was amplified using Vent polymerase, the KpnI and NheI restriction sites were introduced upstream and downstream of the M and G genes by using primer pair 5′Kpn+P+BM and 3′G+Nhe, and the fragment was digested with KpnI and NheI and cloned into pSN predigested with KpnI and NheI. The resulting plasmid was designated pSN-BMBG.
To exchange the sequence of the CD of SB G with the corresponding SN sequence, several PCRs were performed. First, half of the sequence encoding the SN G CD was introduced into the region encoding the SB G ectodomain and the transmembrane domain by using primers S3-2F (5′-AGGCTCTTCTGTTTGTGC-3′) and RP 520 (5′-CGATCTTCTTAATAACATGTTGTAGAAGAGTCAATCGATCAGAACCTACGCAACACAATCTCAGAGGGACAGGGAGGG AGGTGTCAGTCA-3′; the sequence corresponding to the SB transmembrane domain is underlined). The PCR product was used as a template to introduce the other half of the sequence encoding the SN CD by using primer pair RT-4F (5′-TCCTCTACCTACTGCCCAACTA-3′) and RP 521 (5′-GGGAGGTGTCAGTCACTCCCCAAAGCGGGAAGATCATATCTTCATGGGAATCACACA AGAGTGGGGGTGAGACCAGACTGTAA-3′; the stop codon is in boldface). The XmaI and NheI restriction sites were introduced upstream and downstream of the PCR fragment by using primer pair 5′Xma-G (5′-CAAACTCAAGCTATGCGGA-3′) and RP 522 (5′-TTAAAGCTAGCTTACAGTCTGGTCT-3′). The fragment was digested with XmaI and NheI and cloned into predigested XmaI and NheI sites in pSN-BG. The resulting plasmid was designated pSN-BG NCD.
Virus rescue from cDNA clones.
Recombinant viruses were rescued as described previously (1, 28). Briefly, BSR-T7 cells were transfected using a calcium phosphate transfection kit (Stratagene, La Jolla, CA) with a full-length cDNA plasmid and plasmids encoding RV N, P, G, and L. After 3 days, supernatants were transferred onto BSR cells and incubated for another 3 days. Cells were examined for rescued virus by immunofluorescence staining with FITC-labeled RV N-specific antibody (Centocor, Inc.). Supernatants from virus-positive cultures were used to produce virus stock in BSR cells. Sequences of recovered viruses were confirmed by sequencing of reverse transcriptase PCR (RT-PCR) fragments.
Single- and multistep growth assays.
NA cell monolayers were infected at a multiplicity of infection (MOI) of 0.01 for multistep growth curves and at an MOI of 5 for single-step growth curves. After 1 h of incubation at 37°C, the inoculum was removed, cells were washed twice with PBS, and the cell cultures were replenished with RPMI 1640 medium with 0.2% bovine serum albumin (BSA) and incubated at 34°C. Supernatants were harvested at the time points indicated in the figures, and virus titers were determined. Immunofluorescent staining was used to ascertain that after infection at an MOI of 5, 100% of the cells were infected at 24 h pi.
RNA analysis and quantitative PCR.
Total RNA from NA cells infected at an MOI of 5 was isolated at 8, 24, and 48 h pi by using the RNeasy mini kit according to the protocol of the manufacturer (Qiagen, Valencia, CA). Reverse transcription and quantitative PCR were performed as described previously (8). Briefly, cDNA was synthesized using the Omniscript RT kit (Qiagen). Oligo(dT) was used as a primer for mRNA transcription, a specific primer was used for genomic RNA, and a hexanucleotide mix (Roche Applied Science, Indianapolis, IN) was used for the reference mouse 18S rRNA. Quantitative PCR was performed in a LightCycler 1.5 system with software version 3.5.3 (Roche) using a DyNAmo probe (New England Biolabs). Sequences of primers and probes for 18S rRNA and the SN backbone viruses, as well as the reaction conditions, have been described previously (8). The primer pair SB sense (5′-AGGAAAAGCCCCTGACTTG-3′) and SB antisense (5′-TGCTCCCTCAAAGAACTGC-3′) and the SB probe (6-carboxyfluorescein-5′-GCTCGACCCTGATGATGTATGCTCTTATCT-3′-6-carboxytetramethylrhodamine) were used for SB virus. RNA was quantitatively analyzed using the comparative threshold cycle method. Statistical differences among groups at each time point were analyzed using one-way ANOVA followed by Newman-Keuls multiple-comparison tests.
Flow cytometry.
Monolayers of NA cells grown in six-well plates were infected at an MOI of 5 and incubated for 48 h at 34°C. Cells were washed three times with PBS and dissociated using a cell stripper (MEDIATECH, Inc.). After centrifugation, cells were resuspended and fixed with 4% paraformaldehyde for 20 min at room temperature. Cells were washed twice with PBS, blocked with PBS containing 1% BSA and 10 mM glycine for 1 h, and incubated with rabbit anti-RV G antibody (1:2,000) followed by Alexa Fluor 488-conjugated goat anti-rabbit antibody (Invitrogen; 1:500). Flow cytometry was performed on an Epics XL flow cytometer (Beckman Coulter, Fullerton, CA). Results were analyzed using FlowJo software.
Western blot analysis.
Western blotting was performed as described previously (18). Briefly, NA cells grown in T25 tissue culture flasks were infected at an MOI of 5, incubated for 48 h at 34°C, and lysed with lysis buffer (10 mM Tris-HCl, pH 7.4, 150 mM NaCl, 1% Triton X-100, 0.5% sodium deoxycholate). After the lysates were mixed with an equal volume of 2× loading buffer (100 mM Tris-HCl [pH 6.8], 200 mM dithiothreitol, 2% SDS, 0.1% bromophenol blue, 10% glycerol), the proteins were resolved by sodium dodecyl sulfate-12% polyacrylamide gel electrophoresis and transferred onto a polyvinylidene difluoride membrane (Osmonics, Inc., Minnetonka, MN). The membrane was incubated with a mixture of polyclonal rabbit antibodies directed against RV M (generated by B. Dietzschold, Thomas Jefferson University) and anti-actin affinity-isolated antigen-specific antibody (Sigma, St. Louis, MO), followed by Alexa Fluor 555-conjugated anti-rabbit immunoglobulin G (IgG; Invitrogen). Proteins were detected using a molecular imager (Typhoon 9400; Amersham Bioscience, Pittsburgh, PA).
Virus spread assay.
Confluent Vero cells were infected at an MOI of 0.01 for 2 h at 37°C. After the removal of inocula, cells were washed twice with PBS, overlaid with semisolid agar medium (equal volumes of 2% low-melting-point agar and 2× Dulbecco modified essential medium with 0.4% BSA), and incubated at 34°C. At the times indicated in the figures, agar was removed and cells were washed with PBS, fixed with 80% acetone, and stained with FITC-labeled RV N-specific antibody (Centocor, Inc). Fluorescent foci were detected using a fluorescence microscope equipped with a video camera, and the sizes of the foci were calculated using Spot advanced software. Statistical differences among groups at each time point were analyzed using one-way ANOVA followed by Newman-Keuls multiple-comparison tests.
RESULTS
Pathogenicity of chimeric recombinant RVs.
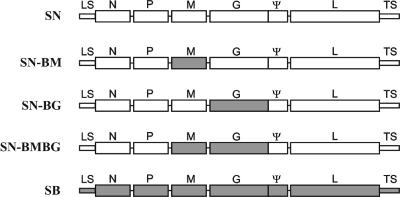
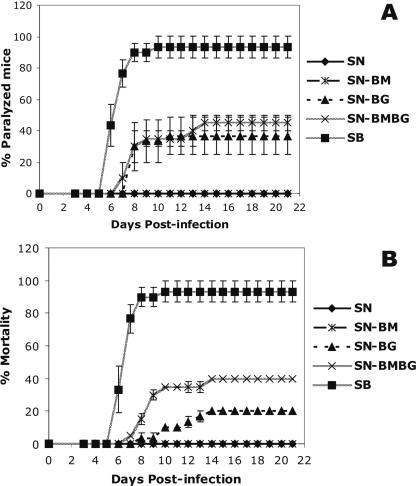
Unlike the pathogenic SB strain, which causes high mortality in mice after i.m. infection, the nonpathogenic SN strain does not produce any clinical signs of rabies after peripheral infection (10). The SN and SB strains exhibit significant differences in nucleotide sequence over the entire genomes, including coding and noncoding regions (10). The M and G of SN and SB have 86.2 and 86.1% amino acid homology, respectively. Previous data indicate that in addition to RV G, RV M plays a role in RV pathogenesis (10). To determine whether the replacement of the G gene, the M gene, or both genes in SN by the corresponding genes of SB would cause an increase in the pathogenicity, we constructed the following chimeric viruses: SN-BG, in which the G gene of SN was replaced with that of SB; SN-BM, in which the M gene of SN was replaced by the M gene from SB; and SN-BMBG, in which both M and G genes were exchanged (Fig. 1). We then infected mice with each virus. While 93% of mice infected with SB developed hind-limb paralysis and died, 37% of mice infected with SN-BG and 45% of mice infected with SN-BMBG showed hind-limb paralysis (Fig. 2A). Moreover, 20% of mice infected with SN-BG died, compared to 40% of mice infected with SN-BMBG (Fig. 2B). None of the mice infected with SN or SN-BM showed any signs of disease or exhibited weight loss. These data indicate that the introduction of G from the pathogenic SB strain significantly increased (P < 0.001) the pathogenicity of the SN parental strain, while the exchange of M alone did not affect the pathogenicity of SN. Moreover, the exchange of both M and G for the proteins from the SB strain resulted in significantly higher mortality (P < 0.01) among the infected mice than did infection with the chimera in which only the G was exchanged (Fig. 2A and B).
FIG. 1.
Schematic of chimeric recombinant RVs with components of the highly pathogenic SB strain (gray boxes) and the nonpathogenic SN strain (white boxes). SN-BM, SN-BG, and SN-BMBG were constructed by the replacement of the M or G gene or both M and G genes in the SN backbone with the corresponding genes of SB. LS, leader sequence; TS, trailer sequence; ψ, pseudogene.
FIG. 2.
Rates of hind-limb paralysis (A) and mortality (B) among adult mice infected with recombinant RVs. Groups of 10 Swiss Webster mice were infected i.m. (in the gastrocnemius muscle) with 3 × 10⁴ focus-forming units and observed daily for signs of rabies. Moribund animals were euthanized. Data are the means (± standard errors [SE]) of results from three independent experiments.
In vitro growth of chimeric recombinant RVs in NA cells.
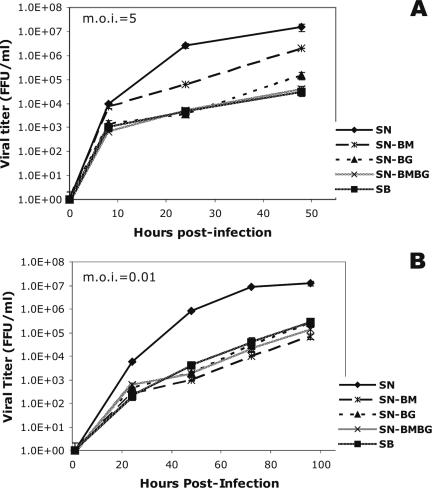
The replication rate of RV has been implicated as a major determinant of the pathogenicity of the virus (23, 24). To investigate whether the exchange of the M or G gene or both genes has an effect on viral growth kinetics that may account for the differences in the observed degrees of pathogenicity, we compared the production processes of the chimeric and parental viruses in NA cells. Single-step growth curves (Fig. 3A) showed that SN-BMBG and SB had very similar growth kinetics, whereas SN-BG produced an approximately fivefold-higher titer than SN-BMBG or SB. SN-BM replicated at the highest rate among the chimeric viruses, reaching a titer almost 20-fold higher than that of SB, although this titer was still at least 10-fold lower than that of the parental strain SN.
FIG. 3.
Single-step (A) and multistep (B) growth curves for the chimeric recombinant viruses SN-BM, SN-BG, and SN-BMBG and the parental viruses SN and SB. NA cells were infected in duplicate at an MOI of 5 (A) or 0.01 (B), and the titers of virus in the tissue culture supernatants were determined at the indicated time points. Data are the means (± SE) of results from three independent experiments. FFU, focus-forming units.
On the other hand, multistep growth curves, which are indicative of the rates of viral growth and virus spread, revealed similar growth rates for the parental SB strain and the chimeric viruses, except for SN-BM, which produced about fivefold-lower titers than SB (Fig. 3B). As in the single-step growth curves, the parental SN strain exhibited the highest growth rate of all viruses. The results of both single- and multistep growth kinetic assays demonstrate that the RV M and G each play a role in determining the rate of virus growth in tissue culture, and these findings suggest that the viral growth rate in vitro correlates inversely with pathogenicity. The differences between the single- and multistep viral growth curves suggest an additional role for M and G in virus spread (see below).
Quantitative RT-PCR analysis of viral transcription and replication in NA cells.
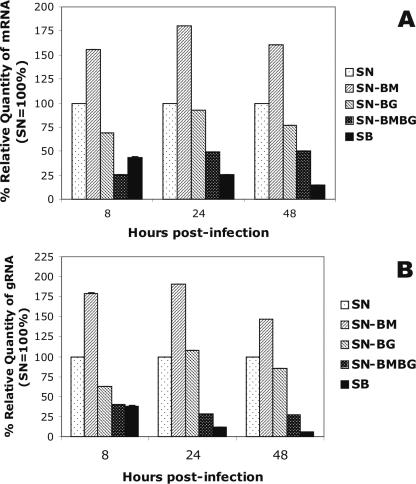
To investigate whether the differences in viral growth kinetics are determined at the RNA level, we performed quantitative RT-PCR using RNA isolated from SN-BM-, SN-BG-, SN-BMBG-, SN-, or SB-infected NA cells. Comparison of the relative amounts of viral mRNA or genomic RNA produced in SN-BM-, SN-BG-, SN-BMBG-, or SB-infected cells with those produced in SN-infected cells revealed the lowest amounts of both viral mRNA and genomic RNA in SB-infected cells at all time points, except 8 h pi for viral mRNA (Fig. 4). At 48 h pi, levels of viral mRNA and genomic RNA in SB-infected cells were 6.9- and 16.7-fold lower, respectively (P < 0.001), than those detected in SN-infected cells. While the levels of mRNA and genomic RNA produced by SN-BG at 48 h pi were only 1.3- and 1.2-fold lower, respectively (P < 0.01), than those produced by SN, viral mRNA and genomic RNA levels produced in SN-BMBG-infected cells were 2- and 3.7-fold lower than the corresponding RNA levels produced by SN at 48 h pi (P < 0.001). In contrast, mRNA and genomic RNA levels in SN-BM-infected cells were 1.5 times higher than those in SN-infected cells (P < 0.001). These data suggest that RV G and RV M are involved in the regulation of viral RNA transcription and replication by an as-yet-unknown mechanism and further support the notion that the viral replication rate observed in vitro correlates inversely with pathogenicity.
FIG. 4.
Transcription of viral mRNA (A) and replication of viral genomic RNA (B) in NA cells infected with the chimeric viruses SN-BM, SN-BG, and SN-BMBG and the parental virus SB relative to those in cells infected with SN (the quantity of SN RNA was taken as 100%). Cells were infected at an MOI of 5, and total RNA was isolated at the indicated time points. A fragment of RV N mRNA or the N gene of genomic RV RNA was reverse transcribed and subjected to quantitative PCR analysis. The data were normalized using 18S rRNA as an internal control and analyzed using the comparative threshold cycle method. Data are means (± standard deviations) of values for triplicate samples in one of two independent experiments with superimposable results. gRNA, genomic RNA.
Expression of RV G and RV M parallels viral RNA synthesis rates.
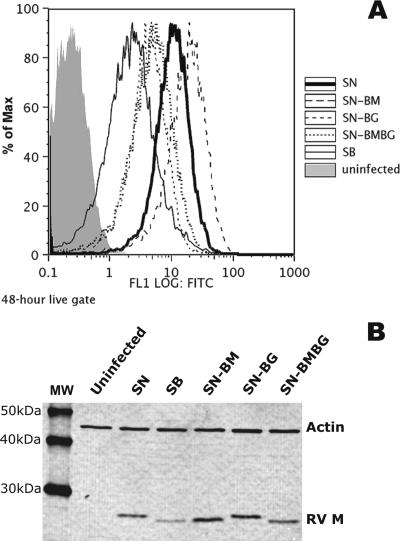
Fluorescence-activated cell sorter analysis of the surface expression of RV G (Fig. 5A) and Western blot analysis of RV M expression (Fig. 5B) to determine whether the differences in viral RNA synthesis rates were reflected in the levels of expression of these proteins revealed the highest level of surface expression of G, as well as the highest level of RV M expression, in SN-BM-infected cells, followed by SN-infected cells, SN-BG-infected cells, and SN-BMBG-infected cells, with the lowest levels observed in SB-infected cells (Fig. 5). Thus, the levels of G and M expression parallel the viral mRNA synthesis rates in the different viruses, indicating that the pathogenicity of an RV is determined not only by the amount of G expressed on the cell surface, as previously shown (24), but also by the expression level of M.
FIG. 5.
Cell surface expression of RV G (A) and Western blot analysis of RV M (B) in NA cells either uninfected or infected with the chimeric viruses SN-BM, SN-BG, and SN-BMBG or with the parental viruses SN and SB at an MOI of 5 for 48 h. (A) Cells were incubated with rabbit anti-RV G polyclonal antibody followed by Alexa 488-conjugated anti-rabbit IgG. Surface expression was assessed by flow cytometry, and results were analyzed using FlowJo software. (B) Cells were subjected to Western blot analysis as described in Materials and Methods. RV M was detected using polyclonal rabbit antibody against RV M followed by Alexa Fluor 555-anti-rabbit IgG. Actin, which was detected with a polyclonal rabbit antibody against mouse actin, served as a loading control. MW indicates molecular mass markers. Proteins were visualized using a molecular imager.
M and G from the same RV strain are required for efficient virus spread.
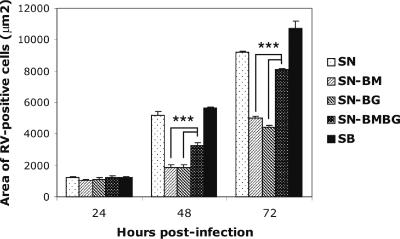
To determine whether differences among the viruses in the ability to spread might account for the differences between single- and multistep growth curves (Fig. 3), we assessed virus spread in Vero cells. These cells were chosen because they survive overlay with agar and produce sharp foci, which allow a more accurate measurement than foci that are not as sharp. The parental viruses SB and SN showed the most extensive cell-to-cell spread, while the lowest level of spread was observed in cells infected with SN-BM or SN-BG (Fig. 6). Interestingly, the level of spread of SN-BMBG, which contains both M and G from SB, was significantly higher (P < 0.001) than that of SN-BG and SN-BM, which contain M and G from SB and SN, respectively, suggesting that an optimal interaction of M with G may play an important role in virus cell-to-cell spread.
FIG. 6.
Spread of the chimeric viruses SN-BM, SN-BG, and SN-BMBG and the parental viruses SN and SB in Vero cells. Cells were infected at an MOI of 0.01 and overlaid with semisolid agar. At the indicated times, the agar overlay was removed and the cells were fixed with 80% acetone and stained with FITC-labeled anti-RV N antibody. Fluorescent foci were captured, and the size of each focus was calculated using Spot advanced software. Each bar represents means (± SE) of results for 30 foci. Asterisks indicate significant differences (P < 0.001).
Exchange of the RV G CD does not significantly affect viral growth or spread.
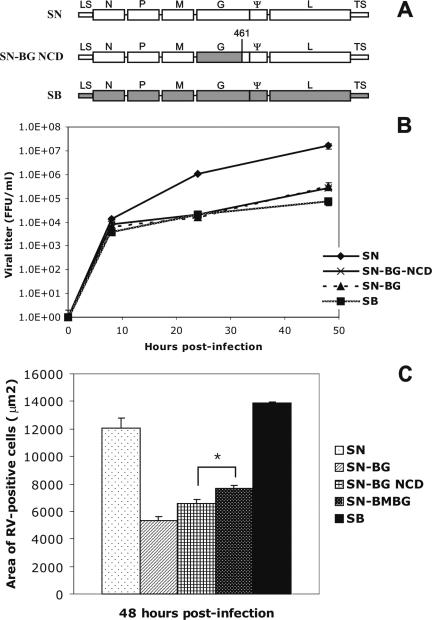
It has been suggested previously that RV M interacts with the CD of RV G (13, 22). Since the amino acid sequences of the CDs of SB G and SN G differ by 43%, we constructed a chimeric virus in which the CD of SB G was exchanged with that of SN G, resulting in SN-BG NCD (Fig. 7A). Viral growth curves revealed similar growth kinetics for SN-BG NCD and SN-BG (Fig. 7B). While SN-BG NCD exhibited somewhat more efficient virus spread than SN-BG, the extent of spread was still significantly lower than that of SN-BMBG (P < 0.05) (Fig. 7C).
FIG. 7.
(A) Schematic of chimeric recombinant SN-BG NCD, which contains the ectodomain and transmembrane domain of SB on the backbone of the SN parental virus. The number 461 indicates the position of the amino acid in G where the CD begins. LS, leader sequence; TS, trailer sequence; ψ, pseudogene. (B) Single-step growth curves of the chimeric and parental recombinant viruses in NA cells. Data are the means (± SE) of results from three independent experiments. FFU, focus-forming units. (C) Spread of the recombinant viruses in Vero cells. Data are the mean areas (± SE) for 30 foci. The asterisk indicates a significant difference (P < 0.05).
DISCUSSION
We previously showed that the G of the RV strain SB is a major determinant of the pathogenicity of this variant (10). To further analyze the role of the RV G in determining pathogenicity, we constructed chimeric virus SN-BG, in which the G gene of the nonpathogenic SN strain was replaced by that of the pathogenic SB strain. Intramuscular infection of mice with this chimeric virus revealed that the pathogenicity of a nonpathogenic RV strain was increased by the G gene from a pathogenic RV strain, consistent with data obtained using other recombinant RVs (23, 31). However, the degree of pathogenicity of SN-BG was still significantly lower than that of SB, indicating that viral elements in addition to the G gene contribute to the pathogenic phenotype of SB. The exchange of both the G and M genes in SN with the corresponding genes from SB (SN-BMBG) significantly increased the pathogenicity compared to that of SN-BG, while the exchange of the M gene alone in SN had no effect on pathogenicity.
The regulation of viral replication appears to be one of the important mechanisms involved in RV pathogenesis. To evade the immune response and to preserve the integrity of the neuronal network, pathogenic RV strains, but not attenuated strains, can downregulate their growth rate. An analysis of viral growth kinetics revealed that the chimeric virus SN-BG replicated at a rate ∼100 times lower than that of SN. Furthermore, a quantitative analysis of viral RNA synthesis showed that the rate of viral transcription and replication in SN-BG-infected cells was significantly lower than that in SN-infected cells, suggesting that RV G regulates viral growth at the RNA level; this result was consistent with our previous finding that the dominance of a nonpathogenic RV G over a pathogenic RV G is regulated at the level of RNA synthesis (8). Moreover, we found that the rate of viral RNA synthesis was significantly lower in cells infected with the more pathogenic SN-BMBG than in cells infected with the less pathogenic SN-BG. The lowest levels of viral RNA synthesis were detected in cells infected with SB, the most pathogenic RV, whereas SN-BM, which was completely nonpathogenic after peripheral infection, produced the highest levels of viral RNA. These data are in accord with previous reports that the viral replication rate in tissue culture correlates inversely with pathogenicity (8, 10, 24).
The variations in the rates of viral RNA synthesis observed with the different RVs were reflected in the expression of RV G and RV M. Like the rate of viral RNA transcription, the amounts of RV G or RV M as determined by fluorescence-activated cell sorter analysis or Western blot analysis, respectively, correlated inversely with virus pathogenicity. The similar levels of G expression by SN-BG- and SN-BMBG-infected cells despite differences in the viral pathogenicity suggest that other parameters also play a role in RV pathogenesis. Indeed, viral spread assays showed that the chimeric virus bearing both RV M and G from the same strain spread more efficiently than a virus containing RV M or G from a different strain. Because the M of SN and that of SB have only 86% amino acid homology and because M interacts with RV G (22), it is possible that the G of SN does not interact sufficiently with the M of SB. In addition to interacting with G, M must interact efficiently with the RNP. Thus, the lower rate of cell-to-cell spread of SN-BMBG than of SN or SB may result from insufficient interaction between the SB M and the SN RNP.
The pathogenicity of SN-BG or SN-BMBG appears to correlate with the cell-to-cell spread rate. In this respect, it should be noted that on average, 45% of SN-BG-infected mice showing hind-limb paralysis recovered from the infection, suggesting that viral spread from the spinal cord to the brain was slow enough to allow clearance of the infection by host immune effectors before extensive virus replication in the brain. By contrast, 90 and 100% of mice that developed hind-limb paralysis after infection with SN-BMBG and SB, respectively, succumbed to the infection. The complete absence of paralysis or mortality in mice infected with SN, despite its efficient cell-to-cell spread activity, is likely due to the very high replication rate of this virus as well as to differences in receptor usage (3, 16) and the kinetics of virus uptake (5, 10).
The decrease in the level of cell-to-cell spread activity of SN-BG compared to that of SN-BMBG may result from the CD of SB G, which has only 57% amino acid homology to the CD of the SN G. However, while the cell-to-cell spread activity of SN-BG NCD, in which the CD of the SB G was replaced by the CD of the SN G, was increased compared to that of SN-BG, it was still significantly lower than the spread activity of SN-BMBG, suggesting that the entire G protein rather than only the G CD structure participates in the cell-to-cell spread. This conclusion is consistent with results from studies of vesicular stomatitis virus which indicate that a specific CD amino acid sequence is not required for efficient virus budding (27).
RVs use several strategies to evade the host immune responses and to successfully complete their life cycle. To avoid early recognition by immune effectors, a pathogenic RV must regulate its replication and antigen expression to the lowest possible level. This downregulation in turn preserves the integrity of the neuronal structure and function and allows efficient virus spread into and within the central nervous system. The RV M and RV G genes appear to play a significant role in the regulation of virus replication and, thus, in RV pathogenesis.
Acknowledgments
This study was supported by NIH grants AI45097 and AI060686.
We have no conflicts of interest with this publication.
Footnotes
Published ahead of print on 19 December 2007.
REFERENCES
- 1.Buchholz, U. J., S. Finke, and K. K. Conzelmann. 1999. Generation of bovine respiratory syncytial virus (BRSV) from cDNA: BRSV NS2 is not essential for virus replication in tissue culture, and the human RSV leader region acts as a functional BRSV genome promoter. J. Virol. 73251-259. [DOI] [PMC free article] [PubMed] [Google Scholar]
- 2.Conzelmann, K. K. 2004. Reverse genetics of mononegavirales. Curr. Top. Microbiol. Immunol. 2831-41. [DOI] [PubMed] [Google Scholar]
- 3.Coulon, P., P. E. Rollin, and A. Flamand. 1983. Molecular basis of rabies virus virulence. II. Identification of a site on the CVS glycoprotein associated with virulence. J. Gen. Virol. 64(Pt. 3)693-696. [DOI] [PubMed] [Google Scholar]
- 4.Dietzschold, B., C. E. Rupprecht, Z. F. Fu, and H. Koprowski. 1996. Rhabdoviruses, 3rd ed. Lippincott-Raven, Philadelphia, PA.
- 5.Dietzschold, B., T. J. Wiktor, J. Q. Trojanowski, R. I. Macfarlan, W. H. Wunner, M. J. Torres-Anjel, and H. Koprowski. 1985. Differences in cell-to-cell spread of pathogenic and apathogenic rabies virus in vivo and in vitro. J. Virol. 5612-18. [DOI] [PMC free article] [PubMed] [Google Scholar]
- 6.Dietzschold, B., W. H. Wunner, T. J. Wiktor, A. D. Lopes, M. Lafon, C. L. Smith, and H. Koprowski. 1983. Characterization of an antigenic determinant of the glycoprotein that correlates with pathogenicity of rabies virus. Proc. Natl. Acad. Sci. USA 8070-74. [DOI] [PMC free article] [PubMed] [Google Scholar]
- 7.Etessami, R., K. K. Conzelmann, B. Fadai-Ghotbi, B. Natelson, H. Tsiang, and P. E. Ceccaldi. 2000. Spread and pathogenic characteristics of a G-deficient rabies virus recombinant: an in vitro and in vivo study. J. Gen. Virol. 812147-2153. [DOI] [PubMed] [Google Scholar]
- 8.Faber, M., M. L. Faber, J. Li, M. A. Preuss, M. J. Schnell, and B. Dietzschold. 2007. Dominance of a nonpathogenic glycoprotein gene over a pathogenic glycoprotein gene in rabies virus. J. Virol. 817041-7047. [DOI] [PMC free article] [PubMed] [Google Scholar]
- 9.Faber, M., R. Pulmanausahakul, S. S. Hodawadekar, S. Spitsin, J. P. McGettigan, M. J. Schnell, and B. Dietzschold. 2002. Overexpression of the rabies virus glycoprotein results in enhancement of apoptosis and antiviral immune response. J. Virol. 763374-3381. [DOI] [PMC free article] [PubMed] [Google Scholar]
- 10.Faber, M., R. Pulmanausahakul, K. Nagao, M. Prosniak, A. B. Rice, H. Koprowski, M. J. Schnell, and B. Dietzschold. 2004. Identification of viral genomic elements responsible for rabies virus neuroinvasiveness. Proc. Natl. Acad. Sci. USA 10116328-16332. [DOI] [PMC free article] [PubMed] [Google Scholar]
- 11.Finke, S., and K. K. Conzelmann. 2003. Dissociation of rabies virus matrix protein functions in regulation of viral RNA synthesis and virus assembly. J. Virol. 7712074-12082. [DOI] [PMC free article] [PubMed] [Google Scholar]
- 12.Finke, S., R. Mueller-Waldeck, and K. K. Conzelmann. 2003. Rabies virus matrix protein regulates the balance of virus transcription and replication. J. Gen. Virol. 841613-1621. [DOI] [PubMed] [Google Scholar]
- 13.Foley, H. D., J. P. McGettigan, C. A. Siler, B. Dietzschold, and M. J. Schnell. 2000. A recombinant rabies virus expressing vesicular stomatitis virus glycoprotein fails to protect against rabies virus infection. Proc. Natl. Acad. Sci. USA 9714680-14685. [DOI] [PMC free article] [PubMed] [Google Scholar]
- 14.Hanham, C. A., F. Zhao, and G. H. Tignor. 1993. Evidence from the anti-idiotypic network that the acetylcholine receptor is a rabies virus receptor. J. Virol. 67530-542. [DOI] [PMC free article] [PubMed] [Google Scholar]
- 15.Ito, N., M. Takayama, K. Yamada, M. Sugiyama, and N. Minamoto. 2001. Rescue of rabies virus from cloned cDNA and identification of the pathogenicity-related gene: glycoprotein gene is associated with virulence for adult mice. J. Virol. 759121-9128. [DOI] [PMC free article] [PubMed] [Google Scholar]
- 16.Kucera, P., M. Dolivo, P. Coulon, and A. Flamand. 1985. Pathways of the early propagation of virulent and avirulent rabies strains from the eye to the brain. J. Virol. 55158-162. [DOI] [PMC free article] [PubMed] [Google Scholar]
- 17.Lentz, T. L., T. G. Burrage, A. L. Smith, J. Crick, and G. H. Tignor. 1982. Is the acetylcholine receptor a rabies virus receptor? Science 215182-184. [DOI] [PubMed] [Google Scholar]
- 18.Li, J., M. Faber, A. Papaneri, M. L. Faber, J. P. McGettigan, M. J. Schnell, and B. Dietzschold. 2006. A single immunization with a recombinant canine adenovirus expressing the rabies virus G protein confers protective immunity against rabies in mice. Virology 356147-154. [DOI] [PubMed] [Google Scholar]
- 19.Mazarakis, N. D., M. Azzouz, J. B. Rohll, F. M. Ellard, F. J. Wilkes, A. L. Olsen, E. E. Carter, R. D. Barber, D. F. Baban, S. M. Kingsman, A. J. Kingsman, K. O'Malley, and K. A. Mitrophanous. 2001. Rabies virus glycoprotein pseudotyping of lentiviral vectors enables retrograde axonal transport and access to the nervous system after peripheral delivery. Hum. Mol. Genet. 102109-2121. [DOI] [PubMed] [Google Scholar]
- 20.McGettigan, J. P., H. D. Foley, I. M. Belyakov, J. A. Berzofsky, R. J. Pomerantz, and M. J. Schnell. 2001. Rabies virus-based vectors expressing human immunodeficiency virus type 1 (HIV-1) envelope protein induce a strong, cross-reactive cytotoxic T-lymphocyte response against envelope proteins from different HIV-1 isolates. J. Virol. 754430-4434. [DOI] [PMC free article] [PubMed] [Google Scholar]
- 21.Mebatsion, T., M. Konig, and K. K. Conzelmann. 1996. Budding of rabies virus particles in the absence of the spike glycoprotein. Cell 84941-951. [DOI] [PubMed] [Google Scholar]
- 22.Mebatsion, T., F. Weiland, and K. K. Conzelmann. 1999. Matrix protein of rabies virus is responsible for the assembly and budding of bullet-shaped particles and interacts with the transmembrane spike glycoprotein G. J. Virol. 73242-250. [DOI] [PMC free article] [PubMed] [Google Scholar]
- 23.Morimoto, K., H. D. Foley, J. P. McGettigan, M. J. Schnell, and B. Dietzschold. 2000. Reinvestigation of the role of the rabies virus glycoprotein in viral pathogenesis using a reverse genetics approach. J. Neurovirol. 6373-381. [DOI] [PubMed] [Google Scholar]
- 24.Morimoto, K., D. C. Hooper, S. Spitsin, H. Koprowski, and B. Dietzschold. 1999. Pathogenicity of different rabies virus variants inversely correlates with apoptosis and rabies virus glycoprotein expression in infected primary neuron cultures. J. Virol. 73510-518. [DOI] [PMC free article] [PubMed] [Google Scholar]
- 25.Prehaud, C., S. Lay, B. Dietzschold, and M. Lafon. 2003. Glycoprotein of nonpathogenic rabies viruses is a key determinant of human cell apoptosis. J. Virol. 7710537-10547. [DOI] [PMC free article] [PubMed] [Google Scholar]
- 26.Sato, M., H. Tanaka, T. Yamada, and N. Yamamoto. 1977. Persistent infection of BHK21/WI-2 cells with rubella virus and characterization of rubella variants. Arch. Virol. 54333-343. [DOI] [PubMed] [Google Scholar]
- 27.Schnell, M. J., L. Buonocore, E. Boritz, H. P. Ghosh, R. Chernish, and J. K. Rose. 1998. Requirement for a non-specific glycoprotein cytoplasmic domain sequence to drive efficient budding of vesicular stomatitis virus. EMBO J. 171289-1296. [DOI] [PMC free article] [PubMed] [Google Scholar]
- 28.Schnell, M. J., T. Mebatsion, and K. K. Conzelmann. 1994. Infectious rabies viruses from cloned cDNA. EMBO J. 134195-4203. [DOI] [PMC free article] [PubMed] [Google Scholar]
- 29.Schnell, M. J., G. S. Tan, and B. Dietzschold. 2005. The application of reverse genetics technology in the study of rabies virus (RV) pathogenesis and for the development of novel RV vaccines. J. Neurovirol. 1176-81. [DOI] [PubMed] [Google Scholar]
- 30.Seif, I., P. Coulon, P. E. Rollin, and A. Flamand. 1985. Rabies virulence: effect on pathogenicity and sequence characterization of rabies virus mutations affecting antigenic site III of the glycoprotein. J. Virol. 53926-934. [DOI] [PMC free article] [PubMed] [Google Scholar]
- 31.Tan, G. S., M. A. Preuss, J. C. Williams, and M. J. Schnell. 2007. The dynein light chain 8 binding motif of rabies virus phosphoprotein promotes efficient viral transcription. Proc. Natl. Acad. Sci. USA 1047229-7234. [DOI] [PMC free article] [PubMed] [Google Scholar]
- 32.Thoulouze, M. I., M. Lafage, M. Schachner, U. Hartmann, H. Cremer, and M. Lafon. 1998. The neural cell adhesion molecule is a receptor for rabies virus. J. Virol. 727181-7190. [DOI] [PMC free article] [PubMed] [Google Scholar]
- 33.Tuffereau, C., J. Benejean, D. Blondel, B. Kieffer, and A. Flamand. 1998. Low-affinity nerve-growth factor receptor (P75NTR) can serve as a receptor for rabies virus. EMBO J. 177250-7259. [DOI] [PMC free article] [PubMed] [Google Scholar]
- 34.Tuffereau, C., H. Leblois, J. Benejean, P. Coulon, F. Lafay, and A. Flamand. 1989. Arginine or lysine in position 333 of ERA and CVS glycoprotein is necessary for rabies virulence in adult mice. Virology 172206-212. [DOI] [PubMed] [Google Scholar]
- 35.Yan, X., P. S. Mohankumar, B. Dietzschold, M. J. Schnell, and Z. F. Fu. 2002. The rabies virus glycoprotein determines the distribution of different rabies virus strains in the brain. J. Neurovirol. 8345-352. [DOI] [PubMed] [Google Scholar]
- 36.Yan, X., M. Prosniak, M. T. Curtis, M. L. Weiss, M. Faber, B. Dietzschold, and Z. F. Fu. 2001. Silver-haired bat rabies virus variant does not induce apoptosis in the brain of experimentally infected mice. J. Neurovirol. 7518-527. [DOI] [PubMed] [Google Scholar]


