Abstract
Varicella-zoster virus (VZV) is renowned for its very low titer when grown in cultured cells. There remains no single explanation for the low infectivity. In this study, viral particles on the surfaces of infected cells were examined by several imaging technologies. Few surface particles were detected at 48 h postinfection (hpi), but numerous particles were observed at 72 and 96 hpi. At 72 hpi, 75% of the particles resembled light (L) particles, i.e., envelopes without capsids. By 96 hpi, 85% of all particles resembled L particles. Subsequently, the envelopes of complete virions and L particles were investigated to determine their glycoprotein constituents. Glycoproteins gE, gI, and gB were detected in the envelopes of both types of particles in similar numbers; i.e., there appeared to be no difference in the glycoprotein content of the L particles. The viral particles emerged onto the cell surface amid actin-based filopodia, which were present in abundance within viral highways. Viral particles were easily detected at the base of and along the exterior surfaces of the filopodia. VZV particles were not detected within filopodia. In short, these results demonstrate that VZV infection of cultured cells produces a larger proportion of aberrant coreless particles than has been seen with any other previously examined alphaherpesvirus. Further, these results suggested a major disassociation between capsid formation and envelopment as an explanation for the invariably low VZV titer in cultured cells.
Varicella-zoster virus (VZV) is renowned for its extremely low titer when grown in cultured cells. Explanations for this low titer have been pursued for decades. In this investigation, we hypothesized that one of the earliest explanations, an aberrant structure, was at least partly responsible for the markedly reduced infectivity in cell culture.
In 1968, Cook and Stevens reported that extranuclear VZ virions were distinguishable from herpes simplex virions by the presence of pleomorphism: VZV had incomplete coats and loss of central dense cores (2). Those authors suggested that aberrant assembly was a potential reason for the lack of cell-free virus. In their work, Cook and Stevens did not describe in detail the characteristics of extracellular VZV. The cell-associated nature of VZV has limited the repertoire of techniques available to those wishing to study VZV outside the cellular environment. Earlier studies (41) using scanning electron microscopy (SEM) illustrated the presence of viral particles arranged in clusters on the surface of infected human melanoma cells (MeWo). In 1995, Harson and Grose (18) reported a very distinguishing characteristic of VZV-infected cells. Thousands of extracellular viral particles were seen on the surfaces of fused cell monolayers. Instead of being randomly distributed over the cell surface, egressed viral particles were arranged in an elongated pattern termed “viral highways.” This viral egress phenotype was seen with all VZV strains examined in MeWo cells, including the vaccine strain VZV-Oka, and had not been seen previously with any other herpesviruses (35).
The present study is a more detailed characterization of the microenvironment on the surface of VZV-infected cells. In 2003, Padilla et al. used SEM to compare the egress patterns and virus structure of seven alphaherpesviruses, including VZV (35). They saw a greater degree of aberrancy in VZV structure than in six other herpesviruses. For the present project, immunogold labeling of viral glycoproteins was combined with both transmission electron microscopy (TEM) and SEM in order to define the topography of the VZV particle with even more clarity (6, 7, 9, 31). While immunogold labeling of viral proteins in TEM images has been extensively applied to other herpesviruses, such as herpes simplex virus 1 (HSV-1), the combination technology of immuno-TEM and immuno-SEM has rarely been used. One reason is that the gold beads (10 to 25 nm) typically used in TEM are larger than the objects (glycoproteins) being imaged. Therefore, we employed ultrasmall (0.2-nm) gold beads that were later silver enhanced to label the viral glycoproteins (48). A second important barrier to imaging has been limited resolution of earlier SEM methodology (23, 36). To circumvent this problem, we combined immunogold labeling with the markedly higher resolution of the latest-model Hitachi S-4800 field emission SEM (FE-SEM). The above protocols offer an exciting combination of three-dimensional, ultrastructural, and immunological approaches for the evaluation of virus surface structure. By these methods, we observed that VZV-induced viral highways contain a more complicated mixture of cell surface components than previously noted, which provides an explanation in part for the low VZV titer. In particular, we report that light (L) particles are the major component of all surface VZV particles.
MATERIALS AND METHODS
Viruses and cells.
Strain VZV-32 was first isolated in Texas from a child with chicken pox (11) and is considered a low-passage laboratory strain. Its genome has been completely sequenced and falls within a European clade of VZV genotypes (37). Human melanoma cells designated MeWo were used for all experiments (15). Cells were grown for SEM imaging on both carbon-coated and uncoated circular 12-mm glass coverslips in minimal essential medium with Earle's salts supplemented with 10% fetal bovine serum. Coated coverslips were generated by coating with carbon and hydrophilizing using irradiation with UV light for 12 h, followed by glow discharge for a few seconds and then sterilizing by dry heat (160°C overnight). For TEM, cells were simply grown in the wells of a culture plate. When cells were nearly confluent, they were inoculated with VZV-infected cells at a ratio of one infected cell to eight uninfected cells by previously described methods (11).
Primary and secondary antibodies.
Mouse monoclonal antibody (MAb) 3B3 and human MAb V2 recognize VZV gE (19), while mouse MAb 6B5 is specific for VZV gI (50). Mouse MAb 251D9 binds to a minor VZV capsid protein (5). Human MAb V1 recognizes gB (29). The mouse MAbs were produced in this laboratory, and the human MAbs were given to us by K. Shiraki at the University of Toyama in Japan. Both 10-nm and ultrasmall (0.2-nm) gold beads conjugated to goat anti-mouse immunoglobulin G (IgG) F(ab′)2 and goat anti-human IgG F(ab′)2 (Electron Microscopy Sciences) were used as secondary antibodies. For confocal microscopy, the Alexa 488 fluoroprobe (Molecular Probes) conjugated to goat anti-mouse IgG F(ab′)2 was used. In some samples, phalloidin (Molecular Probes) was added in the amount of 5 μl per coverslip. Phalloidin fluoresces at 565 nm.
Density gradient sedimentation.
Following the procedure described by Grose et al. (15), viral particles were separated by density gradient sedimentation. The gradient was generated by mixing 7 ml of 30% (vol/vol) glycerol in TE buffer (2 mM Tris, 2 mM EDTA [pH 7.4]) and 8 ml of 50% (wt/vol) potassium tartrate in TE buffer in a gradient maker (Buchler Instrument Company). Infected cells were suspended in sorbitol buffer (10% sorbitol in 0.05 M Tris and 0.001 M MgCl2) by cell scraping and then sonicated to disrupt the cells. The sonicated material was centrifuged at low speed for 10 min, and the supernatant was layered onto the density gradient before centrifugation in a Beckman SW-27 rotor at 25,000 rpm at 4°C for 24 h. Each of the two bands was collected by pipette, pelleted by high-speed centrifugation, and then resuspended in sorbitol buffer. The two samples were further clarified by a second density gradient sedimentation.
Immunolabeling for SEM and TEM.
Infected and uninfected control cells were prefixed with 2% paraformaldehyde in 0.1 M sodium cacodylate buffer, washed with 0.15 M phosphate-buffered saline (PBS) three times for 5 min each time, and then blocked with 0.05% NaBH4 plus 0.1% glycine in PBS for 15 min. Samples were then incubated with 0.2% bovine serum albumin (BSA) containing 5% normal goat serum in PBS for 1 h. Subsequently, the samples were incubated with one of the primary MAbs diluted 1:100 in 0.2% BSA at 37°C for 2 h and then kept at 4°C overnight. After rinsing with BSA-c buffer (Aurion BSA-c diluted to 0.2% in PBS), the specimens were treated with the appropriate secondary antibody diluted 1:250 in BSA-c buffer, incubated at 37°C for 2 h, and then kept at 4°C overnight. The specimens were subsequently rinsed three times for 5 min each time with 0.2% BSA buffer, postfixed with 4% glutaraldehyde in 0.1 M sodium cacodylate buffer (pH 7.4) for 10 min, and then rinsed again with PBS.
Immunoblotting.
Antigens within viral material lysates were prepared for immunoblotting by previously described techniques using a SuperSignal chemiluminescent kit (Pierce) (43). The protein component of the lysate was separated on an 12% sodium dodecyl sulfate-acrylamide gel, transferred to a membrane, and blotted with mouse MAb 3B3 to detect gE or mouse MAb 251D9 to detect a minor VZV capsid protein.
Sample preparation for confocal microscopy.
Our methods for confocal microscopy have been extensively described (34). Following immunostaining with the Alexa 488 secondary antibody (Molecular Probes) and rinsing with PBS, the coverslips were turned over onto a drop of H-1200 Vectashield (Vector Labs) on a glass slide and then sealed in place with nail polish. After hardening, the samples were directly viewable on a Zeiss confocal microscope.
Sample preparation for SEM.
Two protocols were used in this study. Both are based on a previous protocol (35) but differ in the amount of washing and osmium tetroxide fixation.
(i) Protocol 1.
Following postfixation with glutaraldehyde, the immunogold-labeled specimens on glass coverslips were further fixed with 1% OsO4 in PBS for 20 to 30 min at 4°C, rinsed with double-distilled water (ddH2O) three times for 5 min each time, silver enhanced with Aurion R-Gent solution (Electron Microscopy Sciences) for 30 min, rinsed with ddH2O five times for 2 min each time, and dehydrated with an ethanol series from 60% to 100% for 10 min. Thereafter, samples were dried using an ethanol-CO2 critical point dryer, mounted on aluminum stubs (Electron Microscopy Sciences) with silver paint, and carbon coated.
(ii) Protocol 2.
Following postfixation with glutaraldehyde, the samples were further fixed by a method known as OTO (treated with 1% OsO4 in PBS for 30 min, rinsed with PBS, treated with 3% thiocarbohydrazide in ddH2O for 15 min, rinsed with ddH2O, treated with 1% OsO4 in ddH2O for 30 min, and finally rinsed with ddH2O) (44). Samples were silver enhanced using Aurion R-Gent solution (Electron Microscopy Sciences) for 30 min if ultrasmall beads were used, dehydrated in a graded ethanol series (25%, 50%, 75% for 15 min, 100% twice for 30 min), and dried by replacing ethanol with hexamethyldisilaxane, aspirating hexamethyldisilaxane, and air drying. The dried sample coverslips were then mounted on aluminum stubs (Electron Microscopy Sciences) with silver paint and coated with carbon before viewing.
Pelleted cellular material was resuspended and disrupted in a small volume of PBS by repeated pipetting; one drop of the suspension was placed onto a poly-l-lysine-treated glass coverslip in a cell culture plate, diluted with 0.25 ml of PBS, and gently agitated for 2 h, to allow the suspended material to attach to the coverslip. The coverslips were then fixed with 4% glutaraldehyde in 0.1 M sodium cacodylate (pH 7.4) for 15 min and then processed by protocol 2, with one difference: new solutions were applied slowly by pipette and old solutions were removed slowly by pipette in an effort to not dislodge bound material.
Sample preparation for TEM.
The following protocol is based on a method by Muraki et al. (31). After fixation with glutaraldehyde, the six-well plates containing the infected-cell monolayers were immersed in 1% OsO4 in PBS for 30 min, rinsed, immersed in 2.5% uranyl acetate in ddH2O for 30 min, and rinsed again with ddH2O. The samples were dehydrated in a graded ethanol series, and then the ethanol was exchanged for Epon in a series of steps. The embedded Epon was polymerized by baking at 60°C for 24 h. Subsequently, the six-well plate was broken up, and the fragments containing Epon-embedded cells were mounted on stubs before cutting with a Reichert Ultracut EI microtome into 90-nm sections. The sections were stained with 10% uranyl acetate in ddH2O for 5 min, rinsed, dried, and then stained with 0.1% lead citrate in ddH2O for 5 min. Following rinsing and drying, the grid was imaged on a TEM.
Sample preparation for epipolarized microscopy.
Infected and uninfected MeWo cells were cultured and processed as for SEM protocol 1 with the following modifications. Following fixation with 2% glutaraldehyde in sodium cacodylate buffer, samples were washed with PBS and ddH2O. Samples were protected from light and silver enhanced using Aurion R-Gent (Electron Microscopy Sciences). Following dehydration in a graded ethanol series, the coverslips were stained using a standard hematoxylin-eosin method. Stained samples were mounted on glass slides for viewing in a digital light microscope.
Imaging methods.
Fluorescent confocal microscopic images were taken on a Zeiss 510 microscope. A Leitz-Diazplan microscope was required to obtain epifluorescence images. SEM images were obtained on a Hitachi S-4800 FE-SEM. The Hitachi electron microscopes are capable of magnifications up to ×800,000. TEM images were taken on a JEOL 1230 electron microscope. Immunostained gold beads were directly viewed in TEM images but were visible only in the backscatter image of the SEM. Backscatter refers to electrons which are elastically scattered from the atoms in the sample with almost the same energy as the incident beam (1). The SEM image is normally formed from the secondary electron signal. Secondary electrons are those that are inelastically scattered from the sample and return to the detector with much less energy than the incident beam. The secondary electron signal is most sensitive to the surface morphology, whereas the backscatter image is most sensitive to atomic number. The Hitachi S-4800 FE-SEM microscope automatically produces an image that is a mixture of the backscatter signal and secondary electron signal.
RESULTS
Imaging of uninfected and infected MeWo cells.
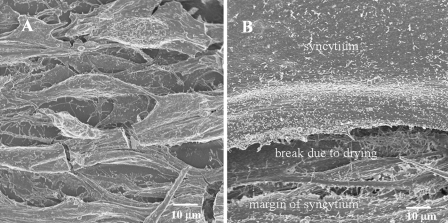
Because of the increased resolution facilitated by the latest SEM technology, we first examined the topography of uninfected cells. At a low magnification (Fig. 1A), uninfected MeWo cells were mostly elongated, ranging between 10 and 20 μm in width and from 100 to 200 μm in length. Cell projections of various lengths and uniform sparse distribution were detected in a pattern similar to that described in an earlier report from this laboratory (18). With the newer instrumentation, moreover, we determined that these projections were 100 to 200 nm in width and up to 1 μm in length. Additionally some MeWo cells had low flat projections that resembled lamellipodia. A small percentage of MeWo cells were rolled into a spherical shape. One such example can be seen in the upper right hand corner of Fig. 1A. Overall, the cell surface appeared corded but looked smooth at a finer scale.
FIG. 1.
SEM images of uninfected and VZV-infected cells. (A) Uninfected monolayer with approximately 10 MeWo cells; (B) infected MeWo cells that have fused into a syncytium. Note that the drying process for SEM imaging leads to cell shrinkage and occasional breaks in the monolayer. In panel B, the margin of syncytium is visible near bottom of the image; above it is a wide break in the syncytial surface due to drying. The samples were prepared for viewing using protocol 2 (see Materials and Methods).
Human melanoma cells are highly susceptible to VZV infection (10, 11), an exception to the rule that primary embryo cells are the preferred VZV cell substrate. Infected cultures develop multinucleated cells (polykaryons) resulting from the fusion of the cell membranes (41); these large flat syncytia occasionally were hundreds of micrometers in diameter. A recently fused MeWo cell can be seen in Fig. 1B. By 72 hpi, a typical MeWo cell culture was 70% syncytial, indicating that the infection had spread widely.
Imaging of viral highways.
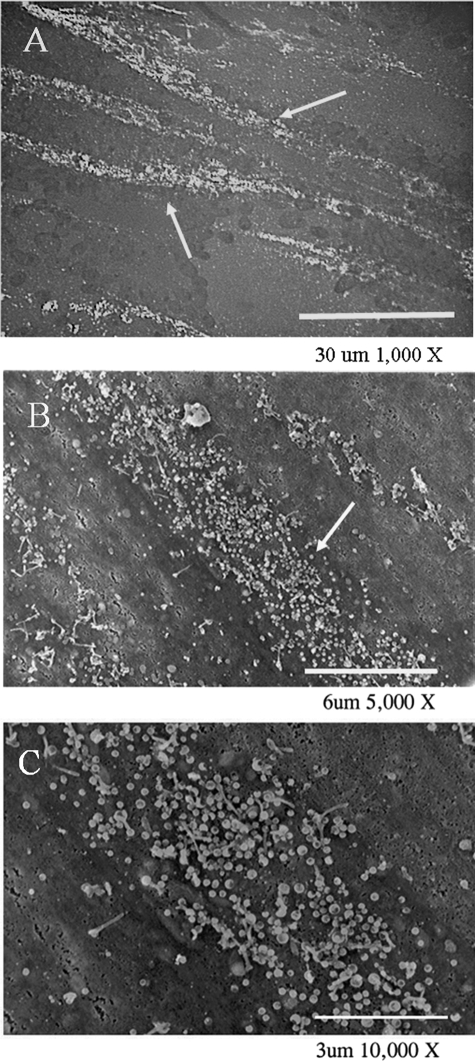
One hallmark of a VZV infection is its pattern of egress (35). Typical viral highways at increasing levels of resolution are illustrated in Fig. 2. In an epifluorescence image (Fig. 2A), several viral highways were spread in parallel across the syncytial surface. Figure 2B and C are SEM images that demonstrate that a viral highway is often 3 to 6 μm in width and up to 100 μm in length. The images also showed that a highway was composed of viral particles. In comparison, HSV-1 virion egress typically occurs in a widespread, diffuse pattern across the surface of an infected cell, covering the entire surface by 48 hpi (36).
FIG. 2.
Typical patterns of VZV viral highways. (A) Epifluorescent microscopic image of two major highways (white arrows) and lesser highways immunostained by mouse MAb 3B3; (B and C) SEM images of viral highways (white arrows) at increasingly high magnifications, to document their width and the relative number of particles. Highways formed only in areas of the monolayer that were already fused, as evidenced by the lack of any detectable individual cells. The SEM samples were prepared for viewing using protocol 1 (see Materials and Methods).
Microstructural composition of VZV viral highways.
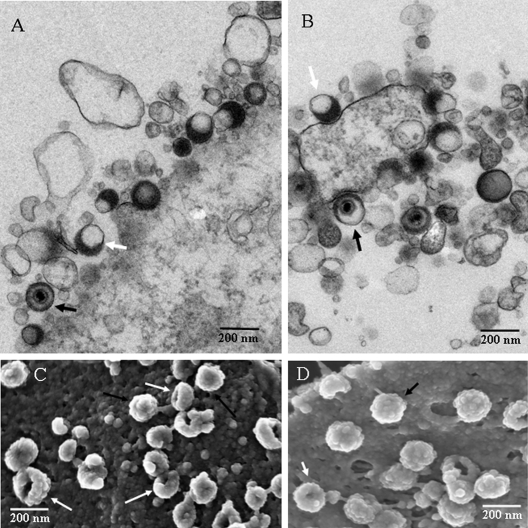
Examination of numerous high-resolution TEM and SEM images of VZV viral highways demonstrated that a viral highway was composed of viral particles and long cellular projections. While the aberrancy of VZV particles has long been noticed, the appearance of each particle type in TEM and SEM images had never been compared in detail. Therefore, a combination of complementary TEM and SEM images of typical virus particles was assembled (Fig. 3). Figure 3A and B are TEM images showing both complete and aberrant forms of VZV. For example, Fig. 3A shows 10 total viral particles, of which only one shows a capsid with DNA; two others show a density suggestive of a core, while the remaining seven are coreless. Eight viral particles can be seen in Fig. 3B, of which three appear to have a core while the rest do not. In the SEM images, we typically observed groups of complete and aberrant VZV particles together on the cell surface (Fig. 3C and D). The aberrant forms often exhibited an indentation or a gap in their surface structure. Both complete and aberrant forms were 150 to 200 nm in diameter and had similar knobby exteriors (resembling a raspberry). The indentation or gap in the aberrant forms was found to be randomly oriented. For example, the gaps in the aberrant forms in Fig. 3D were sometimes turned outward and sometimes turned sideways. All viral particles, complete or aberrant, appeared to be connected to the cell surface. After extensive comparisons of 600 TEM and SEM images, we concluded that the aberrant particles seen by SEM were the same as the coreless particles frequently seen by TEM. Presumably, the coreless VZV particles collapsed inward as the SEM sample was dried, leaving gaps or indentations in the envelope.
FIG. 3.
Comparison of VZV particles by TEM (A and B) and SEM (C and D.) In all panels, black arrows indicate complete viruses and white arrows indicate aberrant particles; not all particles are indicated. (A) Seven VZV particles were visible, of which one was a complete virus. Most were envelopes without capsids. (B) Seven particles were visible, of which two contained capsids. Many particles in the TEM images were smaller than a full particle because the section was taken off center. (C) Sixteen particles were visible; the majority were aberrant. (D) Thirteen viral particles were visible, of which half were aberrant. The SEM samples were prepared for viewing using protocol 2 (see Materials and Methods).
We also counted complete and aberrant viral particles in several TEM images at 72 and 96 hpi. Under the conditions of infection in this study, very few surface particles were seen at 48 hpi. At 72 hpi, 744 surface particles were counted, and 561 were coreless (75%). At 96 hpi, complete viral particles composed only 15% of the 554 particles counted. Otherwise stated, 85% of the surface particles were coreless when cytopathic effect was very advanced.
Density gradient sedimentation of viral particles.
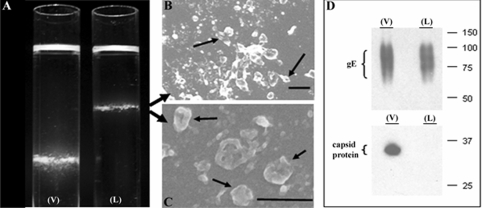
Given this similarity to HSV L particles (40, 47), we proposed calling the VZV aberrant particles VZV L particles. To further establish this designation, we repeated density sedimentation experiments performed previously by this laboratory (18). In that earlier study, we added infected-cell lysate to a potassium tartrate density gradient and measured the infectivity of individual fractions after sedimentation; we found a lower band that contained prototypical infectious particles. However, we never examined an upper band because it contained no infectivity. In this repeat sedimentation, we examined the upper band by negative-staining SEM and observed clearly recognizable L particles but no complete virions (Fig. 4). To further verify that VZV capsids were not present in the aberrant particles in the upper band, we carried out immunoblotting of both bands, using MAb 251D9 against a minor capsid protein as well as MAb 3B3 against the envelope gE glycoprotein (5). As shown in Fig. 4D, capsid protein was detected in the lower band, known to contain complete infectious virions, but not in the upper band, which contained aberrant particles. As expected, the gE envelope protein was found in both upper and lower bands.
FIG. 4.
Density gradient sedimentation of VZV particles. (A) Photograph of the bands after second sedimentation in 16- by 102-mm Beckman tubes; V, lower viral band; L, upper L-particle band. (B and C) Negative-staining SEM images of the upper band from the L tube, showing aberrant particles. (D) Immunoblot of bands from both tubes with anti-gE antibody and anticapsid protein antibody. Note the absence of detectable VZV capsid protein in the upper (L) band. Scale bars: panel B, 200 nm; panel C, 400 nm.
Imaging of projections in VZV viral highways.
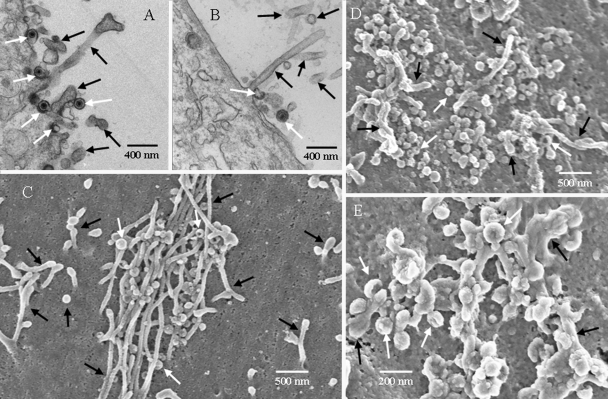
Because of our refined fixation technique and more advanced imaging technology, we observed for the first time that viral highways were composed of virus particles in combination with enhanced cellular projections, rather than viruses alone, as had been previously assumed (Fig. 5). The projections were observed to be approximately 100 nm in diameter and several micrometers in length. Typically, we saw projections that grew perpendicularly to the plasma membrane and then extended in all directions. Some appeared to be parallel to the plasma membrane. By TEM, we observed that viral particles frequently egressed in the vicinity of a projection (Fig. 5A and B). But the TEM images failed to adequately document the large number of projections in the viral highway. In contrast, by SEM, an abundant number of projections were readily detectable on the infected-cell surface within the viral highway (Fig. 5C). Outside the viral highway, the projections were remarkably reduced in number, similar to the small number seen in uninfected MeWo cells. Within individual viral highways, the ratio of viral particles to projections was highly variable. In some highways, viral particles predominated (Fig. 5D), while in other highways, the projections were more common (Fig. 5C). The latter panel likely represents an earlier focus of egress, while the former panel represents a more mature focus of egress. In some highways, viruses were intimately attached to twisted projections (Fig. 5E). Because of poorer resolution with older SEM technology, we did not fully appreciate the detailed surface structures in an earlier study (18).
FIG. 5.
Microstructural composition of the viral highways. The viral highways included complete and aberrant viral particles (white arrows) and cellular projections (black arrows). The images show that the long cellular projections were 70 to 100 nm in diameter. (A and B) TEM images; (C to E) SEM images. (A) Five viral particles and several projections; (B) one elongated projection surrounded by portions of other projections; (C) viral highway covered by cellular projections with viral particles in between; (D) viral highway with predominantly viral particles and a few projections; (E) viral highway with projections that were closely intermingled with viral particles. Several viral particles were attached to the projections. The SEM samples were prepared for viewing using protocol 2 (see Materials and Methods).
Imaging of actin in the viral highway.
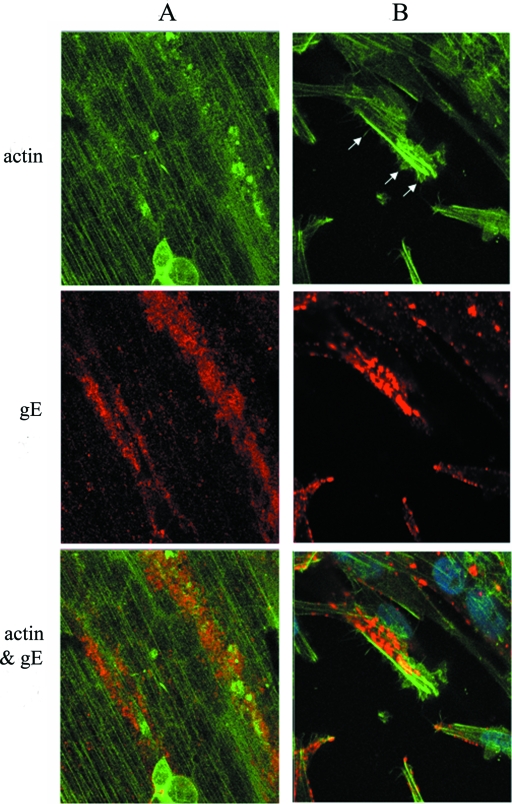
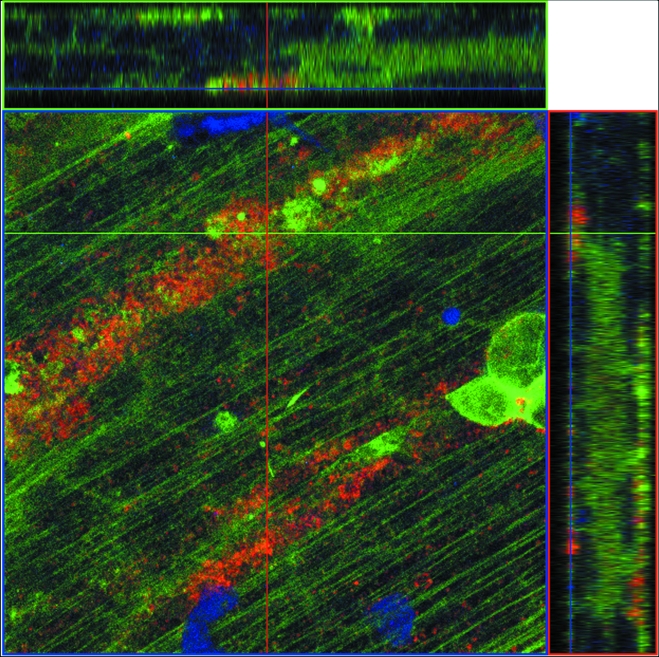
To determine the structural core of the cellular projections, we permeated and immunostained an infected-cell monolayer with phalloidin for F-actin localization and MAb 3B3 for VZV gE localization, and we examined the sample with confocal fluorescence microscopy at ×630 and ×1,000 magnifications. When the samples were examined in a z stack of 18 overlapping optical sections, actin staining was detected in an ordered pattern within the cytoplasm across the whole syncytium (Fig. 6). VZV gE, however, stained in a linear pattern along the viral highway. Within the viral highway, the actin staining pattern was occasionally less ordered. To further verify the colocalization of F-actin and VZV gE within the viral highway, two side cuts through the z-stack optical sections were generated, one in the xz plane and the other in the yz plane (Fig. 7). Within these side cuts, VZV gE was found at the surface together with F-actin. Immunoreactivity for gE did not continuously extend into the cytoplasm. Altogether, these results suggested that the projections were actin based. For reasons described in greater detail in Discussion, we have called these projections filopodia.
FIG. 6.
Identification of F-actin in the viral highway. Infected monolayers were stained with phalloidin (green) and anti-gE MAb (red) before imaging by confocal microscopy. Two images were obtained in different areas of the infected monolayer (A and B). (A) VZV gE and F-actin colocalized along a viral highway oriented along the terminal web stained by F-actin. Multinucleated syncytia are visible in the infected monolayer. (B) VZV gE and F-actin staining of infected MeWo cells showing cellular projections (white arrows) stained for F-actin. In order to best show the projections, a cell that was not adjacent to another cell was selected.
FIG. 7.
Colocalization of F-actin and VZV gE on the cellular surface. Cross-sectional views of actin (green) and gE (red) were visualized in a combined image by confocal microscopy. The central image is in the xy plane. The top image is a cross-section in the xz plane along the green line. The right-side image is a cross section in the yz plane along the red line. Eighteen overlapping 1-μm slices were taken in the z direction. The two cross-sectional images revealed that the gE staining was localized on the cellular surface.
Imaging of gE in the filopodia.
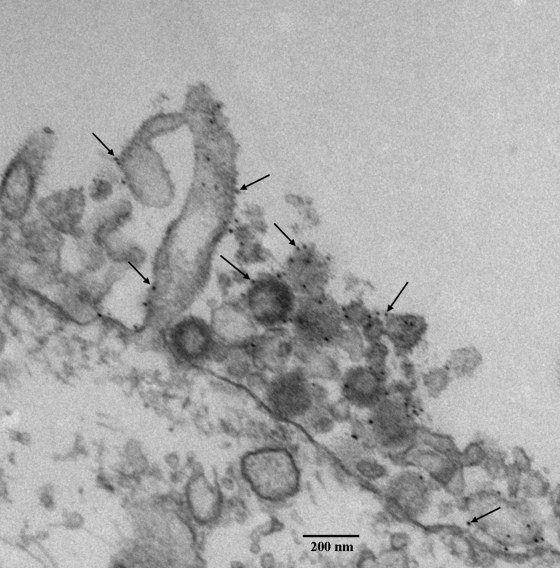
VZV gE is the most abundant glycoprotein in the VZV envelope and contains motifs for intracellular trafficking (14, 30, 34, 49). As such, it continues to be a reliable target for immunolabeling followed by examination with electron microscopy. After visualization of an infected-cell monolayer at 72 hpi, we observed gold beads bound to gE on viral particles and also virus-induced filopodia (Fig. 8). The viral particle cross-sections showed fewer than 10 beads, while there were only one or two beads per 100 nm of length in a filopodium. Some beads were closely associated, which was suggestive of a gE complex.
FIG. 8.
Detection of VZV gE in the viral highway by electron microscopy. An infected monolayer was labeled with mouse MAb 3B3 and 10-nm gold beads. The attachment of gold beads to viral particles and filopodia was documented by TEM imaging. Note the absence of a viral particle within the elongated cellular projection.
In control experiments during this study as well as earlier studies from this laboratory, we have consistently shown that binding of the VZV gE mouse MAb 3B3 is highly specific; i.e., the antibody did not bind to uninfected cells (25, 30, 33, 34, 42). Neither did the secondary antibody (data not shown).
High-resolution imaging of gE, gI, and gB on the VZV particles.
After determining that gE was present on the filopodial constituents of the viral highways, we investigated the prevalence of gE in viral particles. We also investigated the presence of gI in viral particles because gI frequently forms a complex with gE during biosynthesis in the Golgi. In addition, we investigated a third VZV glycoprotein gB, because gB is the second most abundant VZV glycoprotein in VZV-infected cells.
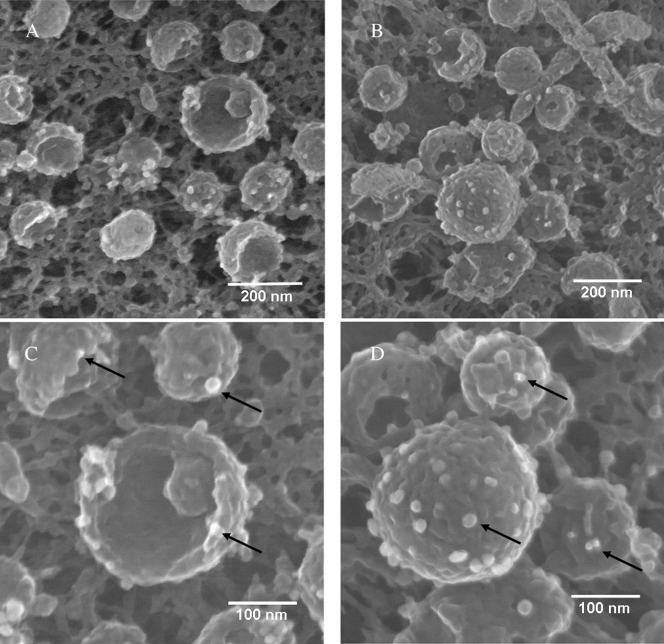
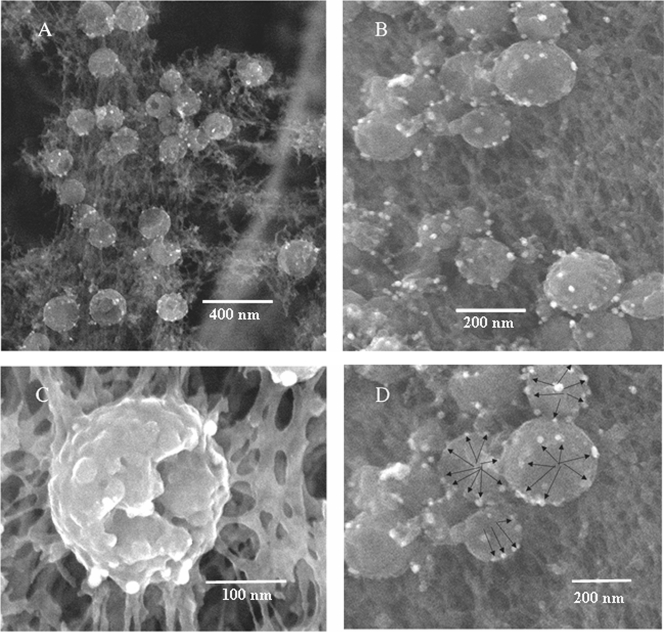
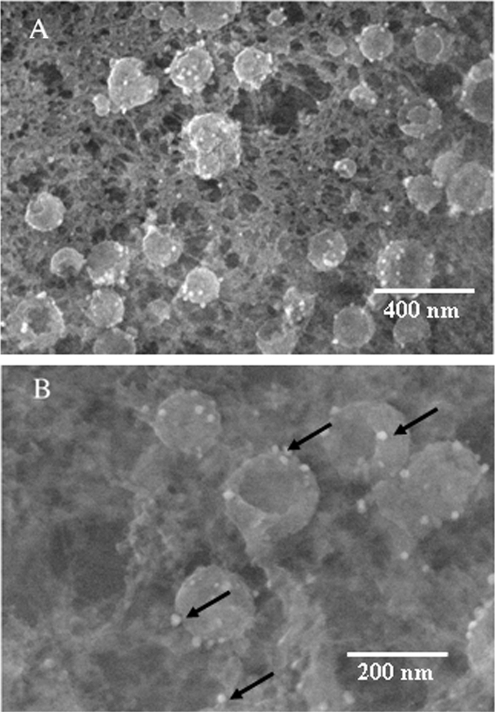
By increasing the magnification in SEM images, it was possible to resolve individual gold beads on a single virus particle. We examined samples at ×100,000 for gE (Fig. 9), gI (Fig. 10), and gB (Fig. 11) labeled by backscatter from gold beads. VZV gI forms a complex with gE that is a biologically active human Fc receptor (27, 28). It is reasonable to assume that gE and gI form a complex in the viral envelope. VZV gE and gI immunolabeled very similarly (compare Fig. 9 and 10) in terms of number of beads per virus and extent of spread on the surface of the viral particle, which was consistent with either antibody binding to gE-gI complexes or gE and gI being equally abundant and similarly spread in the viral envelope. In one micrograph, the gold beads bound to gI appeared predominantly at the rim of the indentation in the aberrant particle, although beads were seen on the surface of the complete particle as well (e.g., bottom of Fig. 10B). On the other hand, gB beads were less frequently observed then either gE or gI beads (Fig. 11). Such an observation may be due to fewer gB glycoproteins on a viral particle or to lower antibody affinity. For all three immunolabels, we observed no significant differences in labeling between complete and aberrant envelopes.
FIG. 9.
Detection of VZV gE on viral particles by electron microscopy. Samples were immunolabeled with MAb 3B3 and silver-enhanced ultrasmall gold beads and visualized by SEM. Arrows indicate gold beads. Not all beads are indicated. (A) Twelve viral particles with four or five beads each. (B) Thirteen particles with four or five beads each; the large complete particle in the middle has fourteen beads. (C) Enlargement of panel A with beads on three particles. (D) Enlargement of the large particle in panel B to further delineate the gold beads labeling gE. The immunolabeled samples in this figure and subsequent figures were prepared for viewing using protocol 1 (see Materials and Methods).
FIG. 10.
Detection of VZV gI on viruses by electron microscopy. Samples were immunolabeled with mouse MAb 6B5 and silver-enhanced ultrasmall gold beads and visualized with SEM. Arrows indicate gold beads. Not all beads are indicated. (A) Twenty-five particles, each with beads. (B) Fourteen particles with four or six beads each. (C) Enlargement of a single viral particle with ten beads surrounding a gap in the envelope. (D) Enlargement of panel B, to show that beads were often visualized around the circumference of an indentation in the envelope.
FIG. 11.
Detection of VZV gB on viruses by electron microscopy. Samples were immunolabeled with human MAb V1 and silver-enhanced ultrasmall gold beads and visualized by SEM. Arrows indicate gold beads (not all beads are indicated). (A) Twenty viral particles, all of which had beads. (B) Enlargement of several viral particles. Each particle contained three or four beads.
Effect of antibody choice and gold bead size on gE immunolabeling efficiency.
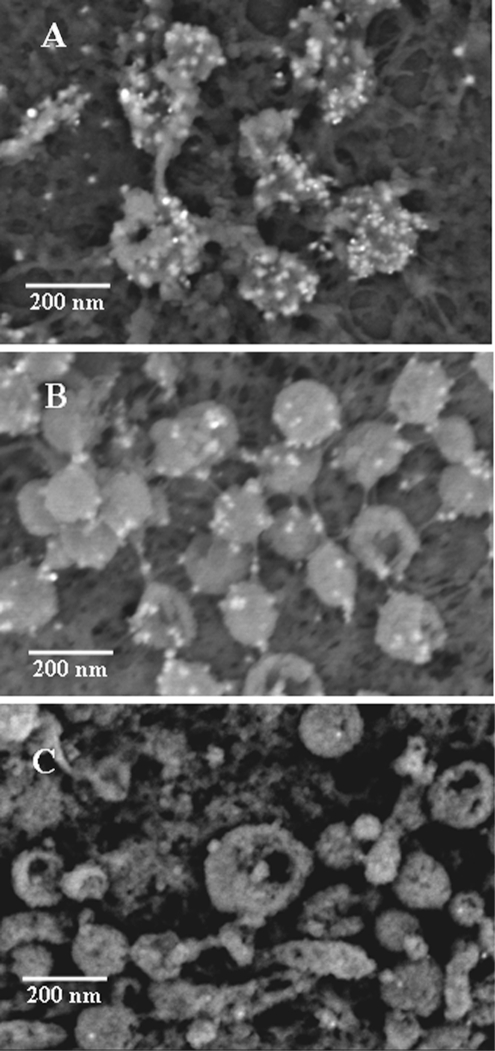
Immunolabeling is generally used to determine the absence or presence and/or spatial location of labeled objects. The ability to detect individually labeled gE proteins on the virus envelope in high-resolution SEM images provides an opportunity to count labels and estimate the number of gE proteins on a VZV. However, the number of labeled proteins depends upon the affinity of the primary antibody for gE as well as the binding of the secondary antibody to the primary antibody. We observed differences when different primary antibodies were used and when beads of different sizes were used (Fig. 12). For example, human MAb V2 labeled gE in a pattern similar to that of mouse MAb 3B3 but was roughly twice as numerous. As anticipated, labeling with a 10-nm gold bead instead of an ultrasmall bead decreased binding by 3 or 4 times, presumably because the conjugate containing the larger bead bound less avidly. All of the images, but particularly the ultrasmall-bead images, showed backscatter signals that varied in density and brightness. All signals corresponded to gold beads, but the more diffuse signals corresponded to beads that were buried in the molecular structure (24). Presumably electrons scattered off nearby atoms as they rebounded toward the detector, thus diffusing the signal.
FIG. 12.
Effect of primary antibody and gold bead size on VZV gE as seen in backscatter images. (A) Imaging of human MAb V2 and ultrasmall gold beads, showing 10 viral particles with numerous gold beads. (B) Imaging of mouse MAb 3B3 with ultrasmall gold beads, showing 24 viral particles labeled by fewer gold beads than in panel A. (C) Imaging of mouse MAb 3B3 with 10-nm gold beads, showing 12 viral particles with fewer gold beads than in either panel A or B.
Enumeration of gold beads on a viral particle.
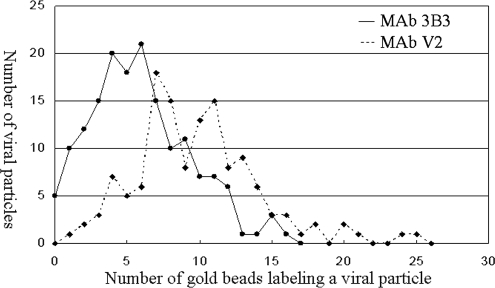
We next counted the number of viral particles (including L particles) with a given number of immunolabeled ultrasmall gold beads, after treatment with mouse MAb 3B3 or human MAb V2. Altogether, we counted beads on 296 viral particles in 22 images (Fig. 13). The plot shows that the number of mouse MAb 3B3 beads on a particle ranged from 0 to 16, with a maximum in the distribution of 5 beads/particle and an overall average of 5.9 beads/particle. The number of human MAb V2 beads on a particle ranged from 5 to 26, with a maximum in the distribution of 8 beads/particle and an overall average of 9.8 beads/particle. In general, we observed a similar number of beads on VZV L particles and complete VZV virions.
FIG. 13.
Number of VZV viral particles with a given number of gold beads. Two separate monolayers were immunolabeled, one with mouse MAb 3B3 (circles) and one with human MAb V2 (diamonds). After immunogold labeling, beads in SEM images were counted.
High-resolution imaging of multimeric gE forms on a virus.
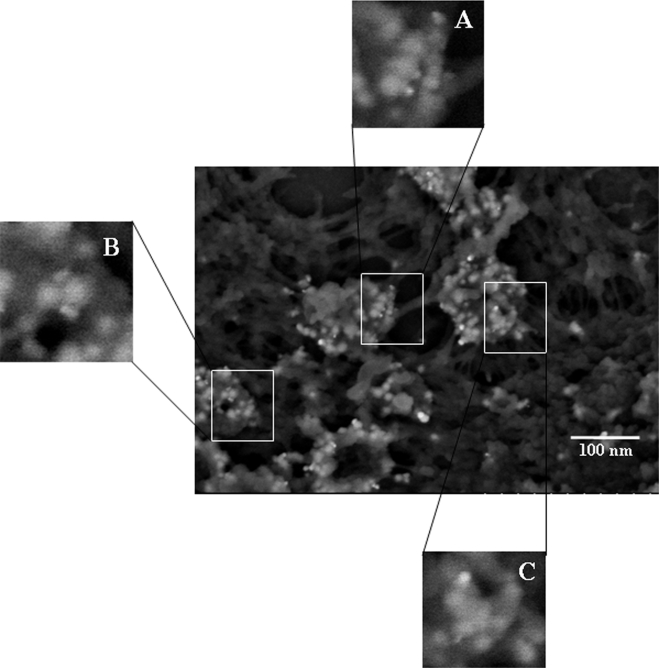
As mentioned above, we discovered small but reproducible differences dependent on the antibody selected for immunolabeling. In particular, human MAb V2 bound well enough that local gE structures were visible on the surfaces of viruses (Fig. 14). Figure 14A shows a number of spherical objects with attached gold beads. In particular, the panel shows two objects that are approximately 10 nm in diameter, each with an attached gold bead; in addition, there may be a third object behind the other two. The diffuse backscatter signal from the 10-nm spheres suggested that at least one gold bead was buried within. Assuming that human MAb V2 binds to a single epitope in gE, we proposed that the structures represented a gE dimer arranged head to tail. Given this proposal, Fig. 14A shows two gE dimers arranged in parallel; Fig. 14B shows two gE dimers arranged in antiparallel fashion, while Fig. 14C shows a more complex structure of gE dimers (four or more). Such images demonstrated that gE was not randomly distributed in the viral envelope but instead formed local structures by combining with itself and presumably gI. Dimeric forms of gE have previously been demonstrated in immunoblotting experiments from this laboratory (33).
FIG. 14.
Multimeric structure of VZV gE. Infected cells were labeled with human MAb V2 and observed in high-resolution SEM images. Each panel showed envelope structures labeled by compact and diffuse signals of backscatter, indicating gE dimers. (A) Two gE dimers arranged in parallel; (B) two gE dimers arranged antiparallel; (C) multiple gE dimers arranged in a cluster.
DISCUSSION
The goal of the present project was to determine if aberrant viral structures can account in part for the low VZV titer. The present study was greatly facilitated by advances in high-resolution imaging technology. The SEM provides the ability to achieve a three-dimensional image that aids in evaluating and understanding the structure, appearance, and distribution of viral particles (20, 21). Our results unexpectedly demonstrated that a typical viral highway is composed of a high percentage of aberrant particles as well as virus-induced projections. These results raised three major discussion points: (i) how VZV aberrant particles compare with HSV L particles, (ii) the relationship between virus-induced projections and egressed viral particles, and (iii) the glycoprotein content of a surface viral particle. Each of these points is addressed below.
L particles.
The discovery of L particles is the most important observation in this report. Earlier studies by TEM consistently demonstrated that many progeny VZV particles are aberrant in formation and are therefore defective and noninfectious (reviewed by Nii [32]). Photomicrographs published by Cook and Stevens (2, 3) and later by Gershon et al. (8) illustrated disrupted capsids as well as open envelopes. Cook and Stevens compared micrographs of VZV and HSV at different stages in the process of leaving the cell. In cytoplasmic vacuoles, most HSV virions were enveloped, while VZV particles were much more pleomorphic, an observation that we confirmed (22). Although it has been suggested that processing the samples for electron microscopy causes the aberrancy, we suggest in this report that the processing itself has revealed the fact that most surface particles lack a capsid. First, we found that the number of aberrant particles in the viral highways did not vary considerably whether counted by a SEM protocol or a TEM protocol. Secondly, Padilla et al. used very similar SEM processing methodology and saw little aberrancy in the HSV particles that were imaged (35). This result suggested that the degree of aberrancy in VZV particles was a consequence of a viral assembly problem within the cell and not an artifact of sample processing. The density gradient sedimentation data strongly supported this conclusion.
After a review of the data in this report as well as prior published studies of viral structures (40, 47), we postulated that the majority of aberrant VZV particles most closely resembled L particles. HSV L particles are envelopes that lack a capsid containing viral DNA. Studies with HSV temperature-sensitive mutant viruses, which exhibit difficulty in transferring capsids from nucleus to the cytoplasm, established the fact that L particles were produced in the cytoplasm to the same extent as enveloped virions in cells infected with wild-type virus (40). The HSV study did not investigate the glycoprotein composition of the HSV L particle. We previously reported that a majority of VZV capsids within the nucleus are aberrant and never enter the cytoplasm (13). This latter result may explain in part the relative lack of DNA-containing capsids in the cytoplasm available for VZV envelopment. The increasingly high number of L particles at 96 hpi may also explain the phenomenon noted for decades that the titer of a VZV-infected monolayer is actually lower at 96 hpi than at 72 hpi (12).
Virus-induced filopodia.
In this report, we include several micrographs showing actin-based projections in the viral highways. We concluded that these structures resembled filopodia in size and distribution. In the past, we did not observe such projections with the same frequency. At that time, we had less sophisticated SEM technology. Further, we have discovered that our previous SEM fixation process was overly stringent with regard to lipids; i.e., when comparing recent micrographs with older micrographs, we were removing some of the lipid bilayer covering the filopodia. The current SEM fixation method (summarized as “less washing but more osmium tetroxide fixation”) better preserved filopodial structure and revealed their abundance within the viral highway on the surface of VZV-infected cells. The virus-induced filopodia that we observed were virtually identical in appearance to those observed in a prior report about filopodia in virus-infected cells (26). Viruses such as murine leukemia virus and vesicular stomatitis virus were observed to travel along the filopodial surface to uninfected cells in a process called “surfing.” It is important to note that surfing implies that viral particles travel along the exterior of the filopodia.
Another report described the interactions of pseudorabies virus (PRV) with virus-induced cellular projections (4). In that study, the authors reported that the PRV serine kinase (US3) protein stimulates the growth of both long and thick (1 to 2 μm in diameter) projections as well as smaller, thinner projections on the surface of an infected cell. The authors further reported that PRV particles moved in a bidirectional fashion inside the larger surface projections, with preferential movement toward the tip. In our study, we did not observe the larger surface projections in VZV-infected cells, but we obviously observed the smaller projections. We documented that VZV particles frequently emerged at the base of projections, but particles were never found within a projection. We also occasionally observed VZV particles on the exterior of filopodia (see, for example, Fig. 5). Such particles were randomly distributed along the projections in a pattern possibly resembling the surfing mode of spread. The VZV observations were based on an examination of over 600 TEM and SEM images (21a).
Enumeration of viral glycoproteins.
Investigations aimed at quantifying the number of HSV-1 glycoproteins have measured protein content in purified viruses. One study was carried out by Handler et al. (17), who looked at glycoprotein concentrations in two strains of HSV-1. Purified virions were subjected to chemical cross-linkers to detect glycoprotein oligomeric forms in the viral envelope, and purified glycoproteins were measured against standards to calculate molar ratios of glycoproteins. Extrapolation of their results suggested a total of 20,000 glycoprotein molecules in each viral envelope. In contrast to this assessment, researchers using cryotomography determined a high-resolution structure of HSV-1 that contained 565 glycoprotein stalks on the virus surface (16). In a recent commentary, Steven and Spear estimated that around 800 glycoprotein stalks would be found in an HSV envelope (46). Of course, a glycoprotein stalk may be composed of multiple glycoproteins, suggesting that there are at most a few thousand glycoproteins in the HSV-1 envelope. Related to this point is a geometric argument. A viral particle 150 nm across has an approximate surface area of 4π(75 nm)2, or 70,686 nm2. Assuming 145 Å3 per residue (39), a glycoprotein with 550 residues in its extracellular domain has a volume of 80 nm3 or a diameter of 5 nm. Further assuming that the entire surface is tightly packed, a few thousand glycoproteins would fit on the surface. Since an actual envelope includes sugar groups and other constituents besides the glycoproteins, perhaps a more realistic number is indeed the previously mentioned value of 800.
Can one derive a lower limit to glycoprotein content per virion from TEM and SEM images? TEM images show a narrow slice of a viral particle, while SEM images show one half of the viral particle. Both are limited by antibody affinity. SEM involves a drying step that may lead to gold beads being buried in the overall structure of the microenvironment. Recently, Skepper et al. (45) measured the amount of gD on extracellular HSV virions by TEM and reported 2.1 gold particles per virion. This result is similar to a value of 12 to 16 gD-specific gold particles observed per HSV virion using SEM methods similar to those described for VZV in this report (32), particularly since the former value is from TEM and the latter from SEM. A study by Posthuma et al. (38) found labeling efficiencies of roughly 10% for known concentrations of amylase in gelatin blocks. For a SEM value of 12 to 16 gD-specific gold particles, the number would imply an overall content of 240 to 320 gD molecules per HSV-1 virus. This value is more in line with the cryotomography result. Our SEM results for gE on VZV particles found 6 gold beads per virus particle using mouse MAb 3B3 and 10 gold beads per virus particle for human MAb V2. Using similar computations, we obtained a lower limit for gE content of 120 to 200 molecules per virus particle.
In summary, we have found through examination of VZV-infected cells with several imaging technologies that VZV viral highways are composed of numerous virus-induced projections interspersed with mainly aberrant viral particles. Aberrant L particles that lack a core capsid comprise a majority (75 to 85%) of all egressed particles. Such a low efficiency in infectious particle production may partly explain the low VZV titers observed for many decades by many different laboratories. The high number of L particles also implies a disassociation between events related to capsid formation in the nucleus and subsequent envelopment processes in the cytoplasm of VZV-infected cells.
Acknowledgments
This research was supported by NIH grant AI22795.
We acknowledge earlier improvements in microscopy methodology developed by Jorge Padilla, which facilitated completion of the present project. We thank the members of the University of Iowa Central Microscopy Research Facility for their assistance.
Footnotes
Published ahead of print on 9 January 2008.
REFERENCES
- 1.Bozzola, J. J., and L. D. Russell. 1992. Electron microscopy. Jones and Bartlett Publishers, Boston, MA.
- 2.Cook, M. L., and J. G. Stevens. 1968. Labile coat: reason for non-infectious cell-free varicella-zoster virus in culture. J. Virol. 21458-1464. [DOI] [PMC free article] [PubMed] [Google Scholar]
- 3.Cook, M. L., and J. G. Stevens. 1970. Replication of varicella-zoster in cell culture: an ultrastructural study. J. Ultra. Res. 32334-350. [DOI] [PubMed] [Google Scholar]
- 4.Favoreel, H. W., G. Van Minnebruggen, D. Adriaensen, and H. J. Nauwynck. 2005. Cytoskeletal rearrangements and cell extensions induced by the US3 kinase of an alphaherpesvirus are associated with enhanced spread. Proc. Natl. Acad. Sci. USA 1028990-8995. [DOI] [PMC free article] [PubMed] [Google Scholar]
- 5.Friedrichs, W. E., and C. Grose. 1986. Varicella-zoster virus p32/p36 complex is present in both the viral capsid and the nuclear matrix of the infected cell. J. Virol. 57155-164. [DOI] [PMC free article] [PubMed] [Google Scholar]
- 6.Gamliel, H., and A. Polliack. 1983. The use of scanning immuno-electron microscopy to detect surface membrane immunoglobins and antigens on normal and leukemic human leukocytes: current status. Scan. Electron Microsc. 1983929-938. [PubMed] [Google Scholar]
- 7.Gamliel, H., M. Steinitz, Z. Neeman, and A. Polliack. 1983. Scanning immuno-electron microscopy of a monoclonal, Epstein-Barr virus (EBV) transformed human cell line producing rheumatoid factor in vitro. SEM, Inc., O'Hare, IL. [PubMed]
- 8.Gershon, A., L. Cosio, and P. A. Brunell. 1973. Observations on the growth of varicella-zoster virus in human diploid cells. J. Gen. Virol. 1821-31. [DOI] [PubMed] [Google Scholar]
- 9.Gonda, M. A., R. V. Gilden, and K. C. Hsu. 1979. Immunologic techniques for the identification of virion and cell surface antigens by correlative fluorescence, transmission electron and scanning electron microscopy. SEM, Inc., O'Hare, IL. [PubMed]
- 10.Grose, C. 1980. The synthesis of glycoproteins in human melanoma cells infected with varicella-zoster virus. Virology 1011-9. [DOI] [PubMed] [Google Scholar]
- 11.Grose, C., and P. A. Brunell. 1978. Varicella-zoster virus: isolation and propagation in human melanoma cells at 36 and 32 degrees C. Infect. Immun. 19199-203. [DOI] [PMC free article] [PubMed] [Google Scholar]
- 12.Grose, C., D. P. Edwards, W. E. Friedrichs, K. A. Weigle, and W. L. McGuire. 1983. Monoclonal antibodies against three major glycoproteins of varicella-zoster virus. Infect. Immun. 40381-388. [DOI] [PMC free article] [PubMed] [Google Scholar]
- 13.Grose, C., R. Harson, and S. Beck. 1995. Computer modeling of prototypic and aberrant nucleocapsids of varicella-zoster virus. Virology 214321-329. [DOI] [PubMed] [Google Scholar]
- 14.Grose, C., W. Jackson, and J. A. Traugh. 1989. Phosphorylation of varicella-zoster virus glycoprotein gpI by mammalian casein kinase II and casein kinase I. J. Virol. 633912-3918. [DOI] [PMC free article] [PubMed] [Google Scholar]
- 15.Grose, C., D. M. Perrotta, P. A. Brunell, and G. C. Smith. 1979. Cell-free varicella-zoster virus in cultured human melanoma cells. J. Gen. Virol. 4315-27. [DOI] [PubMed] [Google Scholar]
- 16.Grunewald, K., P. Desai, D. C. Winkler, J. B. Heymann, D. M. Belnap, W. Baumeister, and A. C. Steven. 2003. Three-dimensional structure of herpes simplex virus from cryo-electron tomography. Science 3021396-1398. [DOI] [PubMed] [Google Scholar]
- 17.Handler, C. G., R. J. Eisenberg, and G. H. Cohen. 1996. Oligomeric structures of glycoproteins in herpes simplex virus type 1. J. Virol. 706067-6075. [DOI] [PMC free article] [PubMed] [Google Scholar]
- 18.Harson, R., and C. Grose. 1995. Egress of varicella-zoster virus from the melanoma cell: a tropism for the melanocyte. J. Virol. 694994-5010. [DOI] [PMC free article] [PubMed] [Google Scholar]
- 19.Hatfield, C., K. M. Duus, D. H. Jones, and C. Grose. 1997. Epitope mapping and tagging by recombination PCR mutagenesis. BioTechniques 22332-337. [DOI] [PubMed] [Google Scholar]
- 20.Hiramatsu, Y., F. Uno, M. Yoshida, and S. Nii. 1999. Poxvirus virions: their surface ultrastructure and interaction with the surface membrane of host cells. J. Electron Microsc. 48937-946. [DOI] [PubMed] [Google Scholar]
- 21.Holmes, K. V. 1975. Scanning electron microscopy studies of virus-infected cells: Cytopathic effects and maturation of vesicular stomatitis virus in L2 cells. J. Virol. 15355-362. [DOI] [PMC free article] [PubMed] [Google Scholar]
- 21a.Hutchinson, J. 2007. Thesis, University of Iowa, Iowa City, Iowa.
- 22.Jones, F., and C. Grose. 1988. Role of cytoplasmic vacuoles in varicella-zoster virus glycoprotein trafficking and virion envelopment. J. Virol. 622701-2711. [DOI] [PMC free article] [PubMed] [Google Scholar]
- 23.Jongebloed, W. L., I. Stokroos, J. J. L. Van Der Want, and D. Kalicharan. 1999. Non-coating fixation techniques or redundancy of conductive coating, low kV FE-SEM operation and combined SEM/TEM of biological tissues. J. Microsc. 193158-170. [DOI] [PubMed] [Google Scholar]
- 24.Joy, D. C. 2002. SMART—a program to measure SEM resolution and imaging performance. J. Microsc. 20824-34. [DOI] [PubMed] [Google Scholar]
- 25.Ku, C. C., J. A. Padilla, C. Grose, E. C. Butcher, and A. M. Arvin. 2002. Tropism of varicella-zoster virus for human tonsillar CD4(+) T lymphocytes that express activation, memory, and skin homing markers. J. Virol. 7611425-11433. [DOI] [PMC free article] [PubMed] [Google Scholar]
- 26.Lehmann, M. J., N. M. Sherer, C. B. Marks, M. Pypaert, and W. Mothes. 2005. Actin- and myosin-driven movement of viruses along filopodia precedes their entry into cells. J. Cell. Biol. 170317-325. [DOI] [PMC free article] [PubMed] [Google Scholar]
- 27.Litwin, V., W. Jackson, and C. Grose. 1992. Receptor properties of two varicella-zoster virus glycoproteins, gpI and gpIV, homologous to herpes simplex virus gE and gI. J. Virol. 663643-3651. [DOI] [PMC free article] [PubMed] [Google Scholar]
- 28.Litwin, V., M. Sandor, and C. Grose. 1990. Cell surface expression of the varicella-zoster virus glycoproteins and Fc receptor. Virology 178263-272. [DOI] [PubMed] [Google Scholar]
- 29.Maresova, L., T. J. Pasieka, and C. Grose. 2001. Varicella-zoster Virus gB and gE coexpression, but not gB or gE alone, leads to abundant fusion and syncytium formation equivalent to those from gH and gL coexpression. J. Virol. 759483-9492. [DOI] [PMC free article] [PubMed] [Google Scholar]
- 30.Montalvo, E. A., R. T. Parmley, and C. Grose. 1985. Structural analysis of the varicella-zoster virus gp98-gp62 complex: posttranslational addition of N-linked and O-linked oligosaccharide moieties. J. Virol. 53761-770. [DOI] [PMC free article] [PubMed] [Google Scholar]
- 31.Muraki, Y., M. Yamada, M. Yoshida, S. Yamada, J. A. Padilla, Y. Hatano, Y. Hiramatsu, F. Uno, and S. Nii. 1996. Electron microscopy observations of aberrant capsids of pseudorabies virus. J. Electron Microsc. 45223-231. [DOI] [PubMed] [Google Scholar]
- 32.Nii, S. 1992. Electron microscopic study on the development of herpesviruses. J. Electron Microsc. 41414-423. [PubMed] [Google Scholar]
- 33.Olson, J. K., G. A. Bishop, and C. Grose. 1997. Varicella-zoster virus Fc receptor gE glycoprotein: serine/threonine and tyrosine phosphorylation of monomeric and dimeric forms. J. Virol. 71110-119. [DOI] [PMC free article] [PubMed] [Google Scholar]
- 34.Olson, J. K., and C. Grose. 1997. Endocytosis and recycling of varicella-zoster virus Fc receptor glycoprotein gE: internalization mediated by a YXXL motif in the cytoplasmic tail. J. Virol. 714042-4054. [DOI] [PMC free article] [PubMed] [Google Scholar]
- 35.Padilla, J. A., S. Nii, and C. Grose. 2003. Imaging of the varicella zoster virion in the viral highways: comparison with herpes simplex viruses 1 and 2, cytomegalovirus, pseudorabies virus, and human herpes viruses 6 and 7. J. Med. Virol. 70S103-S110. [DOI] [PubMed] [Google Scholar]
- 36.Padilla, J. A., F. Uno, M. Yamada, H. Namba, and S. Nii. 1997. High-resolution immuno-scanning electron microscopy using a non-coating method: study of herpes simplex virus glycoproteins on the surface of virus particles and infected cells. J. Electron Microsc. 46171-180. [DOI] [PubMed] [Google Scholar]
- 37.Peters, G. A., S. D. Tyler, C. Grose, A. Severini, M. J. Gray, C. Upton, and G. A. Tipples. 2006. A full-genome phylogenetic analysis of varicella-zoster virus reveals a novel origin of replication-based genotyping scheme and evidence of recombination between major circulating clades. J. Virol. 809850-9860. [DOI] [PMC free article] [PubMed] [Google Scholar]
- 38.Posthuma, G., J. W. Slot, and H. J. Geuze. 1987. Usefulness of the immunogold technique in quantitation of a soluble protein in ultra-thin sections. J. Histo. Cytochem. 35405-410. [DOI] [PubMed] [Google Scholar]
- 39.Richards, F. M. 1977. Areas, volumes, packing and protein structure. Annu. Rev. Biophys. Bioeng. 6151-176. [DOI] [PubMed] [Google Scholar]
- 40.Rixon, F. J., C. Addison, and J. McLauchlan. 1992. Assembly of enveloped tegument structures (L particles) can occur independently of virion maturation in herpes simplex virus type 1-infected cells. J. Gen. Virol. 73277-284. [DOI] [PubMed] [Google Scholar]
- 41.Rodriguez, J. E., T. Moninger, and C. Grose. 1993. Entry and egress of varicella virus blocked by same anti-gH monoclonal antibody. Virology 196840-844. [DOI] [PubMed] [Google Scholar]
- 42.Santos, R. A., C. C. Hatfield, N. L. Cole, J. A. Padilla, J. F. Moffat, A. M. Arvin, W. T. Ruyechan, J. Hay, and C. Grose. 2000. Varicella-zoster virus gE escape mutant VZV-MSP exhibits an accelerated cell-to-cell spread phenotype in both infected cell cultures and SCID-hu mice. Virology 275306-317. [DOI] [PubMed] [Google Scholar]
- 43.Santos, R. A., J. A. Padilla, C. Hatfield, and C. Grose. 1998. Antigenic variation of varicella zoster virus Fc receptor gE: loss of a major B cell epitope in the ectodomain. Virology 24921-31. [DOI] [PubMed] [Google Scholar]
- 44.Seligman, A. M., H. L. Wasserberg, and J. S. Hanker. 1966. A new staining method (OTO) for enhancing contrast of lipid-containing membranes and droplets in osmium tetraoxide-fixed tissue with osmiophilic thiocarbohydrazide (TCH). J. Cell. Biol. 30424-432. [DOI] [PMC free article] [PubMed] [Google Scholar]
- 45.Skepper, J. N., A. Whiteley, H. Browne, and A. Minson. 2001. Herpes simplex virus nucleocapsids mature to progeny virions by an envelopment→deenvelopment→reenvelopment pathway. J. Virol. 755697-5702. [DOI] [PMC free article] [PubMed] [Google Scholar]
- 46.Steven, A. C., and P. G. Spear. 2006. Viral glycoproteins and an evolutionary conundrum. Science 313177-178. [DOI] [PubMed] [Google Scholar]
- 47.Szilagyi, J. F., and C. Cunningham. 1991. Identification and characterization of a novel non-infectious herpes simplex virus-related particle. J. Gen. Virol. 72661-668. [DOI] [PubMed] [Google Scholar]
- 48.van de Plas, P., and J. L. Leunissen. 1993. Ultrasmall gold probes: characteristics and use in immuno(cyto)chemical studies. Methods Cell Biol. 37241-257. [DOI] [PubMed] [Google Scholar]
- 49.Wan, L., S. S. Molloy, L. Thomas, G. Liu, Y. Xiang, S. L. Rybak, and G. Thomas. 1998. PACS-1 defines a novel gene family of cytosolic sorting proteins required for trans-Golgi network localization. Cell 94205-216. [DOI] [PubMed] [Google Scholar]
- 50.Wang, Z. H., M. D. Gershon, O. Lungu, Z. Zhu, and A. A. Gershon. 2000. Trafficking of varicella-zoster virus glycoprotein gI: T(338)-dependent retention in the trans-Golgi network, secretion, and mannose 6-phosphate-inhibitable uptake of the ectodomain. J. Virol. 746600-6613. [DOI] [PMC free article] [PubMed] [Google Scholar]


