

Abstract
The Tas1r3 gene encodes the T1R3 receptor protein, which is involved in sweet taste transduction. To characterize ligand specificity of the T1R3 receptor and the genetic architecture of sweet taste responsiveness, we analyzed taste responses of 129.B6-Tas1r3 congenic mice to a variety of chemically diverse sweeteners and glucose polymers with three different measures: consumption in 48-h two-bottle preference tests, initial licking responses, and responses of the chorda tympani nerve. The results were generally consistent across the three measures. Allelic variation of the Tas1r3 gene influenced taste responsiveness to nonnutritive sweeteners (saccharin, acesulfame-K, sucralose, SC-45647), sugars (sucrose, maltose, glucose, fructose), sugar alcohols (erythritol, sorbitol), and some amino acids (d-tryptophan, d-phenylalanine, l-proline). Tas1r3 genotype did not affect taste responses to several sweet-tasting amino acids (l-glutamine, l-threonine, l-alanine, glycine), glucose polymers (Polycose, maltooligosaccharide), and nonsweet NaCl, HCl, quinine, monosodium glutamate, and inosine 5′-monophosphate. Thus Tas1r3 polymorphisms affect taste responses to many nutritive and nonnutritive sweeteners (all of which must interact with a taste receptor involving T1R3), but not to all carbohydrates and amino acids. In addition, we found that the genetic architecture of sweet taste responsiveness changes depending on the measure of taste response and the intensity of the sweet taste stimulus. Variation in the T1R3 receptor influenced peripheral taste responsiveness over a wide range of sweetener concentrations, but behavioral responses to higher concentrations of some sweeteners increasingly depended on mechanisms that could override input from the peripheral taste system.
Keywords: sweet taste, chorda tympani nerve, electrophysiology, lick responses, preference, genetics
Sweeteners include a wide range of chemicals that elicit a sucrose-like hedonically positive taste sensation in humans and many other mammals (50). In vitro heterologous expression experiments indicate that the initial step in sweet taste perception involves interaction with a dimer of T1R2 and T1R3, both of which are G protein-coupled proteins expressed in taste receptor cells (37, 43, 44). Because of the artificial nature of these in vitro reporter systems, it is important to examine ligand specificity of the sweet taste receptor in vivo as well. To achieve this, we asked how polymorphisms of the mouse T1R3 gene, Tas1r3, affect taste responses to a chemically diverse battery of sweeteners. We inferred that if a response to a sweetener changes with Tas1r3 genotype, then that sweetener must interact with a taste receptor involving T1R3. In addition to sweeteners, we also tested Polycose and maltooligosaccharide [glucose polymers that generate a taste qualitatively distinct from that of sucrose (58)] and other control nonsweet tastants.
The activation of sweet-responsive taste cells evokes action potentials in the afferent gustatory nerves. These responses are relayed to brain structures involved in generation of sweet taste sensation, which in turn activate feeding. The appetitive response to sweeteners can be influenced not only by perception of sweet taste but also by postoral (60) and motivational (59) factors. Thus taste responses to sweeteners may have a complex genetic architecture. To determine which components of sweet taste processing are affected by variation of the sweet taste receptor gene, we assessed the effects of Tas1r3 polymorphisms with three measures: sweetener consumption in 48-h two-bottle preference tests, initial licking responses, and responses of the chorda tympani nerve.
The Tas1r3 gene corresponds to the mouse saccharin preference (Sac) locus (3). Several studies have compared inbred mouse strains with different Tas1r3 genotypes to examine effects of Sac/Tas1r3 allelic variation on sweet taste responses (12, 19, 20, 24, 34, 38, 52, 59). However, because inbred mice differ at many polymorphic genes, it is possible that some of these strain differences are not determined by Tas1r3 variants. In the present study, we used mice from the 129.B6-Tas1r3 segregating congenic strain, which have the same genetic background but different Tas1r3 alleles (see details in MATERIALS AND METHODS). This allowed us to examine the specific effects of Tas1r3 polymorphisms.
MATERIALS AND METHODS
Animals
All protocols involving animals were approved by the Institutional Animal Care and Use Committees at the Monell Chemical Senses Center and Columbia University before the experiments. Mice from the 129.B6-Tas1r3 segregating congenic strain were bred at the Monell Center. This strain was produced by serial backcrossing of offspring from an intercross between the C57BL/6ByJ (B6) and 129P3/J (129) inbred strains onto the 129 strain and selection of mice carrying a fragment of B6 chromosome 4 including the Tas1r3 gene (36). As a result, the congenic mice have the genetic background of the 129 strain and a donor fragment of chromosome 4 containing the Tas1r3 gene from the B6 strain. The size of the donor fragment does not exceed 194 kb and encompasses, besides Tas1r3, several other genes that have been excluded as candidates for the Tas1r3 locus (3). We maintained 129.B6-Tas1r3 mice as a segregating congenic strain by mating congenic mice that have only one chromosome containing the B6 donor fragment (B6/129 genotype at the Tas1r3 locus) with 129 inbred mice. As a result, in each backcross generation we obtained mice with two different Tas1r3 genotypes: B6/129 heterozygotes (B6/129) and 129/129 homozygotes (129/129). Because the B6 allele of the Tas1r3 gene is dominant, B6/129 mice are phenotypically different from 129/129 mice (3, 5, 29, 36). Although B6/129 and 129/129 mice are genetically and phenotypically different, according to mouse strains nomenclature (http://www.informatics.jax.org/mgihome/nomen/strains.shtml), they belong to the same segregating strain, 129.B6-Tas1r3. In this study, we used age-matched congenic B6/129 and 129/129 littermates.
Animal Housing and Diet
During testing at the Monell Center (experiments 1 and 3) and Barnard College (experiment 2), the mice were housed in individual cages in a temperature-controlled room at 23°C on a 12:12-h light-dark cycle (7:00 AM on, 7:00 PM off). The mice at Monell had free access to pelleted Teklad Rodent Diet 8604 (Harlan, Madison, WI), whereas those at Barnard had free access to pelleted TestDiet laboratory chow 5012 (Purina Mills, Richmond, IN).
Genotyping
Genomic DNA of congenic mice was purified by standard techniques. Tas1r3 genotypes were determined with either a single-strand conformation polymorphism (SSCP) technique (details can be found in Ref. 35), or a TaqMan hybridization-based single nucleotide polymorphism (SNP) allelic discrimination assay (PE Applied Bio-systems, Foster City, CA). The allelic discrimination assay was designed to genotype the SNP site rs13478075 in the exon 3 of the Tas1r3 gene (52). The reagents included primers (forward 5′-ATTG-CACCCATTGAGCTCTCA-3′ and reverse 5′-ACGTTTCCCGGT-CACTTAGC-3′) and allele-specific probes [5′-(VIC)-CATGCTG-GCACTATA-(MGB)-3′ for B6 allele and 5′-(FAM)-CATGC-TGGCGCTATA-(MGB)-3′ for 129 allele; base substitution at polymorphic site is underlined]. Each reaction contained 10 ng of genomic DNA, TaqMan Universal PCR Master Mix (PE Applied Biosystems), 900 nM primers, and 50 nM probes in 25 μl. Real-time PCR and subsequent analysis were performed with the ABI Prism 7000 Sequence Detection System (PE Applied Biosystems) and the following conditions: 95°C for 10 min and then 40 cycles of amplification (92°C denaturation for 15 s, 60°C annealing/extension for 1 min).
Taste Solutions
We used tastants that evoked differential responses in B6 and 129 mice in our previous studies (1, 7, 10, 24, 28). Taste solutions were prepared in deionized water and presented at room temperature. All chemicals were purchased from Sigma (St. Louis, MO), except for acesulfame-K (Hoechst Food Ingredients, Edison, NJ), erythritol (M&C Sweeteners/Mitsubishi Chemical and Cargill, Blair, NE), sucralose (McNeil Specialty, New Brunswick, NJ), SC-45647 (a gift of Dr. Grant DuBois, The Coca-Cola Company, Atlanta, GA), Polycose (Ross Nutrition, Columbus, OH), maltooligosaccharide (Pfanstiehl Laboratories, Waukegan, IL), and hydrochloric acid (Fisher, Fair Lawn, NJ).
Experiment 1: Long-Term Two-Bottle Preference Tests
Rationale
The long-term two-bottle tests were used as a major phenotyping approach to detect the mouse saccharin preference (Sac) locus and to identify a corresponding gene, Tas1r3 (3, 5, 22, 36, 39, 52). Previous studies using long-term two-bottle tests have shown that allelic variation of the Sac/Tas1r3 gene affects responses to several other sweeteners in addition to saccharin (3, 5, 29, 38, 39). We therefore used the 48-h two-bottle tests in this study to examine effects of Tas1r3 genotype on consumption of a wide range of sweeteners. Because long-term intakes of nutritive tastants may be influenced by postoral effects (e.g., Refs. 54, 55), we attempted to minimize postoral contributions by testing each group of mice with no more than one caloric sweetener or glucose polymer (see Table 1).
Table 1.
Groups of 129.B6-Tas1r3 congenic mice used in two-bottle preference tests
| Numbers of Mice
|
|||||
|---|---|---|---|---|---|
| B6/129* |
129/129* |
||||
| Group | Taste Stimuli | Female | Male | Female | Male |
| 1 | Saccharin (0.02, 0.06, 0.2, 0.6, 2, 5, 10, 20, 60, 120, 200 mM) | 11 | 19 | ||
| 2 | Saccharin (10 mM); sucrose (10, 30, 100, 300 mM) | 8 | 6 | 4 | 4 |
| 3 | Glycine (1, 3, 10, 30, 100 mM); d-phenylalanine (1, 3, 10, 30, 100 mM); l-proline (1, 3, 10, 30, 100 mM); saccharin (10 mM); citric acid (5 mM) | 6 | 6 | 7 | 3 |
| 4 | d-Tryptophan (1, 10, 30, 50 mM); glucose (10, 30, 100, 300 mM); saccharin (10 mM); NaCl (300, 75 mM) | 7 | 5 | 3 | 9 |
| 5 | Acesulfame (0.3, 1, 3, 10 mM); maltose (10, 30, 100, 300 mM); saccharin (10 mM); quinine HCl (0.03 mM) | 7 | 4 | 11 | 3 |
| 6 | SC-45647 (0.009, 0.03, 0.09, 0.3 mM); sucralose (0.3, 1, 3, 10 mM); fructose (10, 30, 100, 300 mM); IMP (1, 10 mM); saccharin (10 mM) | 4 | 5 | 7 | 3 |
| 7 | l-Alanine (1, 3, 10, 30, 100 mM); erythritol (82, 246, 491, 819 mM); MSG (1, 300 mM); saccharin (10 mM) | 5 | 5 | 9 | 5 |
| 8 | l-Glutamine (1, 3, 10, 30, 100 mM); saccharin (10 mM) | 6 | 7 | 6 | 6 |
| 9 | l-Threonine (1, 3, 10, 30, 100 mM); saccharin (10 mM) | 6 | 7 | 7 | 6 |
| 10 | Maltooligosaccharide (0.1%, 0.3%, 1%, 3%); saccharin (10 mM) | 5 | 5 | 5 | 5 |
| 11 | Polycose (0.1%, 0.3%, 1%, 3%, 10%); saccharin (10 mM) | 7 | 7 | 7 | 4 |
| Total | 72 | 57 | 85 | 48 | |
For each group of mice, the taste solutions were tested in the order listed. IMP, inosine 5′-monophosphate; MSG, monosodium glutamate.
Tas1r3 genotype.
Animals
Eleven groups of 129.B6-Tas1r3 congenic mice (262 mice total) were used in the preference tests (see Table 1).
Procedure
Construction of the drinking tubes has been described previously (4) and is given in detail on the Monell Mouse Taste Phenotyping Project Web site (www.monell.org/mmtpp). Individually housed mice were presented with one tube containing a taste solution in deionized water and another tube containing deionized water. Daily measurements were made in the middle of the light period by reading fluid volume to the nearest 0.1 ml. Each concentration of a taste solution was tested for 48 h, with the positions of the tubes containing taste solution and water switched after 24 h to control for side preferences. Mouse body weight (BW) was measured (to the nearest 0.1 g) at the beginning of each tastant concentration series and at the end of the experiment.
The series of concentrations of each tastant was presented in an ascending order, with the exception of two concentrations of NaCl, which were presented in a descending order. There were no interruptions in the testing of different concentrations of the same tastant. The mice received deionized water in both drinking tubes for at least 2 days between testing concentration series of different tastants, except for the tests with 10 mM saccharin and control nonsweet compounds, which were presented at the end of tests without breaks.
Data analyses
Average daily (24 h) fluid intakes were calculated for each mouse for each solution concentration. Preference scores were calculated as the ratio of average daily solution intake to average daily total fluid (solution + water) intake (%).
Tas1r3 genotype did not affect BW of the congenic mice [F(1,249) = 0.01, P = 0.9; 2-way ANOVA], but males were heavier than females [25.6 ± 0.3 and 21.4 ± 0.2 g, respectively; F(1,249) = 172.9, P < 0.0001]. To account for sex differences in BW and to make results comparable with our previous publications (1, 7, 10), we expressed solution intakes per 30 g of BW (the approximate weight of an adult mouse), using average individual BW values obtained before and after testing a concentration series of taste solutions.
In initial analyses, we assessed sex differences in taste solution intakes and preferences with ANOVA and found only a few, mostly weak, sex effects. Effects of the Tas1r3 genotype were nearly identical, irrespective of whether sex was included or excluded as a main effect. Therefore, analyses of combined data for males and females are discussed below.
When a tastant was tested in a single concentration, we examined differences between B6/129 and 129/129 congenic mice with t-tests. When tests involved multiple concentrations, we analyzed the data with two-way ANOVAs, separately for each dependent measure (i.e., intake or preference score) of each tastant. In the ANOVAs, we treated Tas1r3 genotype as a between-group factor and concentration as a within-group factor. We used Fisher least significant difference planned comparison tests to examine differences between individual means. These statistical tests used a criterion for significance of P < 0.05. On the basis of previous studies (3, 5, 10, 29, 36, 52), we made specific predictions about the expected direction of difference between mice with different Tas1r3 genotypes (B6/129 > 129/129). As a result, the P values in planned comparison tests were based on a one-tailed distribution.
A preference threshold was defined as the lowest solution concentration for which a preference score was above 75%. An avoidance threshold was defined as the lowest solution concentration for which a preference score was below 25%. Thresholds of preference and avoidance can also be determined with statistical tests (e.g., comparing solution and water intakes or comparing preference scores with the 50% indifference level). Because numbers of experimental animals used and numbers of solutions tested differed among groups (see Table 1), the power to detect significant differences and effects of multiple comparisons also varied among groups. Using the defined threshold levels allowed us to avoid a complication of differential sensitivity of statistical tests in different groups. The 25% and 75% threshold levels were chosen as midpoints between complete indifference (50%) and complete avoidance (0%) or preference (100%). These threshold levels approximate the 50% level of correct responses often used in psychophysics as a threshold value (e.g., Refs. 11, 63). In all cases when a preference score was above preference threshold or below avoidance threshold, intakes of water and a taste solution were significantly different (P ≤ 0.014, paired t-tests).
Experiment 2: Initial Licking Responses
Rationale
Because of the long duration of the 48-h preference tests used in experiment 1, taste solution consumption in these tests could be affected by a variety of taste and nontaste factors. Nontaste factors may include postingestive feedback (positive and negative), experiential effects, and oral habituation (16–18, 29, 32, 33, 56, 57, 60, 63, 64, 67). To minimize the contribution of nontaste factors, one can record initial licking responses to taste stimuli (15, 18, 24, 25, 62, 66). This approach is based on the premise that when trial duration is brief the number of licks that a rodent takes should reflect the orosensory stimulating properties of a taste stimulus, but not any postingestive effects.
Two studies have previously compared the initial licking responses of inbred B6 mice (with a more sensitive Tas1r3 allele) and 129 mice (with a less sensitive Tas1r3 allele) to sucrose and glycine (19, 24). These studies reported that B6 mice licked more vigorously for low sucrose concentrations but less vigorously for high concentrations of sucrose and glycine. It would thus appear that the B6 allele of the Tas1r3 gene confers higher lick responsiveness for perithreshold concentrations of sucrose, but not for suprathreshold concentrations of sucrose or glycine. To test this possibility directly, we compared initial licking responses of 129.B6-Tas1r3 congenic mice with different Tas1r3 genotypes to three types of sweeteners: a sugar (sucrose), an artificial sweetener (saccharin), and amino acids (glycine and d-phenylalanine).
In this experiment, we tested food- and water-restricted mice. The restricted condition was unlikely to alter taste responses, because in previous studies restricted and nonrestricted mice did not differ in lick rates for water, sucrose, and SC-45647 (19, 23, 24).
Animals
We tested 129.B6-Tas1r3 congenic mice with the B6/129 Tas1r3 genotype (10 males and 10 females) and the 129/129 Tas1r3 genotype (9 males and 8 females).
Procedure
We used the brief-access taste test to measure initial licking responses of the mice during 30-min test sessions (25). Each 30-min test session was conducted in a multichannel gustometer (Davis MS160-Mouse; DiLog Instruments, Tallahassee, FL), which provided a mouse with access to a sipper tube for a 5-s trial and then, after a 7.5-s intertrial interval, provided it with access to a different sipper tube. Each 5-s trial started after the first lick. During a test session, each mouse was tested with a range of concentrations of saccharin (0.1, 0.3, 1, 3, 10, and 30 mM), sucrose (30, 100, 200, 300, 600, and 1,000 mM), d-phenylalanine (1, 3, 10, 30, and 100 mM), or glycine (250, 500, 750, 1,000, and 1,500 mM). Only one taste compound was included per test session (e.g., different concentrations of sucrose), and only one concentration of a taste stimulus was tested per trial. We included a sipper tube that dispensed water alone in each test session. To control for any concentration order effects across trials, we treated the range of concentrations of a given taste stimulus (including water alone) as a block and programmed our software so that it randomized (without replacement) the sequence of presentation of each stimulus solution within each block. The mouse could initiate up to 288 trials throughout the test session.
Before testing, each mouse was subjected to 2 days of water training. This served to familiarize the mouse with the gustometer and train it to lick from the sipper tube to obtain fluid. To motivate the mouse to lick from the sipper tube, it was water deprived for 22.5 h before the training session. Each training session began when the mouse took its first lick and lasted 30 min. On training day 1, the mouse could drink water freely from a single stationary spout throughout the training session. Immediately after this training session, the mouse was given 1 h of ad libitum access to water. It was then water deprived for another 22.5 h. On training day 2, the mouse received water during 5-s trials. All mice adapted readily to the gustometer and took between 250 and 500 licks per training session. After training, each mouse was given food and water ad libitum for 24 h.
We ran each mouse through four test sessions, each with a different sweetener in the following order: saccharin, sucrose, d-phenylalanine, and then glycine. To encourage sampling from the sweetener solutions, we food and water restricted the mice. To this end, 23.5 h before a test session, we placed each mouse in a clean cage with fresh bedding and provided it with 1 g of laboratory chow (dustless precision 1-g food pellets; BioServ, San Diego, CA) and 2 ml of tap water. These rations equaled ~20% and 30% of a mouse’s normal daily food and water intake, respectively (J. I. Glendinning, unpublished data). After each test session, the mice were given a recovery day, during which time they had food and water ad libitum.
Data analysis
We converted each mouse’s licking responses to a taste stimulus (e.g., 0.03 M sucrose) into a standardized lick ratio (SLR). This was necessary to control for individual differences in intrinsic lick rate. The intrinsic lick rate (licks/s) was determined separately for each mouse as a reciprocal of the mean interlick interval (excluding intervals ≥200 ms) on training day 1 (25); it indicates the maximal rate at which an individual mouse can lick. To calculate the SLR, we divided the mean number of licks taken per trial by the maximum number of licks that the same mouse could potentially take across a 5-s trial; this latter value was calculated by multiplying each mouse’s intrinsic lick rate (in licks/s) times 5 (i.e., the number of seconds in the trial). A SLR approaching 0.0 indicates that the taste stimulus elicited virtually no licking, whereas a value of 1.0 indicates that the taste stimulus elicited maximal licking. Although this ratio does not necessarily control for variation in the motivational state arising from differential responses to the food and water restriction schedule, it does control for individual differences in intrinsic lick rate.
We compared the concentration-response curves of congenic mice with different Tas1r3 genotypes, separately for each sweetener, with a mixed-model ANOVA. The dependent measure was SLR. The independent variables were Tas1r3 genotype (i.e., B6/129 and 129/129) and sweetener concentration; genotype was a between factor and concentration was a within factor. To explain significant interactions, we compared responses of congenic mice with different Tas1r3 genotypes, separately for each sweetener concentration, with unpaired t-tests. To control for the use of multiple t-test, we adjusted the α-level with the Bonferroni procedure. Finally, we tested for sex effects within each genotype and taste stimulus. This involved a mixed-model two-way ANOVA, in which we treated sweetener concentration as a within factor and gender as a between factor. These statistical tests used a criterion for significance of P < 0.05 based on a two-tailed distribution.
Experiment 3: Responses of Chorda Tympani Nerve
Rationale
Afferent signals from taste cells are relayed to the brain via three major gustatory nerves: the chorda tympani, glossopharyngeal, and greater superficial petrosal. To directly examine effects of Tas1r3 genotype on peripheral taste input, we examined responses of the chorda tympani nerve to lingual application of taste stimuli. The chorda tympani nerve was chosen for this study for the following reasons. First, in mice it has a high ratio of sucrose-best fibers to NaCl-best fibers (47) and responds robustly to gustatory stimulation with sweeteners (13, 14, 26, 28, 29, 48, 61). For example, chorda tympani responses in mice to sucrose (expressed relative to low concentration of NaCl) are greater than those in rats (cf. Refs. 30, 41). Second, the Tas1r3 gene is expressed in taste cells throughout the oral cavity, including the anterior part of the tongue (31, 40, 42, 44, 52, 53), which is innervated by the chorda tympani nerve. We therefore expected that if allelic variation of Tas1r3 affects peripheral taste input, then chorda responses are likely to be affected. Finally, there were practical advantages of using this nerve: chorda tympani responses in mice are easier to obtain compared with those from the glossopharyngeal or greater superficial petrosal nerves; we were able to obtain stable chorda tympani recordings throughout the experiments that lasted up to 2 h.
Animals
We recorded responses of the whole chorda tympani nerve to lingual application of taste solutions in 129.B6-Tas1r3 congenic mice with the B6/129 Tas1r3 genotype (4 females and 10 males) and the 129/129 Tas1r3 genotype (2 females and 8 males).
Procedure
Techniques for surgery, taste stimulation, and recordings were described previously (26–29). In brief, mice were anesthetized with pentobarbital sodium (40–50 mg/kg, with further doses as necessary). A cannula was inserted in the trachea, and the animal was placed supine in a nontraumatic headholder. The right chorda tympani nerve was exposed at its exit from the lingual nerve by removal of the internal pterygoid muscle. The chorda tympani nerve was then dissected free from surrounding tissues and cut at the point of its entry to the bulla. The entire chorda tympani nerve was placed on a platinum wire electrode, and a few drops of mineral oil were placed in the wound site to prevent desiccation of the nerve. An indifferent electrode was positioned in nearby muscle tissue. The whole nerve response was then amplified, integrated with a time constant of 1.0 s, and displayed on chart recorder paper.
For chemical stimulation of the fungiform taste papillae, the anterior one-half of the animal’s tongue was enclosed in a flow chamber. Solutions at room temperature (22°C) were delivered into the flow chamber by gravity flow at a rate of 0.5 ml/s for 30 s. Between taste stimuli, the tongue was rinsed with deionized water for at least 1 min. Ammonium chloride (NH4Cl) at 100 mM was presented frequently throughout recording to serve as a reference stimulus. A concentration series of a given compound was applied in ascending order. The following taste stimuli were used: NaCl (100 mM), KCl (100 mM), quinine hydrochloride (20 mM), HCl (10 mM), sucrose (3, 10, 30, 100, 300, and 1,000 mM), saccharin (0.2, 0.6, 2, 6, and 20 mM), glucose (10, 100, and 1,000 mM), fructose (10, 100, and 1,000 mM), maltose (10, 100, and 1,000 mM), Polycose (1%, 10%, and 30%), maltooligosaccharide (1%, 10%, and 30%), SC-45647 (0.1, 0.3, 1, 3, and 10 mM), sorbitol (20, 200, and 2,000 mM), acesul-fame-K (1, 10, and 100 mM), sucralose (0.05, 0.5, and 5 mM), l-proline (10, 100, 500, and 1,000 mM), glycine (10, 100, and 1,000 mM), l-alanine (10, 100, and 1,000 mM), d-tryptophan (1, 10, and 30 mM), and d-phenylalanine (1, 10, and 100 mM).
The magnitude of the integrated response was measured 20 s after stimulus onset. This time point for measuring the response was chosen for the following reasons. During the 30-s period of taste stimulation, we observe an initial transient “phasic” response component (which lasts ~10 s) and a subsequent “tonic” component. We find that the phasic responses have large animal-to-animal variation. This variation is probably due to individual differences in a proportion of mechano-and thermosensitive somatosensory fibers within the chorda tympani nerve, which are activated in the beginning of lingual application of taste stimuli and thus contribute to the nerve activity along with taste fibers. The level of the tonic response remains stable during the entire period of taste stimulation. We therefore consider the tonic response as a better measure of taste-evoked activity compared with the phasic response. The time point 20 s after stimulus onset is in the middle of the tonic response. Neural taste responses at this time point have been reported in numerous publications (e.g., Refs. 2, 5, 26–29, 36, 46); therefore using this time point allows us to make comparisons with the previous studies.
The magnitude of the integrated response to each taste stimulus was expressed as a proportion of the response to 100 mM NH4Cl (applied both before and after the taste stimulus recording and averaged). This normalization procedure was necessary because the absolute magnitude of multifiber responses can vary over a recording session because of factors such as changing the distance between the firing nerve fibers and the electrode. We chose NH4Cl as a standard stimulus for data correction to be consistent with our previous studies (2, 5, 26–29, 36, 46). Moreover, in our previous analyses (discussed in detail in Refs. 27, 28), we showed that 1) NH4Cl responses normalized relative to responses to other taste stimuli are similar in the B6 and 129 strains and 2) results of response normalization relative to NH4Cl are similar to normalization using an alternative approach (21). An additional argument supporting the appropriateness of our standardization procedure is that in this study we observed genetic differences in responses to only a subset of stimuli, rather than generalized differences that would be expected if the standardization procedure were inappropriate.
Data analyses
Because data for the chorda tympani responses had some violations of ANOVA assumptions, we used nonparametric analyses. In preliminary analyses, we found no sex differences in chorda tympani responses to taste stimuli. Therefore, we combined data for males and females and analyzed only differences between congenic mice with different Tas1r3 genotypes. We examined the genotypic differences in responses to individual taste solutions with Mann-Whitney U-tests. These statistical tests used a criterion for significance of P < 0.05. On the basis of our previous studies (5, 28, 29, 36), we made specific predictions about the expected direction of difference between mice with different Tas1r3 genotypes (B6/129 > 129/129). As a result, the P values were based on a one-tailed distribution.
RESULTS
Experiment 1: Long-Term Two-Bottle Preference Tests
Congenic mice from all 11 groups were tested in 48-h two-bottle tests with 10 mM saccharin and water. As expected, B6/129 mice had higher saccharin intakes (10.1 ± 0.5 ml/30 g BW, mean ± SE; n = 127) and preferences (96.4 ± 0.4%) than 129/129 mice (6.1 ± 0.3 ml/30 g BW and 84.9 ± 1.4%; n = 131, P < 0.0001, t-tests).
For 10 of the sweeteners (saccharin, acesulfame, sucralose, SC-45647, sucrose, glucose, fructose, d-tryptophan, d-phenylalanine, and l-proline), B6/129 mice had overall higher intakes and preference scores than did 129/129 mice (Fig. 1, Table 2). For two of the sweeteners (maltose and erythritol), B6/129 mice had significantly higher preference scores, but effects of genotype on solution intakes were not significant; nevertheless, planned comparison tests detected significantly higher 300 mM maltose intake in B6/129 mice than in 129/129 mice (P = 0.005). For the six remaining sweeteners and glucose polymers (Polycose, maltooligosaccharide, l-glutamine, l-threonine, l-alanine, and glycine), B6/129 and 129/129 mice had similar intakes and preferences.
Fig. 1.

Sweetener and glucose polymer intakes (top) and preferences (bottom) of congenic mice with different Tas1r3 genotypes. Values are means ± SE. Dotted horizontal lines show thresholds of preference (75%) and avoidance (25%). *Significant difference between B6/129 and 129/129 mice (P < 0.05, Fisher least significant difference planned comparison tests). BW, body weight.
Table 2.
ANOVA results for preference tests of 129.B6-Tas1r3 congenic mice (df and F values)
| Effect | df | Solution Intake/30 g BW | Preference Score |
|---|---|---|---|
| Saccharin | |||
| Tas1r3 | 1, 41 | 37.9* | 33.9* |
| Concentration | 10, 410 | 108.6* | 127.9* |
| Tas1r3 × concentration | 10, 410 | 11.6* | 5.9* |
| Acesulfame | |||
| Tas1r3 | 1, 23 | 5.1* | 10.4* |
| Concentration | 3, 69 | 40.9* | 19.8* |
| Tas1r3 × concentration | 3, 69 | 3.1* | 1.3 |
| Sucralose | |||
| Tas1r3 | 1, 17 | 19.5* | 21.4* |
| Concentration | 3, 51 | 29.0* | 23.2* |
| Tas1r3 × concentration | 3, 51 | 5.6* | 3.8* |
| SC-45647 | |||
| Tas1r3 | 1, 17 | 10.3* | 10.0* |
| Concentration | 3, 51 | 38.8* | 9.5* |
| Tas1r3 × concentration | 3, 51 | 7.8* | 1.3 |
| Sucrose | |||
| Tas1r3 | 1, 20 | 8.4* | 6.8* |
| Concentration | 3, 60 | 136.5* | 51.8* |
| Tas1r3 × concentration | 3, 60 | 1.1 | 2.8* |
| Maltose | |||
| Tas1r3 | 1, 23 | 2.7 | 11.0* |
| Concentration | 3, 69 | 64.2* | 20.6* |
| Tas1r3 × concentration | 3, 69 | 2.3 | 2.7 |
| Glucose | |||
| Tas1r3 | 1, 21 | 9.7* | 10.4* |
| Concentration | 3, 63 | 20.3* | 12.1* |
| Tas1r3 × concentration | 3, 63 | 3.4* | 1.0 |
| Fructose | |||
| Tas1r3 | 1, 17 | 16.1* | 12.5* |
| Concentration | 3, 51 | 23.8* | 1.6 |
| Tas1r3 × concentration | 3, 51 | 13.0* | 3.4* |
| Erythritol | |||
| Tas1r3 | 1, 22 | 1.9 | 9.9* |
| Concentration | 3, 66 | 17.2* | 30.6* |
| Tas1r3 × concentration | 3, 66 | 1.9 | 1.9 |
| Polycose | |||
| Tas1r3 | 1, 23 | 0.8 | 0.0 |
| Concentration | 4, 92 | 114.9* | 38.1* |
| Tas1r3 × concentration | 4, 92 | 0.7 | 0.2 |
| Maltooligosaccharide | |||
| Tas1r3 | 1, 18 | 0.9 | 1.0 |
| Concentration | 3, 54 | 13.3* | 27.6* |
| Tas1r3 × concentration | 3, 54 | 1.6 | 1.2 |
| d-Tryptophan | |||
| Tas1r3 | 1, 22 | 10.5* | 14.4* |
| Concentration | 3, 66 | 15.3* | 9.8* |
| Tas1r3 × concentration | 3, 66 | 6.4* | 5.5* |
| d-Phenylalanine | |||
| Tas1r3 | 1, 20 | 7.9* | 10.0* |
| Concentration | 4, 80 | 5.6* | 4.6* |
| Tas1r3 × concentration | 4, 80 | 11.4* | 8.4* |
| l-Proline | |||
| Tas1r3 | 1, 20 | 11.2* | 12.4* |
| Concentration | 4, 80 | 4.9* | 3.0* |
| Tas1r3 × concentration | 4, 80 | 4.0* | 3.4* |
| l-Glutamine | |||
| Tas1r3 | 1, 23 | 1.1 | 0.5 |
| Concentration | 4, 92 | 3.3* | 1.6 |
| Tas1r3 × concentration | 4, 92 | 0.3 | 0.4 |
| l-Threonine | |||
| Tas1r3 | 1, 24 | 3.0 | 1.7 |
| Concentration | 4, 96 | 11.4* | 2.5* |
| Tas1r3 × concentration | 4, 96 | 2.2 | 1.3 |
| l-Alanine | |||
| Tas1r3 | 1, 22 | 0.3 | 0.4 |
| Concentration | 4, 88 | 5.1* | 1.3 |
| Tas1r3 × concentration | 4, 88 | 1.5 | 0.8 |
| Glycine | |||
| Tas1r3 | 1, 20 | 0.2 | 0.0 |
| Concentration | 4, 80 | 14.0* | 10.3* |
| Tas1r3 × concentration | 4, 80 | 1.5 | 0.8 |
Data are shown in Fig. 1.
P < 0.05, ANOVA.
Differences between B6/129 and 129/129 mice in preference thresholds closely corresponded to differences in indexes of consumption (Table 3). Compared with 129/129 mice, B6/129 mice had lower preference thresholds for saccharin, acesulfame, sucralose, SC-45647, sucrose, maltose, glucose, fructose, d-phenylalanine, d-tryptophan, and l-proline (consumption of all these sweeteners was also affected by Tas1r3 genotype). Preference scores for erythritol did not reach threshold for preference in mice of either genotype, but they were higher in B6/129 mice than in 129/129 mice, and only 129/129 mice avoided the highest (819 mM or 10%) erythritol concentration. When sweetener or glucose polymer consumption was not affected by Tas1r3 genotype, there were also no differences in preference thresholds between B6/129 and 129/129 mice; this was the case for Polycose, maltooligosaccharide, l-glutamine, l-threonine, l-alanine, and glycine. Mice of both genotypes preferred Polycose (starting from 1%) and malto-oligosaccharide (starting from 3%) and did not display preference scores above preference threshold for l-glutamine, l-threonine, l-alanine, and glycine.
Table 3.
Taste preference thresholds of B6 and 129 inbred and 129.B6-Tas1r3 congenic mice
| Parental Strains
|
Congenic Mice
|
|||||||
|---|---|---|---|---|---|---|---|---|
| Taste Compound | B6 | Difference | 129 | Reference | B6/129* | Difference | 129/129* | Tas1r3 Effect on Intakes or Preferences† |
| Saccharin, mM | 1 | < | 10 | 10 | 0.6 | < | 5 | + |
| Acesulfame, mM | 1 | < | 10 | 10 | 3 | < | ND | + |
| Sucralose, mM | 0.25 | < | 2.5 | 10 | 0.3 | < | 10 | + |
| SC-45647, mM | 0.03 | < | 0.3 | 10 | 0.09 | < | 0.3 | + |
| Sucrose, mM | 29 | < | 234 | 10 | 30 | < | 100 | + |
| Maltose, mM | 28 | < | 83 | 10 | 100 | < | 300 | + |
| Glucose, mM | 10 | = | 10 | 1 | 300 | < | ND | + |
| Fructose, mM | 10 | < | 30 | 1 | 30 | < | ND | + |
| Erythritol, mM | 246 | < | ND | 10 | ND | = | ND | + |
| Polycose, % | 0.3 | < | 3 | 7 | 1 | = | 1 | − |
| Maltooligosaccharide, % | 0.1 | < | 3 | 1 | 3 | = | 3 | − |
| d-Tryptophan, mM | 1 | < | ND | 10 | 30 | < | ND | + |
| d-Phenylalanine, mM | 3 | < | ND | 10 | 30 | < | ND | + |
| l-Proline, mM | 100 | < | ND | 10 | 100 | < | ND | + |
| l-Glutamine, mM | 100 | < | 300 | 1 | ND | = | ND | − |
| l-Threonine, mM | 30 | < | 100 | 1 | ND | = | ND | − |
| l-Alanine, mM | 10 | < | 100 | 1 | ND | = | ND | − |
| Glycine, mM | 0.1 | < | 300 | 10 | ND | = | ND | − |
Signs<, >, and = indicate presence and direction of threshold differences. ND, not determined (highest concentration tested was below preference threshold). Taste preference threshold was defined as the lowest solution concentration for which animals display preference score of at least 75%. Thresholds reported in References 7 and 10 were defined with a different criterion and in some cases differ from threshold values shown in this table. Data for congenic mice are from the present study. *Tas1r3 genotypes. †Tas1r3 effect on intakes or preferences as reported in Table 5.
Tas1r3 genotype did not affect citric acid, quinine, NaCl, inosine 5′-monophosphate (IMP), or monosodium glutamate (MSG) intakes or preferences (Fig. 2).
Fig. 2.
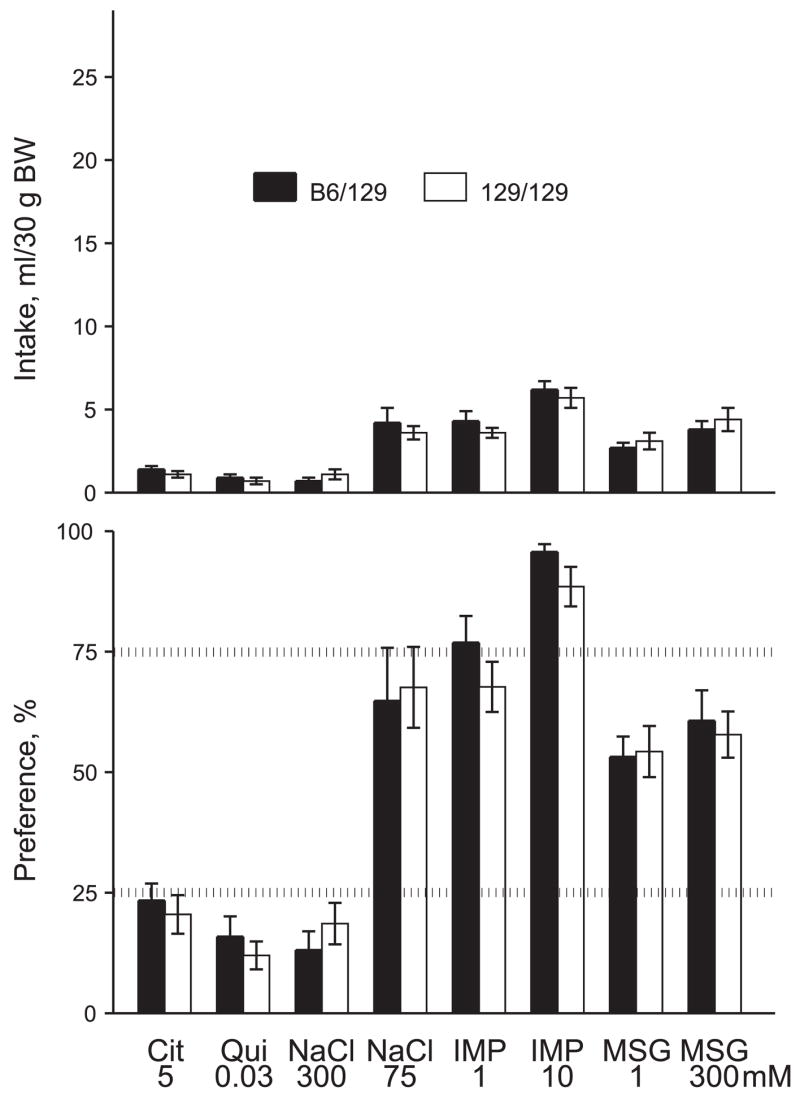
Nonsweet tastant intakes (top) and preferences (bottom) of congenic mice with different Tas1r3 genotypes. Values are means ± SE. There were no significant differences between B6/129 and 129/129 mice (P > 0.05, t-tests). Cit, citric acid; Qui, quinine hydrochloride; IMP, inosine 5′-monophosphate; MSG, monosodium glutamate.
Together, these results show that in the long-term tests Tas1r3 genotype affects consumption of most, but not all, sweeteners tested.
Experiment 2: Initial Licking Responses
There was no evidence of sex differences in lick responsiveness to the four sweeteners. We used a two-way ANOVA to examine the main effects of sex and sweetener concentration on SLR separately for each sweetener (n = 4) and genotype (n = 2). In each of the 8 analyses, the main effect of sweetener concentration was significant (P < 0.05), but the main effect of sex and the interaction of sex × sweetener concentration were nonsignificant (P > 0.05). On the basis of these results, we pooled responses of males and females in the following analyses.
Both B6/129 and 129/129 mice exhibited robust concentration-dependent increases in licking for all four sweeteners (Fig. 3, Table 4). Compared with 129/129 mice, B6/129 mice licked 0.1–0.3 mM saccharin, 30–300 mM sucrose, and 10–100 mM d-phenylalanine more vigorously. None of the glycine concentrations evoked differential licking response of B6/129 and 129/129 mice. Together, these findings indicate that the B6 allele of Tas1r3 confers higher lick responsiveness to certain concentrations of sucrose, saccharin, and d-phenylalanine, but not glycine.
Fig. 3.

Initial licking responses of congenic mice with different Tas1r3 genotypes to a range of concentrations of 4 sweeteners (saccharin, sucrose, d-phenylalanine, and glycine). To control for group differences in baseline lick rates, the standardized lick ratio (SLR) was used to indicate lick rates. A SLR of 1.0 indicates that a mouse licked throughout the entire 5-s trial, whereas a SLR of 0.2 indicates that a mouse licked for ~20% of the 5-s trial (i.e., for 1 s). Means ± SE are indicated; n = 17–20 mice per genotype. B6/129 and 129/129 congenic mice were compared with unpaired t-tests, separately for each concentration of each sweetener. *Significant difference between B6/129 and 129/129 mice (P < 0.05).
Table 4.
ANOVA results for initial licking responses of 129.B6-Tas1r3 congenic mice
| Main Effect | df | F-Ratio |
|---|---|---|
| Saccharin | ||
| Genotype | 1, 175 | 1.7 |
| Concentration | 5, 175 | 229.3* |
| Interaction | 5, 175 | 1.4* |
| Sucrose | ||
| Genotype | 1, 210 | 6.4* |
| Concentration | 5, 210 | 514.7* |
| Interaction | 5, 210 | 12.2* |
| d-Phenylalanine | ||
| Genotype | 1, 140 | 15.9* |
| Concentration | 4, 140 | 115.9* |
| Interaction | 4, 140 | 11.9* |
| Glycine | ||
| Genotype | 1, 140 | 0.8 |
| Concentration | 4, 140 | 143.7* |
| Interaction | 4, 140 | 0.8 |
Data are shown in Fig. 3.
P < 0.05.
Experiment 3: Taste Responses in Chorda Tympani Nerve
We obtained strong integrated nerve responses to high concentrations of many of the taste stimuli, as illustrated by the representative traces in Fig. 4. Compared with 129/129 mice, B6/129 mice had significantly larger chorda tympani nerve responses to the higher concentrations of saccharin, acesulfame, sucralose, SC-45647, sucrose, maltose, glucose, fructose, d-sorbitol, d-tryptophan, and l-proline (Fig. 5).
Fig. 4.
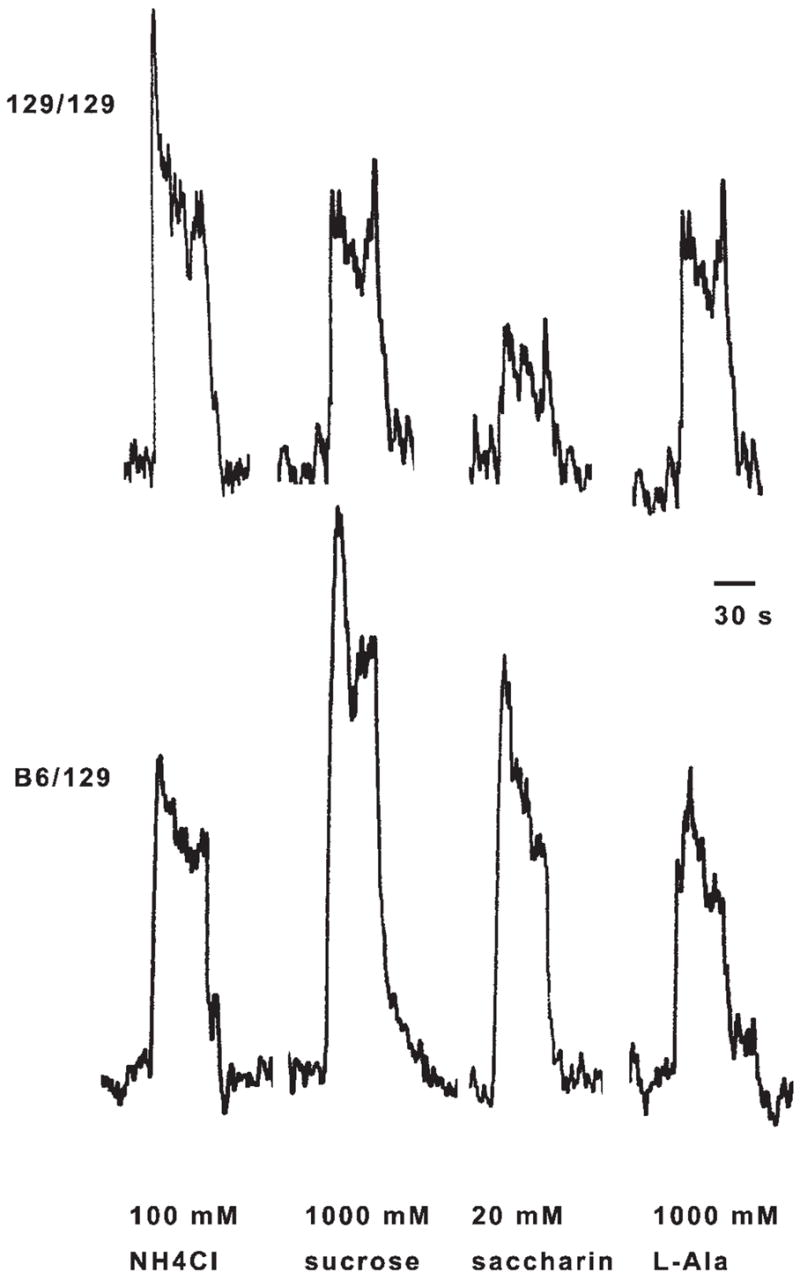
Sample recordings of integrated whole nerve chorda tympani activity in a 129/129 congenic mouse (top) and a B6/129 congenic mouse (bottom). Relative responses to sucrose and saccharin were higher in the B6/129 mouse compared with the 129/129 mouse. Responses to l-alanine (l-Ala) were similar in both mice.
Fig. 5.

Chorda tympani responses (relative to 100 mM NH4Cl) to sweeteners and glucose polymers in congenic mice with different Tas1r3 genotypes. Values are medians ± median absolute deviations. *Significant difference between B6/129 and 129/129 mice (P < 0.05, Mann-Whitney U-tests).
In contrast, chorda tympani responses to Polycose, malto-oligosaccharide, d-phenylalanine, l-alanine, and glycine did not differ between B6/129 and 129/129 congenic mice at any concentration. Furthermore, B6/129 and 129/129 congenic mice had similar chorda tympani responses to NaCl, KCl, HCl, or quinine (Fig. 6).
Fig. 6.

Chorda tympani responses (relative to 100 mM NH4Cl) to nonsweet stimuli in congenic mice with different Tas1r3 genotypes. Values are medians ± median absolute deviations. There were no significant differences between B6/129 and 129/129 mice (P > 0.15, Mann-Whitney U-tests). Qui, quinine hydrochloride.
DISCUSSION
Several studies have reported that B6 and 129 inbred strains differ in taste responses to sweeteners and glucose polymers (summarized in Tables 3 and 5). While these strain differences may reflect the fact that each strain carries a different Tas1r3 allele, they could also reflect the actions of other genes polymorphic between these two strains and influencing sweet taste responses. To distinguish between these two possibilities, we compared 129.B6-Tas1r3 congenic mice with different Tas1r3 genotypes: B6/129 and 129/129. Difference between B6/129 and 129/129 congenic mice demonstrates that a response is affected by Tas1r3 genotype. If B6 and 129 inbred mice differ but B6/129 and 129/129 congenic mice do not, this shows that the parental strain difference is attributed to genes other than Tas1r3.
Table 5.
Effects of allelic variation of Tas1r3 gene on taste responsiveness
|
Tas1r3 Effecta |
||||||||
|---|---|---|---|---|---|---|---|---|
| Parental Strains
|
129.B6-Tas1r3 Congenicse |
B6×129 F2 (29)
|
||||||
| Taste Compound | Two Bottleb | Chorda Tympanic | Licksd | Two Bottleb | Chorda Tympanic | Licksd | Two Bottleb | Chorda Tympanic |
| Nonnutritive sweeteners | ||||||||
| Saccharin | B6 129 (10) | B6 > 129 (28) | + | + | + | + | + | |
| Acesulfame | B6 > 129 (10) | B6 > 129 (28) | + | + | ||||
| Sucralose | B6 > 129 (10) | B6 > 129 (28) | + | + | ||||
| SC-45647 | B6 > 129 (10) | B6 > 129 (28) | B6 > 129 (24) | + | + | + | ||
| Sugars | ||||||||
| Sucrose | B6 > 129 (8, 10, 54, 55) | B6 > 129 (5, 28) | B6 > 129 (24) | + | + | + | + | + |
| Maltose | B6 > 129 (10) | B6 > 129 (28) | + | + | ||||
| Glucose | B6 > 129 (1) | + | + | |||||
| Fructose | B6 > 129 (1) | + | + | |||||
| Sugar alcohols | ||||||||
| Erythritol | B6 > 129 (10) | + | ||||||
| Sorbitol | B6 > 129 (10) | B6 > 129 (28) | + | |||||
| Glucose polymers | ||||||||
| Polycose | B6 > 129 (7, 54) | B6 > 129 (28) | − | − | ||||
| Maltooligosaccharide | B6 > 129 (1) | B6 > 129 (28) | − | − | ||||
| Amino acids | ||||||||
| d-Tryptophan | B6 > 129 (10) | + | + | + | ||||
| d-Phenylalanine | B6 > 129 (10) | B6 = 129 (28) | + | − | + | + | + | |
| l-Proline | B6 > 129 (10) | B6 > 129 (28) | + | + | − | |||
| l-Glutamine | B6 > 129 (1) | − | − | |||||
| l-Threonine | B6 > 129 (1) | B6 = 129 (28) | − | |||||
| l-Alanine | B6 > 129 (1) | B6 = 129 (28) | − | − | − | |||
| Glycine | B6 > 129 (10) | B6 = 129 (28) | − | − | − | − | − | |
| Nonsweet tastants | ||||||||
| NaCl | B6 < 129 (8) | B6 = 129 (28) | − | − | − | − | ||
| Quinine | B6 > 129 (8) | B6 = 129 (28) | − | − | − | − | ||
| HCl, citric acid | B6 > 129 (8) | B6 = 129 (28) | − | − | − | − | ||
| MSG | B6 > 129 (9) | B6 = 129 (26) | − | − | − | |||
| IMP | B6 > 129 (9) | B6 < 129 (26) | − | − | ||||
Signs<, >; and = indicate presence and direction of differences between inbred parental strains, B6 and 129.
Significant difference (+) or lack of significant difference (−) between mice with different Tas1r3 genotypes. If there was an effect of the Tas1r3 allelic variation, B6 allele always increased taste responsiveness.
Long-term 2-bottle tests: differences in taste solution intakes or preferences or taste sensitivity (assessed based on taste preference thresholds).
Electrophysiological recordings of integrated chorda tympani responses to lingual application of taste stimuli: differences in response magnitude or sensitivity (assessed based on response thresholds).
Licks, initial licking responses. It should be noted that at high concentrations of sucrose and SC-45647, 129 mice had higher lick rates than B6 mice (19, 24).
Data from present study.
Cells are blank if there are no data for a particular test and taste stimulus. Results for individual tastants are generally consistent among measures and experimental populations. Minor discrepancies in effects of Tas1r3 genotype on responses to d-phenylalanine and l-proline are probably due to weak chorda tympani responses to these stimuli, which lowers signal-to-noise ratios and decreases statistical power to detect genetic differences. As a result, we might have not been able to detect the effect of Tas1r3 genotype on chorda tympani responses to d-phenylalanine and l-proline in all experiments.
Differential Responsiveness of Congenic Mice to Sweeteners
We analyzed taste responses of 129.B6-Tas1r3 congenic mice to a diversity of sweeteners and glucose polymers, using three different measures: responses of the chorda tympani nerve, initial licking responses, and sweetener consumption in 48-h two-bottle preference tests. The results were generally consistent across the three measures of taste responsiveness (summarized in Tables 3 and 5). That is, Tas1r3 genotype influenced responses to several classes of sweeteners: the nonnutritive sweeteners (saccharin, acesulfame-K, sucralose, and SC-45647), sugars (sucrose, maltose, glucose, and fructose), sugar alcohols (erythritol and sorbitol), and several amino acids (d-tryptophan, d-phenylalanine, and l-proline). The B6 allele of the Tas1r3 gene was associated with higher sweet taste responsiveness and sensitivity. In contrast, we found that Tas1r3 genotype did not affect responses to glucose polymers (Polycose and maltooligosaccharide) and several sweet-tasting amino acids (l-glutamine, l-threonine, l-alanine, and glycine). These results are consistent with our previous study of Tas1r3 polymorphisms in B6 × 129 F2 hybrids (29) (summarized in Table 5). Thus allelic variation of the Tas1r3 gene affects taste responses to some but not all sweeteners.
Ligand Specificity of T1R3 Receptor
Some sequence variants of the Tas1r3 gene result in changes of amino acid sequence of the T1R3 protein, which may affect its ligand binding properties. The most likely functional Tas1r3 polymorphism corresponds to an amino acid substitution of isoleucine to threonine at position 60 (45, 52). In our analysis, we inferred that if a taste response to a sweetener is affected by the Tas1r3 genotype, then that sweetener must interact with a taste receptor involving T1R3.
Our data indicate that receptors involving T1R3 interact with a chemically diverse range of sweeteners. Some of these sweeteners (sucrose, maltose, glucose, fructose, saccharin, acesulfame-K, sucralose, guanidinacetic acid sweeteners similar to SC-45647, d-tryptophan, and d-phenylalanine) were shown to activate an in vitro system of heterologously expressed T1R2 and T1R3 proteins (37, 43, 44, 65). l-Proline activates heterologously expressed T1R1 and T1R3 proteins only when mixed with IMP, but not alone (43). Although there are no data on activation of T1R receptors in vitro by sugar alcohols (erythritol and sorbitol), our data indicate that they should activate a taste receptor involving T1R3.
Taste responses to Polycose, maltooligosaccharide, l-glutamine, l-threonine, l-alanine, and glycine were not affected by Tas1r3 genotype. This result could be explained by several mechanisms: 1) binding of these compounds to the T1R3 protein at a site that is not affected by the Tas1r3 polymorphisms, 2) binding to a partner protein (T1R1 or T1R2) of the heterodimeric T1R receptor, or 3) binding to a non-T1R taste receptor. While l-amino acids and glycine were shown to interact with T1R proteins in vitro (43), there are no data on activation of T1R receptors in vitro by Polycose or malto-oligosaccharide. These complex carbohydrates generate a taste that is distinct from that of sucrose (58), suggesting that this unique taste may be mediated by a non-T1R taste receptor.
Genetic Architecture of Sweet Taste Responsiveness
Our previous studies showed that allelic variation of the mouse Tas1r3 locus does not account for all of the genetically determined variation in taste responses to sweeteners. For example, the Tas1r3 genotype explained only 78% of genetic variation in saccharin preference among multiple inbred mouse strains (52). In the B6 × 129 F2 cross, the Tas1r3 genotype explained 64–96% of genetic variation in preference scores for different sweeteners, 10–35% of genetic variation in sweetener intakes, and 37–92% of genetic variation in chorda tympani responses to sweeteners (5, 29). This is consistent with multigenic inheritance of sweetener preferences shown in several earlier studies (6, 12, 39, 49, 51).
In this study, we found that B6/129 and 129/129 congenic mice have similar responses to Polycose, maltooligosaccharide, l-glutamine, l-threonine, l-alanine, and glycine in two-bottle tests, despite differential intakes and preferences in parental B6 and 129 strains (Tables 3 and 5). This suggests that the inbred strain differences in consumption of the glucose polymers, some l-amino acids, and glycine are determined by genes other than Tas1r3.
We designed this study to characterize the effects of the Tas1r3 genotype on sweet taste responses at different stages in the processing of taste information: activity in an afferent gustatory nerve, initial licking responses, and consumption over long-term tests. We found effects of Tas1r3 genotype that were generally consistent across all three stages of processing. For example, all measures detected an effect of Tas1r3 genotype on responses to saccharin and sucrose, but not to glycine (Tables 3 and 5).
At the same time, we found that the effects of Tas1r3 genotype depend on sweetener concentration in a manner specific to each experimental approach. Sweetener preference scores in the long-term tests and initial lick rates were affected by Tas1r3 genotype predominantly at lower, perithreshold concentrations. The effect of Tas1r3 genotype on sweetener intakes in the long-term tests tended to be strongest at higher, suprathreshold concentrations. Relative to the behavioral responses, chorda tympani nerve responses to sweeteners were predominantly affected by Tas1r3 genotype at even higher concentrations. We also observed a concentration-dependent effect of Tas1r3 genotype in our previous study using B6 × 129 F2 hybrids (29). In this cross, allelic variation of the Tas1r3 gene explained 35% of genetic variation in intake of 120 mM sucrose but only 10% of genetic variation in intake of 300 mM sucrose.
Overall, the effects of Tas1r3 genotype on behavioral responses to many sweeteners tend to be largest at low and intermediate concentrations but diminish as sweetener concentration increases. In contrast, the effects of Tas1r3 genotype on chorda tympani nerve responses are apparent across a wide range of sweetener concentrations. This suggests that the relative contribution of peripheral taste input to behavioral responses must decrease with increasing sweetener concentration. Behavioral responses to more potent sweetener solutions seem to increasingly depend on other mechanisms, which can override peripheral gustatory input. While these latter mechanisms are also under genetic control, we suspect that they largely depend on genes other than Tas1r3. These alternative genes may contribute, for example, to central motivational mechanisms activated by sweet taste (59) or postingestive feedback (60).
Concluding Remarks
We have shown that allelic variation of the Tas1r3 gene affects taste responses to many but not all sweet-tasting compounds. Our in vivo approach for characterizing ligand specificity of T1R3 allowed us to validate the findings of in vitro studies. Furthermore, our results indicate that Tas1r3 is not the only gene underlying strain differences in sweet taste responsiveness. It thus appears that the genetic architecture of sweet taste responsiveness changes depending on the type of taste response and the intensity of sweet taste stimuli.
Acknowledgments
We thank the following persons and organizations for providing us with sweeteners as gifts: Dr. Grant DuBois, The Coca-Cola Company, Atlanta, GA (SC-45647); Hoechst Food Ingredients, Edison, NJ (acesulfame-K); Hank Wong of M&C Sweeteners, Blair, NE (erythritol); and McNeil Specialty, New Brunswick, NJ (sucralose). We thank Dr. Stuart McCaughey for assistance with electrophysiological experiments.
Authors’ contributions were distributed as follows: planning the study (A. A. Bachmanov, G. K. Beauchamp, J. I. Glendinning, M. Inoue), breeding (A. A. Bachmanov, M. L. Theodorides) and genotyping (X. Li, N. Bosak) congenic mice, conducting two-bottle (A. A. Bachmanov, M. L. Theodorides) and lickometer (J. I. Glendinning, S. Harkness) tests, making electrophysiological recordings (M. Inoue), analyzing data (M. Inoue, J. I. Glendinning, A. A. Bachmanov), and drafting (J. I. Glendinning, A. A. Bachmanov) and editing (all authors) the manuscript.
GRANTS
This research was supported by National Institutes of Health Grants R01-DC-00882 (G. K. Beauchamp) and R01-AA-11028 (A. A. Bachmanov) and an Ajinomoto Amino Acid Research Program Focused Research Grant (A. A. Bachmanov).
Footnotes
Article published online before print. See web site for date of publication (http://physiolgenomics.physiology.org).
References
- 1.Bachmanov AA, Beauchamp GK. Amino acid and carbohydrate preferences in C57BL/6ByJ and 129P3/J mice. Physiol Behav. 2007 August 8; doi: 10.1016/j.physbeh.2007.07.016. [DOI] [PMC free article] [PubMed] [Google Scholar]
- 2.Bachmanov AA, Inoue M, Tordoff MG, Ninomiya Y, Beauchamp GK. Modification of behavioral and neural taste responses to NaCl in C57BL/6 mice: effects of NaCl exposure and DOCA treatment. Physiol Behav. 1999;65:817–822. doi: 10.1016/s0031-9384(98)00239-x. [DOI] [PMC free article] [PubMed] [Google Scholar]
- 3.Bachmanov AA, Li X, Reed DR, Ohmen JD, Li S, Chen Z, Tordoff MG, de Jong PJ, Wu C, West DB, Chatterjee A, Ross DA, Beauchamp GK. Positional cloning of the mouse saccharin preference (Sac) locus. Chem Senses. 2001;26:925–933. doi: 10.1093/chemse/26.7.925. [DOI] [PMC free article] [PubMed] [Google Scholar]
- 4.Bachmanov AA, Reed DR, Beauchamp GK, Tordoff MG. Food intake, water intake, and drinking spout side preference of 28 mouse strains. Behav Genet. 2002;32:435–443. doi: 10.1023/a:1020884312053. [DOI] [PMC free article] [PubMed] [Google Scholar]
- 5.Bachmanov AA, Reed DR, Ninomiya Y, Inoue M, Tordoff MG, Price RA, Beauchamp GK. Sucrose consumption in mice: major influence of two genetic loci affecting peripheral sensory responses. Mamm Genome. 1997;8:545–548. doi: 10.1007/s003359900500. [DOI] [PMC free article] [PubMed] [Google Scholar]
- 6.Bachmanov AA, Reed DR, Tordoff MG, Price RA, Beauchamp GK. Intake of ethanol, sodium chloride, sucrose, citric acid, and quinine hydrochloride solutions by mice: a genetic analysis. Behav Genet. 1996;26:563–573. doi: 10.1007/BF02361229. [DOI] [PMC free article] [PubMed] [Google Scholar]
- 7.Bachmanov AA, Reed DR, Tordoff MG, Price RA, Beauchamp GK. Nutrient preference and diet-induced adiposity in C57BL/6ByJ and 129P3/J mice. Physiol Behav. 2001;72:603–613. doi: 10.1016/s0031-9384(01)00412-7. [DOI] [PMC free article] [PubMed] [Google Scholar]
- 8.Bachmanov AA, Tordoff MG, Beauchamp GK. Ethanol consumption and taste preferences in C57BL/6ByJ and 129/J mice. Alcohol Clin Exp Res. 1996;20:201–206. doi: 10.1111/j.1530-0277.1996.tb01630.x. [DOI] [PMC free article] [PubMed] [Google Scholar]
- 9.Bachmanov AA, Tordoff MG, Beauchamp GK. Intake of umami-tasting solutions by mice: a genetic analysis. J Nutr. 2000;130:935S–941S. doi: 10.1093/jn/130.4.935S. [DOI] [PMC free article] [PubMed] [Google Scholar]
- 10.Bachmanov AA, Tordoff MG, Beauchamp GK. Sweetener preference of C57BL/6ByJ and 129P3/J mice. Chem Senses. 2001;26:905–913. doi: 10.1093/chemse/26.7.905. [DOI] [PMC free article] [PubMed] [Google Scholar]
- 11.Bufe B, Breslin PA, Kuhn C, Reed DR, Tharp CD, Slack JP, Kim UK, Drayna D, Meyerhof W. The molecular basis of individual differences in phenylthiocarbamide and propylthiouracil bitterness perception. Curr Biol. 2005;15:322–327. doi: 10.1016/j.cub.2005.01.047. [DOI] [PMC free article] [PubMed] [Google Scholar]
- 12.Capeless CG, Whitney G. The genetic basis of preference for sweet substances among inbred strains of mice: preference ratio phenotypes and the alleles of the Sac and dpa loci. Chem Senses. 1995;20:291–298. doi: 10.1093/chemse/20.3.291. [DOI] [PubMed] [Google Scholar]
- 13.Damak S, Rong M, Yasumatsu K, Kokrashvili Z, Varadarajan V, Zou S, Jiang P, Ninomiya Y, Margolskee RF. Detection of sweet and umami taste in the absence of taste receptor T1r3. Science. 2003;301:850–853. doi: 10.1126/science.1087155. [DOI] [PubMed] [Google Scholar]
- 14.Danilova V, Hellekant G. Comparison of the responses of the chorda tympani and glossopharyngeal nerves to taste stimuli in C57BL/6J mice. BMC Neurosci. 2003;4:5. doi: 10.1186/1471-2202-4-5. [DOI] [PMC free article] [PubMed] [Google Scholar]
- 15.Davis JD. The effectiveness of some sugars in stimulating licking behavior in the rat. Physiol Behav. 1973;11:39–45. doi: 10.1016/0031-9384(73)90120-0. [DOI] [PubMed] [Google Scholar]
- 16.Davis JD. Some new developments in the understanding of oropharyngeal and postingestional controls of meal size. Nutrition. 1999;15:32–39. doi: 10.1016/s0899-9007(98)00109-9. [DOI] [PubMed] [Google Scholar]
- 17.Davis JD, Collins BJ, Levine MW. Peripheral control of drinking: gastrointestinal filling as a negative feedback signal, a theoretical and experimental analysis. J Comp Physiol Psychol. 1975;89:985–1002. doi: 10.1037/h0077184. [DOI] [PubMed] [Google Scholar]
- 18.Davis JD, Levine MW. A model for the control of ingestion. Psychol Rev. 1977;84:379–412. [PubMed] [Google Scholar]
- 19.Dotson CD, Spector AC. The relative affective potency of glycine, l-serine and sucrose as assessed by a brief-access taste test in inbred strains of mice. Chem Senses. 2004;29:489–498. doi: 10.1093/chemse/bjh051. [DOI] [PubMed] [Google Scholar]
- 20.Eylam S, Spector AC. Stimulus processing of glycine is dissociable from that of sucrose and glucose based on behaviorally measured taste signal detection in Sac “taster” and “non-taster” mice. Chem Senses. 2004;29:639–649. doi: 10.1093/chemse/bjh068. [DOI] [PubMed] [Google Scholar]
- 21.Frank ME, Blizard DA. Chorda tympani responses in two inbred strains of mice with different taste preferences. Physiol Behav. 1999;67:287–297. doi: 10.1016/s0031-9384(99)00071-2. [DOI] [PubMed] [Google Scholar]
- 22.Fuller JL. Single-locus control of saccharin preference in mice. J Hered. 1974;65:33–36. doi: 10.1093/oxfordjournals.jhered.a108452. [DOI] [PubMed] [Google Scholar]
- 23.Glendinning JI, Bloom LD, Onishi M, Zheng KH, Damak S, Margolskee RF, Spector AC. Contribution of alpha-gustducin to taste-guided licking responses of mice. Chem Senses. 2005;30:299–316. doi: 10.1093/chemse/bji025. [DOI] [PubMed] [Google Scholar]
- 24.Glendinning JI, Chyou S, Lin I, Onishi M, Patel P, Zheng KH. Initial licking responses of mice to sweeteners: effects of Tas1r3 polymorphisms. Chem Senses. 2005;30:601–614. doi: 10.1093/chemse/bji054. [DOI] [PubMed] [Google Scholar]
- 25.Glendinning JI, Gresack J, Spector AC. A high-throughput screening procedure for identifying mice with aberrant taste and oromotor function. Chem Senses. 2002;27:461–474. doi: 10.1093/chemse/27.5.461. [DOI] [PubMed] [Google Scholar]
- 26.Inoue M, Beauchamp GK, Bachmanov AA. Gustatory neural responses to umami taste stimuli in C57BL/6ByJ and 129P3/J mice. Chem Senses. 2004;29:789–795. doi: 10.1093/chemse/bjh083. [DOI] [PMC free article] [PubMed] [Google Scholar]
- 27.Inoue M, Li X, McCaughey SA, Beauchamp GK, Bachmanov AA. Soa genotype selectively affects mouse gustatory neural responses to sucrose octaacetate. Physiol Genomics. 2001;5:181–186. doi: 10.1152/physiolgenomics.2001.5.4.181. [DOI] [PMC free article] [PubMed] [Google Scholar]
- 28.Inoue M, McCaughey SA, Bachmanov AA, Beauchamp GK. Whole nerve chorda tympani responses to sweeteners in C57BL/6ByJ and 129P3/J mice. Chem Senses. 2001;26:915–923. doi: 10.1093/chemse/26.7.915. [DOI] [PMC free article] [PubMed] [Google Scholar]
- 29.Inoue M, Reed DR, Li X, Tordoff MG, Beauchamp GK, Bachmanov AA. Allelic variation of the Tas1r3 taste receptor gene selectively affects behavioral and neural taste responses to sweeteners in the F2 hybrids between C57BL/6ByJ and 129P3/J mice. J Neurosci. 2004;24:2296–2303. doi: 10.1523/JNEUROSCI.4439-03.2004. [DOI] [PMC free article] [PubMed] [Google Scholar]
- 30.Inoue M, Tordoff MG. Calcium deficiency alters chorda tympani nerve responses to oral calcium chloride. Physiol Behav. 1998;63:297–303. doi: 10.1016/s0031-9384(97)00387-9. [DOI] [PubMed] [Google Scholar]
- 31.Kitagawa M, Kusakabe Y, Miura H, Ninomiya Y, Hino A. Molecular genetic identification of a candidate receptor gene for sweet taste. Biochem Biophys Res Commun. 2001;283:236–242. doi: 10.1006/bbrc.2001.4760. [DOI] [PubMed] [Google Scholar]
- 32.Levine AS, Billington CJ. Why do we eat? A neural systems approach. Annu Rev Nutr. 1997;17:597–619. doi: 10.1146/annurev.nutr.17.1.597. [DOI] [PubMed] [Google Scholar]
- 33.Levine AS, Kotz CM, Gosnell BA. Sugars: hedonic aspects, neuroregulation, and energy balance. Am J Clin Nutr. 2003;78:834S–842S. doi: 10.1093/ajcn/78.4.834S. [DOI] [PubMed] [Google Scholar]
- 34.Lewis SR, Ahmed S, Dym C, Khaimova E, Kest B, Bodnar RJ. Inbred mouse strain survey of sucrose intake. Physiol Behav. 2005;85:546–556. doi: 10.1016/j.physbeh.2005.06.003. [DOI] [PubMed] [Google Scholar]
- 35.Li X, Bachmanov AA, Li S, Chen Z, Tordoff MG, Beauchamp GK, de Jong PJ, Wu C, Chen L, West DB, Ross DA, Ohmen JD, Reed DR. Genetic, physical and comparative map of the subtelomeric region of mouse chromosome 4. Mamm Genome. 2002;13:5–19. doi: 10.1007/s0033501-2109-8. [DOI] [PMC free article] [PubMed] [Google Scholar]
- 36.Li X, Inoue M, Reed DR, Huque T, Puchalski RB, Tordoff MG, Ninomiya Y, Beauchamp GK, Bachmanov AA. High-resolution genetic mapping of the saccharin preference locus (Sac) and the putative sweet taste receptor (T1R1) gene (Gpr70) to mouse distal Chromosome 4. Mamm Genome. 2001;12:13–16. doi: 10.1007/s003350010236. [DOI] [PMC free article] [PubMed] [Google Scholar]
- 37.Li X, Staszewski L, Xu H, Durick K, Zoller M, Adler E. Human receptors for sweet and umami taste. Proc Natl Acad Sci USA. 2002;99:4692–4696. doi: 10.1073/pnas.072090199. [DOI] [PMC free article] [PubMed] [Google Scholar]
- 38.Lush IE. The genetics of tasting in mice. VI. Saccharin, acesulfame, dulcin and sucrose. Genet Res. 1989;53:95–99. doi: 10.1017/s0016672300027968. [DOI] [PubMed] [Google Scholar]
- 39.Lush IE, Hornigold N, King P, Stoye JP. The genetics of tasting in mice. VII. Glycine revisited, and the chromosomal location of Sac and Soa. Genet Res. 1995;66:167–174. doi: 10.1017/s0016672300034510. [DOI] [PubMed] [Google Scholar]
- 40.Max M, Shanker YG, Huang L, Rong M, Liu Z, Campagne F, Weinstein H, Damak S, Margolskee RF. Tas1r3, encoding a new candidate taste receptor, is allelic to the sweet responsiveness locus . Sac Nat Genet. 2001;28:58–63. doi: 10.1038/ng0501-58. [DOI] [PubMed] [Google Scholar]
- 41.Miyasaka A, Imoto T. Electrophysiological characterization of the inhibitory effect of a novel peptide gurmarin on the sweet taste response in rats. Brain Res. 1995;676:63–68. doi: 10.1016/0006-8993(95)00086-6. [DOI] [PubMed] [Google Scholar]
- 42.Montmayeur JP, Liberles SD, Matsunami H, Buck LB. A candidate taste receptor gene near a sweet taste locus. Nat Neurosci. 2001;4:492–498. doi: 10.1038/87440. [DOI] [PubMed] [Google Scholar]
- 43.Nelson G, Chandrashekar J, Hoon MA, Feng L, Zhao G, Ryba NJ, Zuker CS. An amino-acid taste receptor. Nature. 2002;416:199–202. doi: 10.1038/nature726. [DOI] [PubMed] [Google Scholar]
- 44.Nelson G, Hoon MA, Chandrashekar J, Zhang Y, Ryba NJ, Zuker CS. Mammalian sweet taste receptors. Cell. 2001;106:381–390. doi: 10.1016/s0092-8674(01)00451-2. [DOI] [PubMed] [Google Scholar]
- 45.Nie Y, Vigues S, Hobbs JR, Conn GL, Munger SD. Distinct contributions of T1R2 and T1R3 taste receptor subunits to the detection of sweet stimuli. Curr Biol. 2005;15:1948–1952. doi: 10.1016/j.cub.2005.09.037. [DOI] [PubMed] [Google Scholar]
- 46.Ninomiya Y, Bachmanov AA, Yatabe A, Beauchamp GK. NaCl-preferring NZB/B1NJ mice and NaCl-avoiding CBA/J mice have similar amiloride inhibition of chorda tympani responses to NaCl. Chem Senses. 1998;23:411–415. doi: 10.1093/chemse/23.4.411. [DOI] [PMC free article] [PubMed] [Google Scholar]
- 47.Ninomiya Y, Funakoshi M. Peripheral neural basis for behavioural discrimination between glutamate and the four basic taste substances in mice. Comp Biochem Physiol A. 1989;92:371–376. doi: 10.1016/0300-9629(89)90578-1. [DOI] [PubMed] [Google Scholar]
- 48.Ninomiya Y, Kajiura H, Mochizuki K. Differential taste responses of mouse chorda tympani and glossopharyngeal nerves to sugars and amino acids. Neurosci Lett. 1993;163:197–200. doi: 10.1016/0304-3940(93)90381-t. [DOI] [PubMed] [Google Scholar]
- 49.Phillips TJ, Crabbe JC, Metten P, Belknap JK. Localization of genes affecting alcohol drinking in mice. Alcohol Clin Exp Res. 1994;18:931–941. doi: 10.1111/j.1530-0277.1994.tb00062.x. [DOI] [PubMed] [Google Scholar]
- 50.Ramirez I. Why do sugars taste good? Neurosci Biobehav Rev. 1990;14:125–134. doi: 10.1016/s0149-7634(05)80213-1. [DOI] [PubMed] [Google Scholar]
- 51.Ramirez I, Fuller JL. Genetic influence on water and sweetened water consumption in mice. Physiol Behav. 1976;16:163–168. doi: 10.1016/0031-9384(76)90300-0. [DOI] [PubMed] [Google Scholar]
- 52.Reed DR, Li S, Li X, Huang L, Tordoff MG, Starling-Roney R, Taniguchi K, West DB, Ohmen JD, Beauchamp GK, Bachmanov AA. Polymorphisms in the taste receptor gene (Tas1r3) region are associated with saccharin preference in 30 mouse strains. J Neurosci. 2004;24:938–946. doi: 10.1523/JNEUROSCI.1374-03.2004. [DOI] [PMC free article] [PubMed] [Google Scholar]
- 53.Sainz E, Korley JN, Battey JF, Sullivan SL. Identification of a novel member of the T1R family of putative taste receptors. J Neurochem. 2001;77:896–903. doi: 10.1046/j.1471-4159.2001.00292.x. [DOI] [PubMed] [Google Scholar]
- 54.Sclafani A. Enhanced sucrose and Polycose preference in sweet “sensitive” (C57BL/6J) and “subsensitive” (129P3/J) mice after experience with these saccharides. Physiol Behav. 2006;87:745–756. doi: 10.1016/j.physbeh.2006.01.016. [DOI] [PubMed] [Google Scholar]
- 55.Sclafani A. Fat and sugar flavor preference and acceptance in C57BL/6J and 129 mice: experience attenuates strain differences. Physiol Behav. 2007;90:602–611. doi: 10.1016/j.physbeh.2006.11.012. [DOI] [PubMed] [Google Scholar]
- 56.Sclafani A. Oral and postoral determinants of food reward. Physiol Behav. 2004;81:773–779. doi: 10.1016/j.physbeh.2004.04.031. [DOI] [PubMed] [Google Scholar]
- 57.Sclafani A. Post-ingestive positive controls of ingestive behavior. Appetite. 2001;36:79–83. doi: 10.1006/appe.2000.0370. [DOI] [PubMed] [Google Scholar]
- 58.Sclafani A. The sixth taste? Appetite. 2004;43:1–3. doi: 10.1016/j.appet.2004.03.007. [DOI] [PubMed] [Google Scholar]
- 59.Sclafani A. Sucrose motivation in sweet “sensitive” (C57BL/6J) and “subsensitive” (129P3/J) mice measured by progressive ratio licking. Physiol Behav. 2006;87:734–744. doi: 10.1016/j.physbeh.2006.01.017. [DOI] [PubMed] [Google Scholar]
- 60.Sclafani A, Glendinning JI. Sugar and fat conditioned flavor preferences in C57BL/6J and 129 mice: oral and postoral interactions. Am J Physiol Regul Integr Comp Physiol. 2005;289:R712–R720. doi: 10.1152/ajpregu.00176.2005. [DOI] [PubMed] [Google Scholar]
- 61.Shingai T, Beidler LM. Response characteristics of three taste nerves in mice. Brain Res. 1985;335:245–249. doi: 10.1016/0006-8993(85)90476-7. [DOI] [PubMed] [Google Scholar]
- 62.Smith JC, Davis JD. Lack of an order effect in brief contact taste tests with closely spaced test trials. Physiol Behav. 1992;52:1107–1111. doi: 10.1016/0031-9384(92)90467-g. [DOI] [PubMed] [Google Scholar]
- 63.Spector AC. Psychophysical evaluation of taste function in nonhuman mammals. In: Doty RL, editor. Handbook of Olfaction and Gustation. New York: Dekker; 2003. pp. 861–879. [Google Scholar]
- 64.Swithers-Mulvey SE, Miller GL, Hall WG. Habituation of oromotor responding to oral infusions in rat pups. Appetite. 1991;17:55–67. doi: 10.1016/0195-6663(91)90084-6. [DOI] [PubMed] [Google Scholar]
- 65.Xu H, Staszewski L, Tang H, Adler E, Zoller M, Li X. Different functional roles of T1R subunits in the heteromeric taste receptors. Proc Natl Acad Sci USA. 2004;101:14258–14263. doi: 10.1073/pnas.0404384101. [DOI] [PMC free article] [PubMed] [Google Scholar]
- 66.Young P, Trafton C. Activity contour maps as related to preference in four gustatory stimulus areas of the rat. J Comp Physiol Psychol. 1964;58:68–75. doi: 10.1037/h0044823. [DOI] [PubMed] [Google Scholar]
- 67.Zhao GQ, Zhang Y, Hoon MA, Chandrashekar J, Erlenbach I, Ryba NJ, Zuker CS. The receptors for mammalian sweet and umami taste. Cell. 2003;115:255–266. doi: 10.1016/s0092-8674(03)00844-4. [DOI] [PubMed] [Google Scholar]