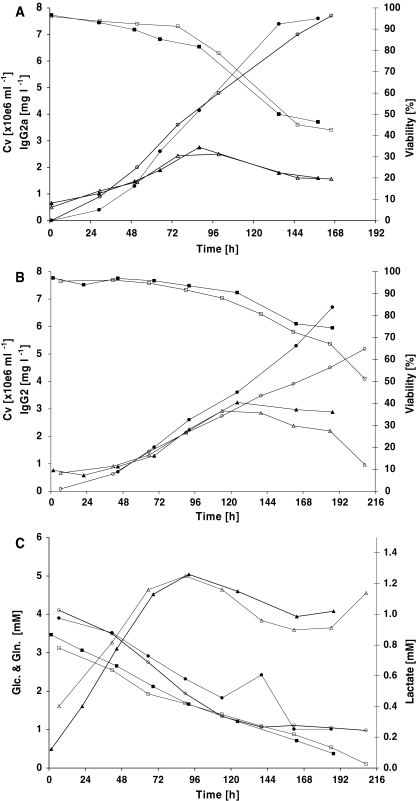
Fig. 4.
Transfection of 50 L HEK293-EBNA cells cultured in a 50 L (a) and 100 L (b) stirred tank bioreactor. In two experiments (open symbols experiment 1, closed symbols experiment 2) cells were seeded from a seeding bioreactor at a density of 1 × 10⁶ cells mL−1. Two hours later the cultures were transfected and after an additional 4 h the cultures were fed to the final culture volume. IgG concentrations (○●) were determined by ELISA and the viable cell concentration (△▲) and viability (□■) were assessed using a Cedex automatic cell counter. (c) Shows the glucose (□■), lactate (△▲) and glutamine (○●) concentration monitored for the two 100 L cultures

