Abstract
Anoikis is a specific form of apoptosis resulting from the loss of cellular attachment to extracellular matrix or other cells. Challenges in simulating these conditions in vitro make it difficult to generate a controlled, efficient assay to study anoikis. We developed a microscale method for analysis and quantification of anoikis using micromolded, non-adhesive hydrogels. These hydrogels allow for isolation and observation of single, unattached cells in an ordered array, and controlled distribution. Cell distributions resulting from multiple seeding densities were compared to a mathematical probability model. Normal human fibroblasts, human umbilical vein endothelial cells, and Mandin-Darby canine kidney epithelial cells were seeded at low densities of approximately one cell/well. Because the hydrogel is made of non-adhesive agarose, attachment was negligible. Survival was monitored using fluorescent microscopy, and quantified by image analysis. The attachment and proliferative potential of cells after being held in a non-adherent environment was assessed with a companion attachment assay. The data from both methods revealed that cells were able to survive much longer than expected without attachment. When tested with H35 rat hepatoma cells we showed that single cancer cells could grow into three-dimensional spheroids, demonstrating the utility of this method in understanding the role of anoikis in cancer.
Keywords: Anoikis, Micromold, Hydrogel, Microtissue, Microtumor
Introduction
Anoikis is a specific type of apoptosis resulting from loss of attachment to the extracellular matrix (ECM) and/or other cells (Meredith et al. 1993; Frisch and Francis 1994; Hermiston and Gordon 1995; Fouquet et al. 2004). Meredith et al. observed that connection to ECM was required for survival, showing that human umbilical vein endothelial cells (HUVECs) died when cultured in an agarose dish which prevented cell-matrix attachment (Meredith et al. 1993). Frisch and Francis confirmed these results in Mandin-Darby Canine Kidney epithelial cells (MDCK) cultured in poly-(hydroxymethyl methacrylate) (polyHEMA) coated Petri dishes, and designated the phenomenon “anoikis” (Frisch and Francis 1994). Subsequent studies reported anoikis in epidermal skin cells, colonic epithelial tissue, mammary cells, skeletal muscle cells, minimally tumorigenic melanoma cells, and embryonic fibroblasts, implicating the phenomenon in many physiological systems and pathologies (Polakowska et al. 1994; Hall et al. 1994; Boudrea et al. 1995; Vachon et al. 1996; Montgomery et al. 1994; Hungerford et al. 1996; Grossman 2002).
Anoikis mediates cell death to maintain homeostasis in tissues with high cyclic renewal rates. For example, intestinal epithelial cells and keratinocytes constantly undergo anoikis to replace tissue (Fouquet et al. 2004; McGill et al. 1997). Further, it regulates key events in embryogenesis such as limb formation and gland involution (Grossman 2002; Hu et al. 2001) Resistance to anoikis is a path to neoplasia, whereby growth continues unchecked and metastasis is promoted (Frisch and Francis 1994; Dourma et al. 2004; Meredith and Schwartz 1997).
Numerous methods for preventing cellular attachment have been developed for the study of anoikis. To date, all involve coating tissue culture flasks with non-adherent surfaces, subjecting cells to detachment-induced apoptosis. These surfaces include agarose, polyHEMA, or commercially available ultra-low attachment plastics (Meredith et al. 1993; Frisch and Francis 1994; Rosen et al. 2000; Ito et al. 2004; Cheng et al. 2004). Because of the large number of cells required for DNA fragmentation assays, PCR, or ELSIA kits, it is difficult for conventional analysis to examine the effects of anoikis on single cells (Meredith et al. 1993; Frisch and Francis 1994; Rosen et al. 2000; Cheng et al. 2004; Korff and Augustin 1998). Thus, few studies have modeled the kinetics of anoikis for individual cells—only for populations of detached cells at minimal intervals. Although several methods have been developed to observe individual cells, none have studied anoikis from this perspective (Ito et al. 2004; Cheng et al. 2004; Korff and Augustin 1998; Voldman 2006; Rettig and Folch 2005; Khademhosseini et al. 2005; Lovchik et al. in press; Sims and Allbritton 2007).
Anoikis is thought to occur rapidly—researchers have found that the process begins as soon as 3 h after isolation from ECM and the majority of HUVEC or MDCK cells die from 8 to 48 h after isolation (Meredith et al. 1993; Frisch and Francis 1994; Cheng et al. 2004; Cardone et al. 1997; Aoudijit and Vuori 2001). Currently there is no standardized measure, such as a cell half-life, used by all anoikis investigators.
To address the shortcomings of current methods, we developed a microscale method to easily partition single cells into individual wells where they are kept in a non-adherent state and anoikis can be observed and quantified. Micromolded agarose, a hydrogel well known as non-adhesive for cells, provides a platform which can be used to isolate large numbers of individual cells (Napolitano et al. 2007; Napolitano et al. 2007). Anoikis and cell survival were quantified with two independent assays, providing important insight into the kinetics of anoikis.
Methods
Design, fabrication, and casting of micro-molds
Molds were designed using computer-assisted design (CAD) (Solid Works Corporation—Concord, MA). Wax molds from the CAD files were produced with a ThermoJet® rapid prototyping machine (3D Systems Corporation—Valencia, CA).
Wax molds were covered with reprorubber® synthetic casting material (16116, Flexbar Machine Corporation—Islandia, NY), which was removed after it solidified, creating a negative replica of the gel. This was then sprayed with epoxy parfilm release agent (16136, Flexbar), filled with polydimethylsiloxane (PDMS; Dow Corning—Midland, MD) and cured at 95 °C for 2 h. The PDMS positive replicate was then removed from the reprorubber® and cured for an additional hour.
Agarose gels were cast from PDMS molds. Powder Ultrapure© Agarose (15510-027, Invitrogen—Carlsbad, CA) was sterilized by autoclaving, and dissolved via heating in sterile water to 2% (weight/volume). 2.75 mL/mold was pipetted into each PDMS mold and air bubbles were removed via pipette suction or agitation with a sterile spatula. After setting, gels were separated from the mold using a spatula, transferred to six well tissue culture plates, and equilibrated overnight with tissue culture medium.
Cell culture and isolation
Normal human fibroblasts (NHF) derived from neonatal foreskins and Mandin-Darby Canine Kidney Epithelial cells (MDCK) (CCL-34, American Type Tissue Collection—Manassas, VA) and H35 rat hepatoma (provided by Martin Yarmush, Massachusetts General Hospital, Boston, MA) were expanded in Dulbecco’s Modified Eagle Medium (DMEM; 11995-099, Invitrogen – Carlsbad, CA) supplemented with 10% fetal bovine serum (FBS; SV3001403HI, Thermo Fisher Scientific—Waltham, MA) and 1% penicillin/streptomycin (P4333, Sigma—St. Louis, MO). Human umbilical vein endothelial cells (HUVEC) (Cambrex—Walkersville, MD) were expanded in Endothelial Growth Medium two (EGM-2) (CC-3126, Cambrex). NHF were maintained in a 37 °C, 10% CO2 atmosphere and HUVEC, MDCK, and H35 were maintained in at 37 °C, 5% CO2.
Cells were trypsinized, counted and re-suspended to the desired cell density of approximately 822 cells/300 μL. 300 μL of cell suspension were then pippetted into the rectangular recess of each gel. Samples were then incubated for 1.5 h before 3 mL of medium was added. Medium was exchanged every other day.
Seeding of micromolded hydrogels and cell viability assays
Micromolded hydrogels were seeded with varying concentrations of NHFs and the resulting cell distribution (1, 2, or 3 cells/well) was counted. In three replicates, gels were seeded at one, two, and three cells/well (822, 1644, and 2466 cells/gel, respectively). Each recess was observed by bright-field microscopy and the number of cells (in each well) was recorded. Results were compared to the Poisson distribution:
 |
i: the number of cells per well, Pi: proportion of wells with i cells, m: cell:well seeding density
Representative bright-field images were obtained using an Olympus IX70 microscope (Olympus—Center Valley, PA) equipped with an AxioCam MRc camera (Carl Zeiss MicroImaging, Inc.—Thornwood, NY). Cell viability was assessed with LIVE/DEAD® Viability/Cytotoxicity Kit (L3224, Invitrogen—Carlsbad, CA) staining. LIVE/DEAD solutions were made one day before experimentation began, aliquoted into smaller containers, and frozen at −20 °C. One vial was thawed and used per experiment day. Medium was removed, hydrogels were rinsed once with 3 mL of phosphate buffered saline (PBS; P4417, Sigma—St. Louis, MO), and 300 μL of PBS containing 2 μM calcein-AM and 4 μM ethidium homodimer (LIVE/DEAD® Viability/Cytotoxicity Kit) was added to the seeding chamber. Plates were protected from light and incubated at room temperature for 30 min.
Cell attachment assay
Cells were isolated within the non-adhesive hydrogel at the initial time point at an approximate density of one cell per well using the previously described method. The outside portion of each gel was then removed using a sterile scalpel, leaving only the square recess containing the micromolded wells. This was inverted into a PDMS insert within a six well polystyrene tissue culture plate. A small amount of tissue culture media was added to the insert to ensure a liquid interface between the plastic and the hydrogel. The gel was centrifuged at 800 rpm for 6 min to remove the cells and incubated at 37 °C for approximately 24 h.
Cell attachment and viability was assessed with Calcein-AM (C3100MP, Invitrogen—Carlsbad, CA) staining. Medium was removed, plates were rinsed once with 3 mL of phosphate buffered saline supplemented with 100 mg CaCl2 and 100 mg MgCl2·6H2O (complete PBS; Sigma—St. Louis, MO), and 300 μL of complete PBS at a calcein-AM concentration of 1 μL/mL was added. Plates were protected from light and incubated at room temperature for 30 min. Closely oriented cells may have resulted from cell division or multiple cells in the same well. The number of attached, calcein-positive cells at each time point was noted.
Image acquisition and processing
Bright-field and fluorescent images were obtained using an Olympus IX70 microscope (Olympus—Center Valley, PA) equipped with an AxioCam MRc camera (Carl Zeiss MicroImaging, Inc.—Thornwood, NY). The maximum number of distinct, non-overlapping images were captured using a 1.25× objective and approximately 650 of the 800 wells (80%) were observed. At each position, a bright field image and a green and red fluorescent image (live/dead assay) or a bright field and green fluorescent image (attachment assay) were captured at a uniform exposure time.
Pixel intensity histogram equalization of captured images was preformed using the levels function in Adobe Photoshop (Adobe Corporation—San Jose, CA). Calcein-positive or ethidium homodimer-positive signals were optimally highlighted in two ways. The white point threshold level was decreased, thereby increasing the intensity of the cellular signal, while the black point threshold level was increased, thereby removing image background. Live and dead images were analyzed separately. Edited images were saved in grayscale.
Grayscale images were opened using ImageJ (National Institute of Health, Bethesda, MD) and threshold levels were again adjusted to highlight the cellular signal. The resultant image showed a black cellular signal with a white background. The imageJ Analyze Particles function was used to quantify the viable cellular signals in each method. This command measures the size of binary particles within an image. For the live/dead assay, particles within a diameter range of 10–60 microns were counted to generate survival curves. For the cell attachment assay, all particles except those in very close proximity were counted. Based on empirical data it was assumed that any signal within 25 μm of another signal resulted from proliferation of a single cell. Therefore, closely oriented particles were counted as a single event.
Microtumor growth assay
H35 rat hepatoma cells were isolated as single cells within the hydrogel. Cells were trypsinized, counted and re-suspended to the desired cell density of approximately 822 cells/300 μL. 300 μL of cell suspension were then pipetted into the rectangular recess of each gel. Samples were then incubated for 1.5 h before 3 mL of medium was added. Medium was exchanged every other day.
Images were captured from the perimeter of a sample gel daily such that the same wells could be observed throughout the experiment. Mean spheroid size was determined daily for approximately 100 cells using image analysis.
Results and discussion
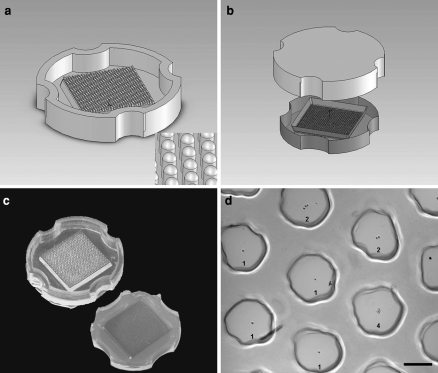
Micromolded agarose, a non-adhesive hydrogel, was used to induce anoikis by isolating individual cells and preventing their attachment to a substrate (Fig. 1). Micromolds were designed using computer-assisted design and printed using a rapid prototyping machine. The wax mold was duplicated in polydimethylsiloxane (PDMS) and molten agarose was poured over the array of round-topped pegs, allowed to gel, then removed from the mold. Each well in the agarose had a concave bottom, was 400 μm in diameter, and 800 μm deep with ∼271 wells/cm2. A micromold designed for use in a standard 6 well plate had a seeding area of 3.04 cm2 and 822 wells (Fig. 2).
Fig. 1.
Schematic summary of anoikis assay methods. Agarose hydrogels were fabricated from micromolds (shown in cross section), creating a non-adhesive surface with hundreds of small recesses. Small numbers of cells were seeded over the hydrogel, causing individual cells to be isolated at the bottom of recesses. Cells were cultured in a non-adherent state for a period of time ranging from 0 to 7 days. Then, one of two companion methods was conducted on the population of cells. In one method, the cell array was stained for viability and the number of live and dead cells were counted by image analysis. Alternatively, the gel was inverted and cells were allowed to settle on a polystyrene surface. After 24 h, the number of attached calcein-positive cells and/or cell colonies were counted by image analysis
Fig. 2.
Hydrogel casting methods. (a) Computer aided design of the wax mold for the non-adhesive hydrogel. Inset: A close up of the 400 micron pegs. (b) Agarose was poured into a PDMS replicate of the wax mold, shown in image (c), and removed once the agarose had solidified. The resulting gel, seeded with cells at low density, is shown in image (d). The numbers indicate the number of cells settled to the bottom of each recess. This image contains four single-cell wells (denoted by “1”), two double-cell wells (“2”), and one quadruple-cell well (“4”). Scale bar is 200 μm
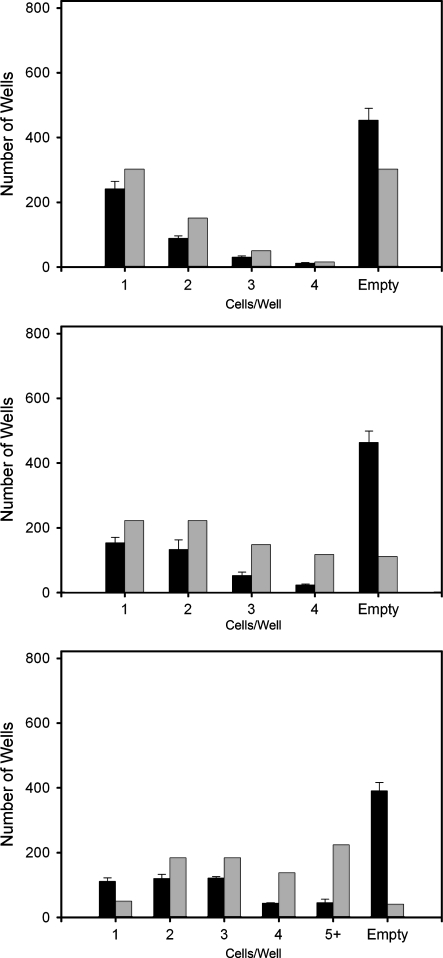
To assess the effects of varying the cell seeding density, micromolded hydrogels were seeded in triplicates with 822, 1644, or 2466 NHFs, resulting in seeding ratios of 1 cell/recess, 2 cells/recess, and 3 cells/recess, respectively. The number of cells per well were counted and compared to a Poisson distribution, a discrete probability describing the likelihood that a certain event will occur over a known space or period of time (Fig. 3). Since cells distribute simply by falling into each well, and both cells and wells are independent of their neighbors, we wanted to determine if the Poisson distribution was applicable. It was assumed that cellular particles would behave similarly regardless of cell type. Therefore, the cell distribution model was evaluated only for NHFs. Statistically significant agreement was observed for 1:1 seeding density, but not at greater densities. It is unclear why a Poisson distribution was not observed at higher seeding densities. Geometric limitations of the gel, such as the relatively large size of recesses and the amount of the dead space between wells may account for the discrepancies. One cell/well events, where anoikis would occur, were maximized by seeding 822 cells. This seeding density was used for subsequent experiments. Further research is necessary to optimize the system for multiple-cell events.
Fig. 3.
Cell distribution in gel wells as a function of seeding density. The number of wells containing n cells is plotted (from top to bottom) for initial seeding densities of 822, 1,644, and 2,466 cells. Experimentally observed data (black bars); predictions based on probability theory (gray bars)
An advantage to the use of agarose is its optical transparency. Additionally, the ordered microarray allows repeatable imaging of a specific location. To document the characteristic cellular morphology associated with apoptosis induced by anoikis, a single isolated HUVEC was observed over a five-day period (Fig. 4). Membrane blebbing was observed after three days, and continued on days four and five. This cell was representative of the total population and demonstrated our ability to observe a single, non-adherent cell over a period of several days. Other cells continued morphology changes and disintegrated into apoptotic bodies (data not shown).
Fig. 4.
Apoptotic morphology of a single HUVEC cell in anoikis over time. Brightfield images of (a) zero (b) three (c) four, and (d) five days in a non-adherent state. Scale bars are 200 μm
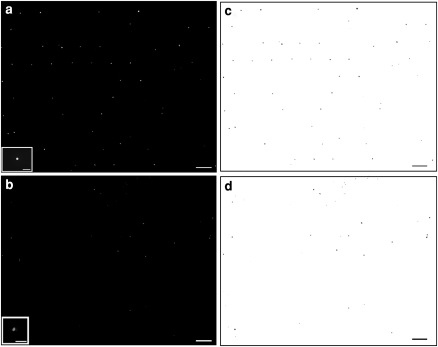
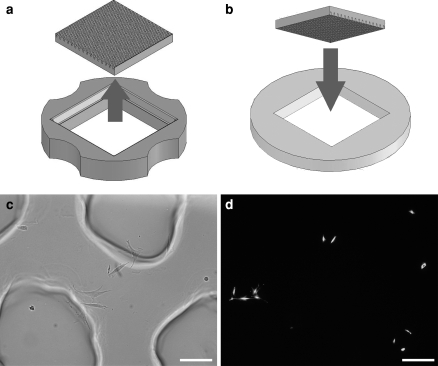
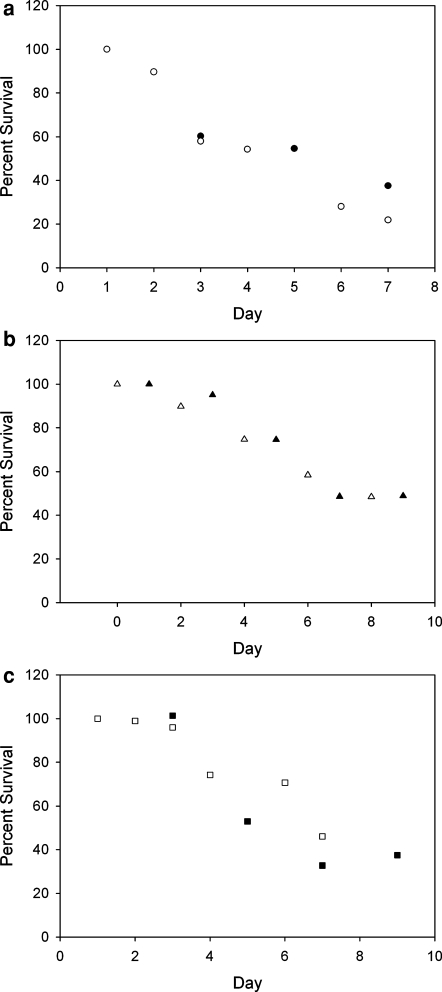
To measure the rate of anoikis in large numbers of cells NHF, HUVEC, and MDCK cells were seeded into the micromolded hydrogel and viability was quantified using the LIVE/DEAD® assay every other day. Approximately 80%, or 650 wells, were observed for each sample. Fluorescent images were converted to black-on-white negatives and both live and dead cells were counted separately (Fig. 5). A companion method was developed to verify results from the fluorescent image analysis by measuring cell attachment and proliferation of cells that had been held in a non-adherent state (Fig. 6). At each time point, parallel hydrogels seeded with NHF, HUVEC, and MDCK cells were inverted and the cells centrifuged out of the gels and onto a plastic tissue culture plate where cell viability could be assessed by measuring cell attachment and proliferation. The cells were allowed to attach and stained with Calcein-AM after an overnight incubation. Since cell attachment is a multi-step process it is a more stringent measure of cell viability than just Calcein-AM staining alone. The number of attached, viable cells was counted and each time point normalized to the initial time point (Fig. 7).
Fig. 5.
Fluorescent images and image analysis of live/dead cells. A representative image of live (a) and dead (b) cells in one portion of the hydrogel. Insets are close ups of live and dead cells (scale bars 100 μm). Particle counts were conducted on (c) and (d), the negatives of (a) and (b), respectively. Scale bars are 500 μm
Fig. 6.
Attachment assay to measure cell viability. (a) The sides of the gel were removed and the agarose containing cells was inverted within a PDMS insert (b). The gel was centrifuged to remove cells and observed 24 h later. (c) Shows attached cells with hydrogel wells in the background, (d) shows calcein-positive, attached cells, some of which proliferated
Fig. 7.
Decay in viability of cells held in a non-adherent state. Normalized cell survival as a function of time for (a) HUVEC (b) NHF and (c) MDCK cells. Normalized percent survival is plotted as a function of experiment day. The open symbols represent the live/dead viability assay; the closed symbols represent the attachment assay. Note that at initial time points, the data for both series overlap at 100%
As shown in Fig. 7, cell viability of HUVEC, NHF, and MDCK cells declined with time as the cells were held in a non-adherent state. For each of the cell types, close agreement existed between both measures of cell viability: the live/dead viability assay (open symbols) and the attachment assay (closed symbols). A significant percentage of viable cells for each type existed even after 9 days of isolation in a non-adherent state. Anoikis rates were cell type dependent. The 50% survival level for HUVEC, NHF, and MDCK cells was approximately 5.0, 7.3 and 6.1 days, respectively. Anoikis occurred quicker and was more complete in HUVECs versus NHFs.
These data show that anoikis of a population of single cells can be easily quantified using micromolds for up to 10 days in culture. Previous studies have reported that the rate of anoikis was significantly faster than our data. Several reasons could explain the differences. Measurements made on bulk populations of cells may have an accelerated rate of anoikis due to the high density of cells and the release of factors by dying cells that drive apoptosis of nearby cells. Alternatively, measurements on bulk populations of cells such as DNA fragmentation and phosphatidylserine release may assess an early stage of the anoikis cascade and these events may be reversible with time in culture.
Some cancer cells are thought to be resistant to anoikis. To determine if the micromolded hydrogels could assess genetic differences between individual cells in cancer cell lines, a H35 rat hepatoma cell line was seeded at a low density and observed on a daily basis. From single cells, H35s were able to grow into small spheroids, or “microtumors” (Fig. 8). Images of 100 spheroids grown from single cells over a 2-week period were analyzed and revealed that there is significant variation in microtumor growth in the population of H35 cells. We were also able to monitor and measure the growth rate of microtumors grown from single cells, which demonstrated the slow and fast extremes in the variability of spheroid growth from single cells. These data demonstrate the ability of micromolded hydrogels to reveal the genetic heterogeneity of individual cells within a cancer cell line and it could potentially serve as part of a screening system to test the effectiveness of drugs to enhance or inhibit anoikis. Additionally, it could be used as part of personalized medicine to test the drug resistance profile of cancer cells of a patient undergoing treatment.
Fig. 8.
Heterogeneity of microtumor growth from single cells. H35 rat hepatoma cells proliferated into multicellular “microtumors.” One of the fastest (a–d) and slowest(e–h) growing microtumors at 0, 4, 10, and 12 days. Growth was quantified based on area and is presented at right for the fastest (open circles) and slowest (closed triangles) growing cells, as well as the mean of 18 microtumors with standard deviation (closed circles)
Conclusions
A quantitative microscale anoikis assay was developed by using micromolded agarose, a substrate non-adhesive for cells. Results indicated that anoikis for three different cell types does not act as quickly as previously published results showed, suggesting that this technology is a useful new platform for the study of apoptosis and expands current methods. This device is versatile and allows for time-lapse observation of cells, providing a standardized method for determining cell death rates.
The microscale design of the hydrogel is critical to the effectiveness of the anoikis assay. The number of wells provides a significant cell sample size (822), and allows for observation of individual cells. The concave bottom of the hydrogel utilizes gravity to position cells at the lowest point in the gel. This optimizes imaging and the potential for automation by placing each sample in the center of the well, free from edge distortions and creates a uniform distance between samples. The assayed cells can be individually isolated in an ordered array, allowing the user to follow specific cells over time.
This method is compatible with many methods of determining anoikis, including microscopy, apoptosis assay kits, and observation of cell morphology. Gel fabrication methods are as easy as or easier than coating tissue culture flasks with a non-adhesive surface. By varying seeding density, the hydrogel system can place multiple cells in close contact. No other methods can produce these doublet, triplet, or higher order cell events. This could potentially be extended to heterotypic cell–cell contacts, though further device optimization is necessary to study these events. Other improvements may include smaller, more densely packed recesses to facilitate larger sample sizes and optimization for high throughput assays.
Proliferation of single cancer cells into multicellular spheroids supported the hypothesis that anoikis resistance is characteristic in malignant cell lines and offers a screening platform for pro-apoptotic drug therapies. The ability to isolate rapidly proliferating cells may provide new cell sources and insights to the study of cancer biology.
Acknowledgments
This work was funded, in part by the Brown University MD/PhD and Undergraduate Teaching and Research Award programs, the MRSEC Program of the National Science Foundation under award DMR-0520651 and the NIRT Program under award DMI-0506661.
Abbreviations
- NHF
Normal human fibroblast
- MDCK
Mandin-Darby canine kidney epithelial cells
- HUVEC
Human umbilical vein endothelial cells
- DMEM
Dulbecco’s modified eagle medium
- FBS
Fetal bovine serum
- PBS
Phosphate buffered saline
References
- Aoudijit F, Vuori K (2001) Matrix attachment regulates Fas-induced apoptosis in endothelial cells: a role for C-flip and implications for anoikis. J Cell Biol 152(3):633–643 [DOI] [PMC free article] [PubMed]
- Boudrea N, Sympson CJ, Werb Z, Bissell MJ (1995) Suppression of ICE and apoptosis in mammary epithelial cells by extracellular matrix. Science 267:891–893 [DOI] [PMC free article] [PubMed]
- Cardone MH, Salvesen GS, Widmann C, Johnson G, Frisch SM (1997) Regulation of anoikis: MEKK-1 activations requires cleavage by caspases. Cell 90:315–323 [DOI] [PubMed]
- Cheng T, Symons M, Jou T (2004) Regulation of Anoikis by Cdc42 and Rac1. Exp. Cell Res 295:497–511 [DOI] [PubMed]
- Dourma S, Laar T, Zevenhoven J, Meuwissen R, Garderen E, Peeper DS (2004) Suppression of anoikis and induction of metastasis by the neurotropic receptor TrkB. Nature 430:1034–1040 [DOI] [PubMed]
- Fouquet S, Lugo-Martinez V-H, Faussat A-M, Renaud F, Cardot P, Chambaz J, Pincon-Raymond M, Thenet S (2004) Early loss of e-cadherin from cell–cell contacts in involved in the onset of anoikis in enterocytes. J Biol Chem 41(8):43061–43069 [DOI] [PubMed]
- Frisch SM, Francis HJ (1994) Disruption of epithelial cell-matrix interactions induces apoptosis. Cell Biol 124(4):619–626 [DOI] [PMC free article] [PubMed]
- Grossman J (2002) Molecular mechanisms of detachment-induced apoptosis—Anoikis. Apoptosis 7:247–260 [DOI] [PubMed]
- Hall P, Coates P, Ansari B, Hopwood D (1994) Regulation of cell number in the gastrointestinal tract: the importance of apoptosis. J Cell Sci 107:3569–3577 [DOI] [PubMed]
- Hermiston ML, Gordon JI (1995) In vivo analysis of cadherin function in the mouse intestinal epithelium: essential roles in adhesion, maintenance of differentiation, and regulation of programmed cell death. J Cell Biol 129:489–506 [DOI] [PMC free article] [PubMed]
- Hu Z, Sanchez-Sweatman O, Huang X, Wiltrout R, Khoka R, Zhao Q, Gorelik E (2001) Anoikis and metastatic potential of cloudman S91 melanoma cells. Cancer Res 61:1707–1716 [PubMed]
- Hungerford J, Compton J, Matter J, Hoffsrom B, Otey C (1996) Inhibition of pp125FAK in culture fibroblasts results in apoptosis. J Cell Biol 135:1383–1390 [DOI] [PMC free article] [PubMed]
- Ito H, Zinner MJ, Ashley SW, Whang EE (2004) Focal adhesion kinase gene silencing promotes anoikis and suppresses metastasis of human pancreatic adenocarcinoma cells. Surgery 555–562 [DOI] [PubMed]
- Khademhosseini A, Yeh J, Eng G, Karp J, Kaji H, Borenstein J, Farokhzad OC, Langer R (2005) Cell docking inside microwells within reversibly sealed microfluidic channels for fabricating multiphenotype cell arrays. Lab Chip 5:1380–1386 [DOI] [PubMed]
- Korff T, Augustin HG (1998) Integration of endothelial cells in multicellular spherois prevents apoptosis and induces differentiation. J Cell Biol 143(5):1341–1352 [DOI] [PMC free article] [PubMed]
- Lovchik R, Arx CV, Viviani A, Delamarche E (in press) Cellular microarrays for use with capillary-driven microfluidics. Anal Bioanal Chem. doi:10.1007/s00216-007-1436-3 [DOI] [PubMed]
- McGill G, Simamura A, Bates RC, Savage RE, Fisher DE (1997) Loss of matrix adhesion triggers rapid transformation—selective apoptosis in fibroblasts. J Cell Biol 138:901–911 [DOI] [PMC free article] [PubMed]
- Meredith J, Schwartz M (1997) Integrins, adhesion and apoptosis. Trends Cell Biol 7:146–150 [DOI] [PubMed]
- Meredith JE, Fazeli B, Schwartz M (1993) The extracellular matrix as a cell survival factor. Mol Biol Cell 4:953–961 [DOI] [PMC free article] [PubMed]
- Montgomery A, Reisfeld R, Cheresh D (1994) Integrin rescues melanoma cells from apoptosis in three-dimensional dermal collagen. Proc Natl Acad Sci USA 91:8856–8860 [DOI] [PMC free article] [PubMed]
- Napolitano A, Chai P, Morgan J (2007) Dynamics of the self-assembly of complex cellular aggregates on micromolded non-adhesive hydrogels. Tiss Eng 13(8):2087–2094 [DOI] [PubMed]
- Napolitano AP, Dean DM, Man AJ, Youssef J, Ho DN, Rago AP, Lech MP, Morgan JR (2007) Scaffold-free three-dimensional cell culture utilizing nonadhesive hydrogels. Biotechniques 43:494–500 [DOI] [PubMed]
- Polakowska R, Piacentini M, Bartlett R, Goldsmith L, Haake A (1994) Apoptosis in human skin development: morphogenesis, periderm, and stem cells. Devel Dynamics 3:176–188 [DOI] [PubMed]
- Rettig JR, Folch A (2005) Large-Scale Single-Cell Trapping and Imaging Using Microwell Arrays. Anal Chem 77:5628–5634 [DOI] [PubMed]
- Rosen K, Rak J, Dean N, Kerbel R, Filmus J (2000) Activated ras prevents down regulation of Bcl-XL triggered by detachment from the extracellular matrix: a mechanism of ras-induced resistance to anoikis in intestinal epithelial cells. J Cell Biol 149(2):447–455 [DOI] [PMC free article] [PubMed]
- Sims C, Allbritton NL (2007) Analysis of Single mammalian Cells On-Chip. Lab Chip 7:423–440 [DOI] [PubMed]
- Vachon P, Loechel F, Xu H, Wewer U, Engvall E (1996) Merosin and Laminin in myogenesis; specific requirement for merosin in myotube stability and survival. J Cell Biol 134:1483–1487 [DOI] [PMC free article] [PubMed]
- Voldman J (2006) Engineered systems for the Physical manipulation of single cells. Curr Opin Biotech 17(5):532–537 [DOI] [PubMed]


