

Abstract
A simple, rapid liquid chromatography/tandem mass spectrometric (LC-MS/MS) assay was developed and validated for the quantification of both unbound and total paclitaxel in plasma following treatment with ABI-007 or Taxol. Accurate and reproducible analysis of ABI-007, an albumin nanoparticle formulation of paclitaxel could not be achieved using previously published methodology designed for Taxol. The final validated method involved protein precipitation followed by vacuum filtration, in a 96-well format for rapid processing. The four min run employed gradient elution on a Waters SymmetryShield C8 (2.1 x 50 mm, 3.5 μm) column, followed by tandem mass spectrometric detection, in electrospray positive mode. Calibrator samples were prepared daily with paclitaxel and analyzed with both ABI-007 and paclitaxel quality control samples. To measure unbound drug, sample preparation was preceded by ultrafiltration. The assay was linear over the range of 10–2500 ng/mL, with dilution providing measurement up to 50,000 ng/mL. Within-run and between run precision for all QC samples was less than 5.0% and 10.4%, respectively. Accuracy was high, with deviation of less than 6.1% for all QCs. Measurement of unbound paclitaxel was precise (BRP and WRP <10%).
1. Introduction
Paclitaxel has been used as an anticancer agent since 1984 when it entered Phase I clinical trials [1]. This drug was originally isolated in the bark of the Pacific Yew Tree and is now prepared using a semi-synthetic method. Paclitaxel causes cell death via microtubule stabilization and is used to treat a range of malignancies, including breast, ovarian and lung tumors [2]. Paclitaxel has traditionally been administered as Taxol® (Bristol-Myers Squibb), a formulation containing 50% Cremophor EL (polyethoxylated castor oil) and 50% ethanol, at a dose of 175 mg/m2 as a three-hour infusion. Though necessary for paclitaxel solubility, Cremophor EL has been shown to not only alter the pharmacokinetics of paclitaxel, but also result in adverse clinical effects such as severe hypersensitivity reactions [3].
More recently, a new formulation has been approved for use in women with breast cancer [4]. ABI-007 (Abraxane®, Abraxis Bioscience, Inc.) is a 130 nm albumin-bound particle form of paclitaxel that can be administered without the use of other excipients. As such, 260 mg/m2 of paclitaxel can be administered as a 30 min infusion, without the need for extensive premedication. In a Phase III clinical study, Gradishar et al. reported greater efficacy and a favorable safety profile for ABI-007, as compared to Taxol [4].
It is of great interest to compare the total and unbound pharmacokinetics of ABI-007 and Taxol. Plasma protein-bound paclitaxel is believed to be pharmacologically inactive, and Cremophor EL has previously been shown to lower the free fraction of drug [5].
Initially, we attempted to utilize a previously published paclitaxel assay [6] to quantify both ABI-007 and paclitaxel in human plasma. Though this assay performed very well for paclitaxel, with and without Cremophor EL, measurement of ABI-007 was extremely variable and results were not consistent with nominal concentrations, based on back-calculation using paclitaxel calibration curves. Following liquid-liquid extraction, the measured values of ABI-007 were consistently lower than expected, suggesting that these solvents did not completely dissociate of the paclitaxel-albumin nanoparticle. In addition, instrument fouling occurred regularly, suggesting problems with sample extraction and potential matrix effects that differed from pure paclitaxel. Furthermore, methodology was required to measure unbound paclitaxel concentrations. Though well suited to paclitaxel alone, equilibrium dialysis using radiolabeled drug [7] could not be used for the determination of the unbound fraction following ABI-007 treatment. Based on the difficulties faced during extraction, it appears that the paclitaxel-containing albumin nanoparticle may not completely dissociate. As such, paclitaxel could exist in three states: free paclitaxel, paclitaxel bound to endogenous albumin and paclitaxel bound within the intact particle. Equilibration with radiolabeled drug, using equilibrium dialysis, would not account for paclitaxel still contained within the albumin nanoparticle, since radiolabeled paclitaxel molecules are unlikely to exchange in and out. As such, we sought to develop a method that could efficiently extract the paclitaxel in ABI-007 from the albumin nanoparticle and provide accurate and reproducible measurements of both total and unbound drug from patients receiving ABI-007.
2. Experimental
2.1 Chemicals and supplies
Semisynthetic paclitaxel (≥97%) was purchased from Sigma-Aldrich (St. Louis, MO, USA). d5-Paclitaxel, the internal standard, was purchased from Moravek Biochemicals (Brea, CA, USA). ABI-007 (Abraxane) was provided by Abraxis Bioscience (Los Angeles, CA, USA). Ammonium formate, formic acid (98%), and absolute ethanol were also obtained from Sigma-Aldrich. Optima grade acetonitrile was purchased from Fisher Scientific (Fair Lawn, NJ, USA). Deionized water was generated with a Hydro Reverse Osmosis system (Durham, NC, USA) connected to a Milli-Q UV Plus purifying system (Millipore, Billerica, MA, USA). Drug-free heparinized human plasma was obtained from the National Institutes of Health Clinical Center Blood Bank (Bethesda, MD, USA). Captiva 96-well filtration (0.2 μm) and collection plates were purchased from Varian (Palo Alto, CA, USA). Centrifree micropartition devices (with an Ultracel YM-T regenerated cellulose membrane 30,000 NMWL) were purchased from Millipore.
2.2 Preparation of stock solutions and standards
Master stock solutions of paclitaxel were prepared by dissolving the drug in absolute ethanol at a concentration of 1 mg/mL and stored in glass tubes at −20 °C. The concentrations of the three independently prepared stock solutions was confirmed by LC-MS-MS to be within 5%. From the master stock solution, a working solution (containing 50 μg/mL of drug) and subsequent serial dilutions were prepared each week and stored at −20 °C between uses.
Master stock solutions of ABI-007 were prepared according to the package insert, by slowly pipetting 20 mL of saline into a formulated vial of Abraxane, containing 100 mg of paclitaxel. After capping, the vial was rotated at medium speed for approximately 20 minutes to ensure dissolution, while avoiding foaming due to the albumin. From this drug-saline solution, a 1 mg/mL solution of ABI-007 was prepared in blank plasma. Serial dilutions were also prepared in blank plasma and stored at −20°C between uses.
A master stock of the internal standard, d5-paclitaxel, was prepared at a concentration of 1 mg/mL in absolute ethanol. From the master stock, which was stored at −20°C between uses, a working solution of the internal standard was prepared daily by dilution to 200 ng/mL in acetonitrile, the sample precipitation solvent.
With each analytical run, calibration standards in heparinized drug-free human plasma were freshly prepared in duplicate, at concentrations of 10, 25, 100, 500, 1000, and 2500 ng/mL, from paclitaxel stock solutions at concentrations of 200, 500, 2000, 10,000, 20,000 and 50,000 ng/mL, respectively. Calibrator samples were prepared by spiking 95 μL of blank human plasma with 5 μL of the appropriate paclitaxel working solution in polypropylene microcentrifuge tubes, such that the total amount of methanol added was identical in each sample (5%). Paclitaxel QC samples were prepared at a concentration of 150 ng/mL. ABI-007 QC samples were prepared at 30, 150, 2000 and 25,000 ng/mL. All QC samples were prepared in batch, by addition of blank plasma to the required amount of working stock in volumetric flasks. After vortex-mixing, samples were aliquotted into polypropylene microcentrifuge tubes and stored at −80 °C until the time of analysis.
2.3 Sample preparation
Patient samples were allowed to thaw at room temperate, vortex-mixed for 10s to ensure uniformity, and a volume of 100 μL of each sample was transferred to a microcentrifuge tube. QC samples were also thawed at room temperature and vortex-mixed. Five replicates at each concentration were prepared with each run. For QC samples within the assay range, 100 μL was transferred per tube. For the dilution samples containing 25,000 ng/mL of ABI-007, a 20-fold dilution was performed, by addition of 5 μL of the QC solution to 95 μL of blank plasma. Similarly, for patient samples determined to be above the upper limit of quantitation, a 20-fold dilution was performed, with 5 μL of the thawed, vortex mixed plasma sample added to 95 μL of blank plasma.
To each tube, 500 μL of acetonitrile containing 200 ng/mL of internal standard (d5-paclitaxel) was added. Tubes were then capped and vortex-mixed for 5 min, on a multi-vortexer. Using the Varian Captiva system, samples were subjected to vacuum filtration in 96-well Captiva (0.2 μm filter) plates, with the filtrate collected in a Captiva 96-well (1 mL) collection plate. A volume of 10 μL of filtrate was injected directly from the 96-well collection plate onto the Waters Acquity UPLC system for analysis.
For analysis of unbound drug concentrations, 500 μL of each sample was transferred to a Centrifree device and centrifuged 1000 x g for 30 min at 25 °C. Following this ultrafiltration procedure, 100 μL of the filtrate is transferred to a microcentrifuge tube and processed in tandem with plasma samples.
2.4 Equipment
Experiments were conducted on an Waters Acquity UPLC system (Waters Corp, Milford, MA) coupled to a Micromass QuattroPremier triple-quadrupole mass spectrometric detector (Waters Corp.), equipped with an electrospray ionization source. The autosampler was maintained at 4 °C and the column at 35 °C. A Waters SymmetryShield C8 column (50× 2.1 mm I.D., 3.5 μm was employed. Analytes were eluted at a flow rate of 0.2 mL/min, using a gradient mobile phase composed of 10 mM ammonium formate (pH 4.0) and acetonitrile. Acetonitrile concentration was steadily increased from 25% to 75% over 2.5 minutes, then returned to starting conditions (25% ACN) for the remainder of the run. Total run time was 4 min. Retention time of paclitaxel and d5-paclitaxel was 2.6 minutes. The mass spectrometer was run in electrospray positive mode and source conditions were as follows: capillary voltage, 4 kV; cone voltage 23V, source temperature, 120 °C; desolvation temperature, 400 °C; cone gas flow, 150 L/h; desolvation gas flow, 800 L/h. A collision gas flow of 0.25 and collision energy of 11 were employed for creation of daughter ions. MRM mode detected the following transitions: 854.5 >569.3 for paclitaxel and 859.6>574.1 for the internal standard. The chromatographic data were acquired and analyzed using MassLynx software, equipped with QuanLynx (Waters Corp).
Validation procedures
Validation of the method with respect to accuracy and precision was carried out according to the FDA Guidance for Bioanalytical Method Validation [8]. Calibration standards of 10, 25, 100, 500, 1000 and 2500 ng/mL were prepared daily by adding the working standard solutions of paclitaxel to drug-free human plasma. Pools of QC samples were prepared at ABI-007 concentrations of 30, 150, 2000 and 25,000 ng/ml and at a paclitaxel concentration of 150 ng/mL before the validation process began and stored at −80 °C. QC samples at each concentration were thawed at room temperature and analyzed in quintuplicate with each run. All runs included blank (zero concentration) and internal standard only samples, along with calibrator and QC samples.
Calibration curves were calculated by QuanLynx software, using least-squares linear regression analysis of the ratio of paclitaxel and internal standard peak areas, versus the nominal concentration. The linearity was evaluated by comparing the correlation coefficient (r2), residuals and errors between theoretical and back-calculated concentrations of calibration standard samples. Weighting of 1/x was employed. The blank and internal standard only samples were used to visually verify the purity of the plasma and IS, and the lack of other potentially interfering substances, but were not considered for the regression analysis of standards (i.e. the origin was excluded). This calibration curve was then used to calculate concentrations of unknown samples, including QC samples, by interpolation.
The lower limit of quantitation (LLOQ) was determined by the concentration of paclitaxel at which the values for precision and accuracy were less than 20%. At least five different lots of plasma were used and resulted in accurate and reproducible measurement at the concentration of LLOQ, based on the deviation from nominal concentration.
Accuracy and precision of the assay were assessed by the relative percentage deviation (DEV) from the nominal concentrations and the within-run and between-run precision, calculated according to previously published equations [9]. Estimates of the between-run precision were obtained by one-way analysis of variance (ANOVA) using the run day as the classification variable. The between-groups mean square (MSbet), the within-groups mean square (MSwit), and the grand mean (GM) of the observed concentrations across runs were calculated using Microsoft Excel 2004 (Redmond, WA, USA).
The extraction efficiency and matrix effect for paclitaxel in human plasma, expressed as a percentage, was determined at 50 and 2000 ng/mL, in five replicates, by comparing three sets of samples: A) drug spiked to plasma and prepared normally (pre-extraction) B) drug spiked after ultrafiltration of blank plasma with the Captiva system (post-extraction), and C) drug spiked directly into mobile phase (75% 10 mM ammonium formate, pH 4.0 and 25% ACN) with no prior extraction. Matrix effect was calculated as the percentage decline in response between B and C. Extraction efficiency was calculated as the response ratio of A/B.
Stability of the drug in the filtrate was assessed by reinjection of calibrator and QC samples after remaining on the autosampler for 24h following initial injection. Freeze-thaw stability of paclitaxel has previously been demonstrated [10] and was therefore not repeated.
2.5 Drug administration and pharmacokinetic analysis
Briefly, venous blood samples (7 mL in sodium heparin tubes) were collected for pharmacokinetic analysis prior to the start of the infusion (260 mg/m2 ABI-007 as a 30 min infusion), 15 minutes after the start of the infusion, 2–5 minutes prior to the end of the infusion and at 30 minutes and 1, 1.5, 2, 4, 6, 8, 12, 24, 48 and 72 hours after the end of the infusion. For Taxol, samples were collected prior to the start of the infusion (175 mg/m2 over 3 h),1.5 h after the start of the infusion, 2–5 minutes prior to the end of the infusion and at 1, 1.5, 2, 4, 6, 8, 12, 24, 48 and 72 hours after the end of the infusion. Immediately following collection, samples were centrifuged at 1200 x g and the plasma stored at −80 °C until the time of analysis. These samples were collected on an IRB approved clinical trial conducted at the National Cancer Institute, Bethesda, MD [11].
The pharmacokinetic parameter AUC (area under the curve) was calculated for both total and unbound drug, using the measured paclitaxel concentration values, with WinNonlin 5.0 (Pharsight, Mountain View, CA).
3. Results and Discussion
Numerous methods were tested for sample preparation, with limited success. Liquid-liquid extraction with acetonitrile and n-chlorobutane is highly efficient for paclitaxel [6], but led to inconsistent results with ABI-007 samples. As compared to paclitaxel calibrators and QC samples, those prepared with ABI-007 were typically lower, but highly variable (frequent deviations of up to ±50%), suggesting that liquid-liquid extraction with this combination of solvents led to incomplete dissociation of paclitaxel from the nanoparticle. Protein precipitation with methanol or acetonitrile, followed by centrifugation and injection of the supernatant led to column and cone fouling, along with non-reproducible results for ABI-007. However, filtration with Varian Captiva 96-well filtration plates after protein precipitation with acetonitrile proved ideal. Not only were samples cleaner and response comparable for both ABI-007 and pure paclitaxel, but the 96-well format allowed for rapid sample processing and analysis. Overall, these findings suggest that protein precipitation is necessary to completely free the particle-bound paclitaxel, but that filtration is critical to minimize matrix effects.
For measurement of unbound drug, this procedure was preceded by ultrafiltration in Millipore Centrifree devices. Pure paclitaxel was used for all calibrator samples, and one set of QCs, with the remainder of the QC samples prepared from ABI-007. This ensured that results were consistent, regardless of drug formulation.
Figure 1 depicts chromatograms for blank plasma, a calibrator sample at 10 ng/mL and a sample from a patient after receiving treatment with ABI-007.
Figure 1.
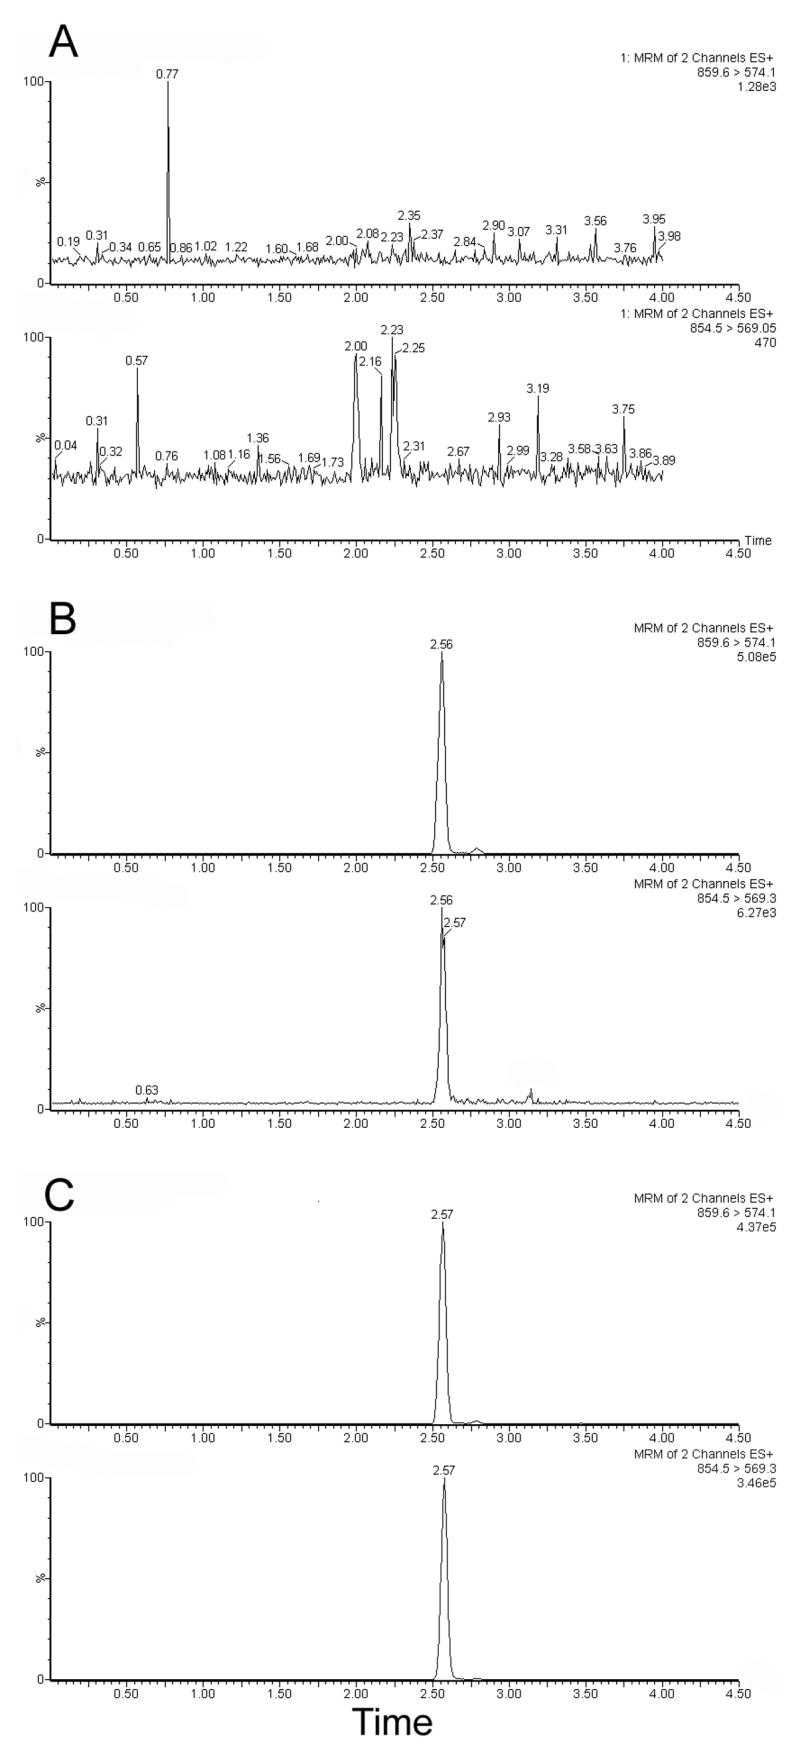
Single ion chromatograms of A) Blank plasma; B) 10 ng/mL paclitaxel in plasma; C) A patient sample, drawn 1.5 hrs after the start of a 30 min infusion of 260 mg/m2 ABI-007. The calculated concentration of this sample is 1100.7 ng/mL. Each chromatogram depicts two traces; the 859.6>574.1 transition for d5-paclitaxel, the internal standard, and the 854.5>569.05 transition for paclitaxel. Each trace is normalized to the highest peak, and absolute signal is shown on the right.
3.1 Validation
The calculated detector response ratio (paclitaxel/d5-paclitaxel) versus the nominal concentration displayed a linear relationship in the tested range of 10–2500 ng/mL. A weighting factor of 1/x, where x is the nominal concentration of paclitaxel at a given concentration, was applied to account for proportional increases in variance with drug concentration. Using least-squares linear-regression, a mean (± standard deviation) correlation coefficient (R2) of 0.9987±0.0006 (range, 0.9983–0.9994) was obtained.
All of the 8 calibration samples prepared with 10 ng/mL paclitaxel that were run on four separate days were within the required ±20% deviation of the nominal value. As shown in Table 1, the mean percentage deviation from nominal value for these LOQ samples was 7.1%. Accuracy and precision validation data are summarized in Table 1 and 2. Table 1 displays the data calculated from duplicate calibration curves on four separate days. Shown in Table 2 is data from the QC samples that were run in quintuplicate at each concentration, on each of these four days. Values were back-calculated using the calibration curve from the same run. The assay was found to be accurate, within 6.1% for concentrations and drugs, and precise with within-run and between-run precision error of less than 5% and 10.4%, respectively. Also shown in Table 2 is precision data for 2,000 ng/mL ABI-007 samples in which unbound drug concentration was measured. Prior to analysis, the sample volume and centrifugation time, temperature and speed were optimized for reproducibility. The within-run precision was 5.14% and the between-run precision was 9.64%.
Table 1.
Back-calculated concentrations from calibration curves run in duplicate on four occa
| Nominal ng/mL) | GM (ng/mL) | SD (ng/mL) | DEV (%) | RSD (%) | n |
|---|---|---|---|---|---|
| 10 | 10.7 | 0.8 | 7.1% | 7.8% | 8 |
| 25 | 22.4 | 1.3 | −10.3% | 5.7% | 8 |
| 100 | 102.3 | 3.8 | 2.3% | 3.7% | 8 |
| 500 | 513.3 | 17.2 | 2.7% | 3.4% | 7 |
| 1000 | 981.8 | 34.1 | −1.8% | 3.5% | 7 |
| 2500 | 2503.9 | 78.7 | 0.2% | 3.1% | 8 |
Abbreviations: GM, grand mean; SD, standard deviation; DEV, percent deviation from nominal value; RSD, relative standard deviation; n, total number of replicate observations within the validation runs.
Table 2.
Assessment of accuracy and precision from quality control samplesa
| Drug | Nominal (ng/mL) | GM (ng/mL) | SD (ng/mL) | DEV (%) | BRP (%) | WRP (%) | n |
|---|---|---|---|---|---|---|---|
| ABI-007 | 30 | 31.8 | 2.8 | 6.0% | 8.1% | 4.5% | 19 |
| ABI-007 | 150 | 159.1 | 8.4 | 6.1% | 2.0% | 5.0% | 20 |
| ABI-007 | 2,000 | 1,893.7 | 122.7 | −5.3% | 5.6% | 4.2% | 20 |
| ABI-007 | 25,000 | 24,709.9 | 2,557.1 | −1.2% | 10.4% | 4.1% | 19 |
| Paclitaxel | 150 | 149.2 | 6.5 | −0.5% | 3.5% | 2.9% | 19 |
| Unbound ABI-007 | 2,000 | 99.8 | 10.0 | n/a | 9.64% | 5.14% | 20 |
Abbreviations: GM, grand mean; SD, standard deviation; DEV, percent deviation from nominal value; BRP, between run precision; WRP, within run precision; n, total number of replicate observations within the validation runs.
Four or five samples at each concentration were analyzed on four different occasions.
Mean overall extraction efficiency for paclitaxel, using the Captiva vacuum filtration system after protein precipitation was 73.5% at 50 ng/mL and 88.8% at 2000 ng/mL. The apparent matrix effect led to a 15.8% and 13.5% decline in signal for 50 and 2000 ng/mL samples, respectively.
Reinjection of calibrator and QC samples after 24 hours on the autosampler at 4 °C resulted in back-calculated concentrations consistent with the initial run, allowing for sample reanalysis if necessary (e.g., in the case of machine failure). Following re-analysis, all calibrator samples remained within 15% of nominal concentration and at least 4/5 QC samples at each concentration passed (were within 15% deviation from known concentration).
3.2 Application
The validated method was applied to study the total and unbound pharmacokinetics of both ABI-007 and paclitaxel in a Phase II clinical study [11] employing a randomized crossover design. A typical chromatogram of a patient sample is presented in Figure 1 (C) with a calculated concentration of 1100.7 ng/mL.
Figure 2a shows the observed total and unbound paclitaxel concentration time profile in plasma of a patient that received 260 mg/m2 of ABI-007 as a continuous 30 min infusion. For this representative patient, the unbound fraction of drug in each sample was 6.72% ± 0.96% and did not appear to vary with time. The unbound AUC, a measure of drug exposure, was only 6.4% of that for total drug. In a separate cycle, this patient received an infusion of 175 mg/m2 Taxol over three hours. Total and unbound concentration-time data for this cycle is shown in Figure 2b.
Figure 2.

A) Plasma concentration-time profile for a representative individual that received 260 mg/m2 ABI-007 as a 30 min infusion. B) Plasma concentration-time profile for the same individual, after receiving 175 mg/m2 Taxol as a 3 h infusion, in a separate cycle of treatment. Solid dots represents total paclitaxel; open circles represents unbound paclitaxel.
4.0 Conclusion
In conclusion, a novel chromatographic method with mass-spectrometric detection has been developed and validated for the quantitative determination of total and unbound paclitaxel in human plasma, following administration of Taxol or ABI-007. This method is specific, accurate and precise, and samples can be prepared rapidly, due to the 96-well format. The use of ABI-007 QCs measured against paclitaxel calibrator samples ensures that results are comparable for both formulations. In addition, this assay allows measurement of both unbound and total drug concentrations within the same run. Overall, this assay can act as an example for future development of analytical methodology for other drugs formulated as albumin-bound nanoparticles, of which several are currently in clinical development [12].
Acknowledgments
This project has been funded in whole or in part with federal funds from the National Cancer Institute, National Institutes of Health, under contract N01-CO-12400*.
The content of this publication does not necessarily reflect the views or policies of the Department of Health and Human Services, nor does mention of trade names, commercial products, or organizations imply endorsement by the US Government.
This research was supported by the Intramural Research Program of the NIH, National Cancer Institute, Center for Cancer Research.
*ER Gardner
Footnotes
Publisher's Disclaimer: This is a PDF file of an unedited manuscript that has been accepted for publication. As a service to our customers we are providing this early version of the manuscript. The manuscript will undergo copyediting, typesetting, and review of the resulting proof before it is published in its final citable form. Please note that during the production process errors may be discovered which could affect the content, and all legal disclaimers that apply to the journal pertain.
References
- 1.Goodman J, Walsh V. The Story of Taxol: Nature and Politics in the Pursuit of an Anti-Cancer Drug. Cambridge University Press; 2001. [Google Scholar]
- 2.Mekhail TM, Markman M. Expert Opin Pharmacother. 2002;3:755. doi: 10.1517/14656566.3.6.755. [DOI] [PubMed] [Google Scholar]
- 3.ten Tije AJ, Verweij J, Loos WJ, Sparreboom A. Clin Pharmacokinet. 2003;42:665. doi: 10.2165/00003088-200342070-00005. [DOI] [PubMed] [Google Scholar]
- 4.Gradishar WJ, Tjulandin S, Davidson N, Shaw H, Desai N, Bhar P, Hawkins M, O'Shaughnessy J. J Clin Oncol. 2005;23:7794. doi: 10.1200/JCO.2005.04.937. [DOI] [PubMed] [Google Scholar]
- 5.Sparreboom A, van Zuylen L, Brouwer E, Loos WJ, de Bruijn P, Gelderblom H, Pillay M, Nooter K, Stoter G, Verweij J. Cancer Res. 1999;59:1454. [PubMed] [Google Scholar]
- 6.Gardner ER, Liau CT, Chu ZE, Figg WD, Sparreboom A. Rapid Commun Mass Spectrom. 2006;20:2170. doi: 10.1002/rcm.2577. [DOI] [PubMed] [Google Scholar]
- 7.Brouwer E, Verweij J, De Bruijn P, Loos WJ, Pillay M, Buijs D, Sparreboom A. Drug Metab Dispos. 2000;28:1141. [PubMed] [Google Scholar]
- 8.US-FDA. 2007 http://www.fda.gov/cder/guidance/4252fnl.htm.
- 9.Lepper ER, Hicks JK, Verweij J, Zhai S, Figg WD, Sparreboom A. J Chromatogr B Analyt Technol Biomed Life Sci. 2004;806:305. doi: 10.1016/j.jchromb.2004.04.003. [DOI] [PubMed] [Google Scholar]
- 10.Alexander MS, Kiser MM, Culley T, Kern JR, Dolan JW, McChesney JD, Zygmunt J, Bannister SJ. J Chromatogr B Analyt Technol Biomed Life Sci. 2003;785:253. doi: 10.1016/s1570-0232(02)00913-3. [DOI] [PubMed] [Google Scholar]
- 11.Gardner ER, Dahut W, Scripture CD, Jones J, Aragon-Ching JB, Desai N, Hawkins MJ, Sparreboom A, Figg WD. Clin Cancer Res. doi: 10.1158/1078-0432.CCR-07-4592. In Press. [DOI] [PMC free article] [PubMed] [Google Scholar]
- 12.Abraxis-Bioscience. 2007 http://www.abraxisbio.com/rnd_pipeline_nda.htm.