Abstract
This paper deals with the conception of a new system for sleep staging in ambulatory conditions. Sleep recording is performed by means of five electrodes: two temporal, two frontal and a reference. This configuration enables to avoid the chin area to enhance the quality of the muscular signal and the hair region for patient convenience. The EEG, EMG and EOG signals are separated using the Independent Component Analysis approach. The system is compared to a standard sleep analysis system using polysomnographic recordings of 14 patients. The overall concordance of 67.2% is achieved between the two systems. Based on the validation results and the computational efficiency we recommend the clinical use of the proposed system in a commercial sleep analysis platform.
Keywords: Algorithms, Artificial Intelligence, Diagnosis, Computer-Assisted, methods, Humans, Monitoring, Ambulatory, methods, Pattern Recognition, Automated, methods, Polysomnography, methods, Reproducibility of Results, Sensitivity and Specificity, Sleep Apnea Syndromes, diagnosis, Sleep Stages
Keywords: ICA, EEG, Sleep, Deconvolution, BBS, Blind Source Separation, EMG, ECG
I. Introduction
Beyond sleep disorders, sleep apnea syndrome (SAS) has a high prevalence estimated at 2% in women and 4% in men between the ages of 30 and 60 years [1] [2]. It is responsible for a significantly higher frequency of road accidents in this population than in the general population [3]. This syndrome is typically treated by means of continuous positive airway pressure therapy (CPAP) or by surgery. As adequate treatments are available and efficient, it is crucial to perform an early diagnosis of individuals suffering from SAS. The definitive diagnosis is based on standardized polysomnographic (PSG) techniques with overnight recordings of sleep stage, respiratory efforts, oronasal airflow, electrocardiographic findings, and oxyhemoglobin saturation parameters in an attended laboratory setting [4]. This “gold standard”, whose demand has doubled between 1991 and 1994 in some regions of the United States [5], is high cost and requires intensive work. As a result, sleep laboratories are overbooked and long waiting lists contribute to a lack of diagnosis and many cases of untreated SAS.
A less expensive and less time consuming solution would consist in carrying out PSG at home. Several works evaluating home versus laboratory PSG have been reported (see [6] for review). Two major problems have been emphasized. One is the complexity of sleep recording devices: the intervention of qualified personnel is required for correct system set-up [7]. The second is the high number of sensors: classical sleep analysis needs information provided by different physiological signals such as electroencephalogram (EEG), electrooculogram (EOG), electromyogram (EMG), airflow, respiratory effort, etc.
This paper focuses on the problem of recording the electrophysiological signals required for sleep staging using a small number of well-located sensors. The use of a limited number of sensors in such a system implies the recording of a new set of signals consisting of a mixed version of the EEG, EOG and EMG as well as the development of the dedicated signal processing techniques to separate them. The main difficulties are related to the optimal location of the new sensors and to the estimation of signals of interest from the recorded mixtures. Moreover, these recorded signals may be corrupted by electrocardiographic (ECG) activity, which in this case is considered as a noise. In order to address this problem, we perform the separation of four types of signals: the EEG, the EOG, the EMG and the ECG.
Several techniques can be considered for dealing with source separation, ranging from linear filtering, linear or non-linear Wiener theory to Independent Component Analysis (ICA). Linear or non-linear filtering theory are not well adapted for solving this problem even if EMG can be easily estimated by linear filtering methods [8]. Conversely, ICA seems to be a promising approach for EEG, EOG and ECG separation [9].
In the present paper the separation of these signals is achieved using an ICA approach. The technical issues regarding the reduction of the number of sensors, the selection of their location and the different processing steps are investigated in section II. ICA methods and the associated mixing model are described in section III. The results are reported in section IV where a blind comparison between night profile estimations issued from gold standard recordings and our system is conducted.
II. Problem Statement
A-. Minimal Configuration
According to the definition proposed by Rechtschaffen [10], in order to establish night sleep profiles, the electrophysiological activities EEG, EOG and EMG need to be separately recorded (Figure 1).
Fig. 1.
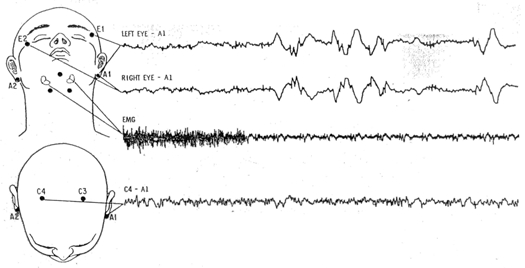
Minimal configuration for sleep recording. Top: placement of E1, E2, A1 and A2 for detection of eye movements, and recording of EMG from mental and submental muscle areas. Down: placement of C3, C4, A1, and A2 for EEG recording [10].
A set of four channels are considered minimal for the scoring of stages, one EEG channel, two eye movement channels, and one EMG channel [10]:
for EEG recording, the recommended derivation is C4A1 or C3A2,
eye movements are taken from two temporal sensors located near each eye (El and E2), slightly moved relatively to the median plan in order to simultaneously observe horizontal and vertical eye movements, relatively to the same electrode A1 (or A2) located on mastoids;
muscular activity is obtained by a derivation between two electrodes located on the chin.
The system also requires a reference electrode [11], which leads to a total of 7 electrodes in this configuration. However, in practice, the position of the electrodes on the chin area and the quality of the contact with the skin are critical factors in obtaining good EMG signal. It is then recommended to use 3 electrodes for EMG recordings to overcome high failure rate problems. Moreover, with some patients for which alpha rhythm is difficult to observe, it is necessary to add an electrode in the occipital area (O1 or O2) [10] (thus the total number of sensors becomes 9).
Each recorded channel is filtered to enhance the signal of interest [10] [12]:
for EEG, a low-pass filter is used to highlight rhythmic activities (alpha 8–12 Hz; beta ≥ 13 Hz; sigma 12–14 Hz; theta 4–7.5 Hz; delta ≤ 4 Hz) and attenuate EMG interference. The recommended cut-off frequency is between 60 and 75 Hz. A high-pass filter with a corner frequency of 0.5 Hz (time constant 0.3 s) is also used;
for EOG, the low-pass filter is limited to 15 Hz and the time constant is the same as for EEG;
EMG is observed between 5 and 120 Hz.
B-. Sensor Number and Position Choice
In order to obtain the same amount of information with a reduced number of well-located sensors, compared to the classical configuration, two questions have to be tackled:
How many sensors can the system be limited to?
Which locations have to be chosen for these new sensors?
We performed different experiments by changing the number and/or the location of sensors and for each configuration, signals issued from both the laboratory PSG system (i.e. gold standard) and the system proposed here were simultaneously recorded for further processing.
After many configuration trials [8], [9], it appeared that a good compromise could be achieved by considering four electrodes (Figure 2): two temporal, in front of the higher part of the ears, denoted F7m and F8m (where m stands for modified) and two frontal, above the eyes, denoted FP1m and FP2m, with an additional reference electrode.
Fig. 2.
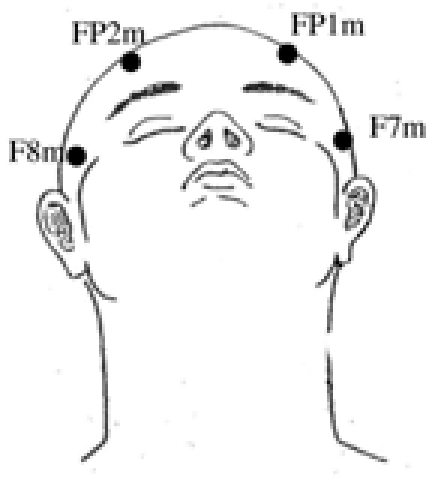
New sensor locations: two frontal FP1m and FP2m and two temporal F7m and F8m (reference electrode is not presented here).
The placement of the electrodes was motivated by two objectives. Firstly, to retrieve the same information as in the classical configuration. Secondly, to avoid chin area to ensure quality of muscular signal and hair region for patient convenience. The four electrodes F7m, F8m, FP1m and FP2m satisfy these two conditions. Concerning the reference, several placements avoiding hair region are possible, such as mastoids, tip of the nose, linked-ears, among others [11]. However, for experiments combining both systems, we simply made use of the reference electrode of the classical system, that were chosen on vertex (Cz).
Figure 3 displays an example of recorded signals with the gold standard configuration (a) and the new one (b). The signals are visualized using the software Coherence® (Deltamed SA, Paris FRANCE), which contains the appropriate high and low-pass filters. New channels F7m, F8m, FP1m and FP2m are visualized in their raw format.
Fig. 3.
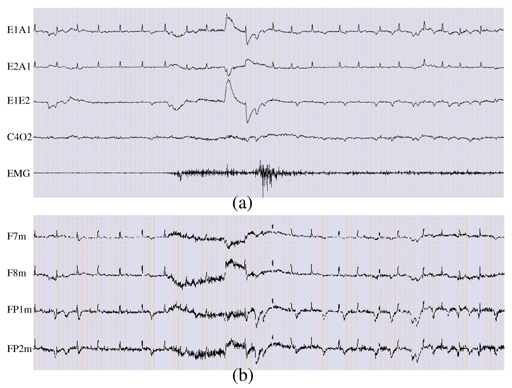
20 seconds of a subset of recorded data with a sampling rate of 256 Hz. (a) Sample of a classical polysomnographic recording showing ocular, brain and muscular activities, (b) Signals recorded using the new set of sensors. All electrophysiological activities required for sleep scoring are available but in a mixed manner with ECG interference.
In Figure 3(a) only five derivations are drawn:
For eye movements, we plot channels E1A1 and E2A1 and their derivation E1E2, often used by the clinicians for sleep analysis. Vertical eye movements, usually present on E1A1 and/or E2A1, are not clearly seen because of ECG interference. E1E2 magnifies the horizontal movements as they are in opposite phase on E1A1 and E2A1 and attenuates ECG activity.
The EEG channel C4O2 (derivation between C4A1 and O2A1) exhibits alpha rhythm.
The EMG channel shows muscular activity with higher tonus in the middle of the period.
By comparing Figures 3(a) and 3(b) it can be observed that, with the new system:
Eye movements are well recorded: vertical eye movements are easily discernible on FP1m and FP2m, whereas horizontal eye movements are better seen on F7m and F8m and are in opposite phase.
Muscular activity is present on the four channels and is synchronous with the EMG channel.
ECG activity is present on the four channels and thus corrupts the signals of interest.
EEG signal is masked by ocular, muscular and cardiac activities.
Therefore, all of the relevant information is present but in a mixed manner, thus validating sensor location.
C-. A Three-step Processing Approach
We are faced with a mixture of signals which have to be separated in order to retrieve the night sleep profile. To do so, a three-step procedure is proposed for extracting the electrophysiological signals (Figure 4).
Fig. 4.
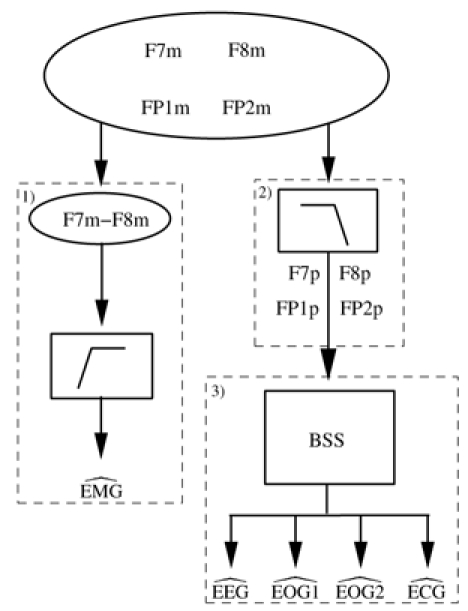
Schematic representation of the proposed procedure. 1) is obtained by high-pass filtering of F7m–F8m. 2) The low-pass filtering of F7m, F8m, FP1m and FP2m provides F7p, F8p, FP1p and FP2p. 3) and are obtained by applying Blind Source Separation (BSS) to F7p, F8p, FP1p and FP2p.
1. Extraction of EMG
The frequency components of EMG are above the frequency band of the useful components of EEG and EOG. It is thus possible to derive an estimate of EMG ( ) using a high-pass filter. Experiments showed that a good estimation of EMG can be achieved by filtering the difference F7m–F8m, choosing the corner frequency around 30 Hz.
2. Low-Pass Filtering of F7m, F8m, FP1m and FP2m
Each of the four signals F7m, F8m, FP1m and FP2m contains some high frequency components which are mainly related to EMG activities. Prior to separation, it may be interesting to low-pass filter these signals to suppress the EMG. The cut-off frequency was empirically determined and finally set at 22 Hz to provide satisfying results without loss of information. Indeed, all eye movement frequencies, even the highest, do not exceed 15 Hz. Moreover, relevant EEG spectral components are generally below 22 Hz [12]. In the following, we will refer to F7p, F8p, FP1p and FP2p as the signals resulting from this low-pass filtering.
3. Extraction of the Remaining Electrophysiological Activities
ECG interference may occur during the entire recording or only for limited periods (see Figure 3). This perturbation often obscures relevant information and therefore has to be removed. Thus, we propose to estimate the cardiac activity from mixtures as well. Furthermore, in classical recordings, eye movements are projected onto sensors E1 and E2 (see Figure 3). In our approach, this principle is kept by introducing two estimated activities and . Signal extraction can then be formulated as a Blind Source Separation (BSS) problem, where the observations and the sources are respectively F7p, F8p, FP1p, FP2p and .
Note that another solution could consist of using the Blind Source Separation framework for producing estimates of the five signals ( and ). This solution was previously investigated [9] and leads to good results but increases the complexity of the overall system, even if the EMG filtering step is dropped. It is also important to stress that ECG interference suppression may be conducted based on adaptative filtering techniques. Nevertheless, their use requires an ECG channel (i.e. reference signal) and thus imposes an additional sensor. Moreover, the ECG channel has to be continuously recorded even if no interference is observed. The proposed procedure depicted on Figure 4 overcomes such drawbacks.
III. Blind Source Separation Approach
A-. Introduction
The blind source separation approach deals with the problem of identifying n mutually independent unknown sources from m linear and instantaneous mixtures (where m ≥ n) when no a priori knowledge of sources and mixtures are available. Only information carried out by received signals are used. This problem has been widely studied for the last ten years and each of the algorithms found in the literature takes advantage of some additional hypotheses on the sources.
The choice of the method to apply is closely related to these additional hypotheses. For example, when the sources are mutually independent, stationary and no more than one of them is gaussian, Cardoso [13] proposed an algorithm (JADE) based on the minimization of cross cumulants between the components of the whitened signal and the maximization of the auto-cumulants. On the other hand, if sources are temporarily correlated, the SOBI algorithm [14] takes advantage of this temporal correlation by developing an approach using only second order statistics. If the sources are non-stationary, a joint-diagonalization of a set of spatial time-frequency distribution matrices (TFBSS) was proposed [15]. In the context of the desired application, some additional hypotheses and some constraints have to be taken into account:
the temporal correlation of sources (EEG, EOG1, EOG2, ECG signals) is not obvious, which implies that SOBI algorithm can not be chosen;
reduced computational complexity: a typical clinical procedure implies the processing of several hours of recordings. This constraint excludes the TFBSS method which is very slow and very greedy for memory;
the proposed contrast functions must be robust to outliers and to the diversity of the situation observed in clinical practice. Thus, the calculation of cumulants, as required in JADE algorithm, is proscribed.
None of the previously mentioned methods comply with these requirements. Thus the retained solution belongs to the more general framework of independent component analysis. The algorithm looks for the most mutually independent components with respect to a negentropy criterion (to be defined), which hunts the directions of nongaussianity. Indeed, it has been demonstrated that negentropy criterion is equivalent to mutual information criterion, known as an independence criterion between random variables [16], [17]. Moreover, negentropy criterion may be efficiently optimized using fast algorithms.
B-. Mixing Model
We assume that multichannel recordings are mixtures of four physiological signals of type EEG, EOG1, EOG2 and ECG. As brain volume conduction is assumed to be linear and instantaneous, the choice of a linear model is reasonable [18]. The mixing model is then written as:
| (1) |
where:
x = [x1, …, xm]T is a m-vector of m observations,
s = [s1, …, sn]T is the n-vector of n unknown sources,
A is the m × n unknown full rank mixing matrix,
and m ≥ n.
In our application, s is the vector [EEG EOG1 EOG2 ECG]T and x is the vector [F7p F8p FP1p FP2p]T, so that m = n. The independence hypothesis is satisfied because EEG, EOG1, EOG2 and ECG sources are supposed physiologically independent.
C-. ICA Algorithm
A very simple and highly efficient fixed-point algorithm for computing ICA was introduced by A. Hyvärinen and E. Oja [19]. A preliminary step consists in whitening the data as explained in the Appendix and leads to a new mixing model:
| (2) |
Then, the algorithm looks for nongaussian directions defined by that represents a column of the demixing matrix W (W is the inverse of Ã). This leads to a negentropy criterion which is approximated by a non-quadratic function G [16]. The overall algorithm comprises several steps and is summarized hereafter:
Center the observed variables x.
Whiten the data and obtain z (cf. Appendix).
Choose the number n of independent components to estimate (cf. Appendix).
Choose initial values for the wi, i = 1, …,n, each of unit norm. Orthogonalize the initial matrix W as in step 6 below.
- For every i = 1, …, n, let
where g and g′ are the first and second derivative of the non quadratic function G.(3) - Do a symmetric orthogonalization of the matrix W = (w1,…,wn)T by
(4) If non-convergence, go back to step 5.
Several properties of the above algorithm, reported in [16], are of practical interest in the context of our application:
the convergence rate is cubic (or at least quadratic), which means a fast convergence,
the algorithm finds directly independent components of any nongaussian distribution using any non-linearity g. This contrasts with many algorithms for which an estimation of the probability distribution function has to be initially available and the non-linearity must be chosen accordingly,
the performance of the method can be optimized by choosing a suitable non-linearity g. In our paper, g is chosen as in [17]: g(u) = tanh(au) with a > 0.
To apply this algorithm, data are windowed into non-overlapping blocks of one hour, as a compromise between the required number of samples for estimating the matrix parameters and the dynamics of signals during night sleep. Hence an additional step, called matching sources, is introduced to overcome the recurrent problem of source permutation (identifiability) in ICA and to guarantee the continuity of the extracted components between blocks.
D-. Matching Sources
For each block of one hour, the ICA algorithm leads to four different signals (firstly denoted IC1, IC2, IC3 and IC4) that have to be identified among the searched signals: and . This operation can be performed by correlating each of the estimated signals and combinations of F7p, F8p, FP1p and FP2p.
Indeed, we observed that horizontal eye movements are more visible on F7p and F8p and are in opposite phase, and that vertical eye movements are more visible on FP1p and FP2p. Thus, we decided to create three pseudo-reference signals:
PRef1 = F8p−F7p for horizontal eye movements,
PRef2 = FP1p+FP2p for vertical eye movements,
and PRef3 = F7p+F8p for ECG.
Figure 5 shows an example of the pseudo-reference signals obtained from F7p, F8p, FP1p and FP2p of Figure 3(b). Both PRef2 and PRef3 display ECG activity, but ambiguity is avoided since vertical eye movements are particularly visible on PRef2.
Fig. 5.

The three pseudo-reference signals generated for mapping the components obtained by applying ICA algorithm to physiological activities: PRef1 for , PRef2 for and PRef3 for .
The matching is performed by calculating the covariance matrix between IC = [IC1 IC2 IC3 IC4]T, and PRef = [PRef1 PRef2 PRef3]T:
| (5) |
The matrix C is of size 4 x 3. If each column j (j = 1,2,3) reaches its maximum (in absolute value) on a different line i (i = 1,…, 4), we decide that ICi match PRefj. Particular cases can occur, for example, when two columns j and k have their maximum on the same line i. In this case, ICi matches PRefj, if Cij >Cik (and PRefk otherwise). Line i and column j are then removed, and the procedure is repeated. Finally, this procedure allows identifying three of the four ICi as channels and . The last source is then the channel . It is important to notice that this procedure does not need any external information but uses only the intrinsic properties of F7p, F8p, FP1p and FP2p signals. The PRefj (j = 1, 2,3) are only built to arrange correctly the estimated channels and .
E-. Examples
To illustrate the entire procedure (ICA algorithm followed by the matching step), let us consider two examples.
Example 1 is derived from the signals of Figure 3(b). Figure 6 shows the results of the estimation of the signals EMG, EEG, EOG1, EOG2 and ECG, from the signals F7m, F8m, FP1m and FP2m of Figure 3(b).
Fig. 6.
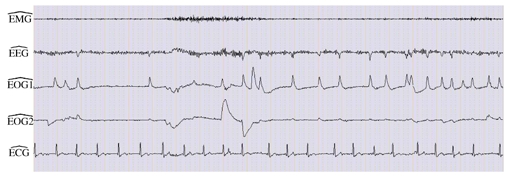
Separation result of signals depicted in Figure 3(b). is obtained by high-pass filtering. and are derived using ICA approach and the matching step.
Comparing the estimated signals with the reference signals of Figure 3 (a), we observe that muscular activity is well recovered on and that the channel contains mainly alpha rhythm, as in the reference C4O2, despite a still light alteration by EOG. Regarding eye movements, shows horizontal eye movements and vertical eye movements are displayed on although they were barely visible on the reference channels, mainly because of ECG interference.
Example 2 considers a case without ECG interference on the data (patient PI of the database). The results depicted on Figure 7 show that the four channels and are well estimated and that the fifth channel contains only a very weak signal.
Fig. 7.

Separation results in the absence of ECG. The overall procedure leads to good estimates of sources.
These two examples show that the proposed approach works whether the ECG is present or not.
IV. Results
A-. Evaluation Methodology
A data set issued from 14 patients (P1 to P14) was used for evaluating the proposed system. A total of 14 sleep nights, combining both systems, the PSG gold standard and the new one (Figure 2), were recorded at the “Fondation Rothschild” of Paris.
The two series of nights were randomized and anonymized and then manually scored by a sleep specialist. Only the neurophysiological signals were considered, no respiratory analysis was done and no information regarding other events during the night, such as respiratory pauses or leg movements, was available.
We recall that the sleep analysis consists of scoring a night, per 30 seconds epochs, in different sleep stages. The stages and their most prominent features are [10], [20]:
Stage W (wakefulness) is characterized as low voltage; rapid, desynchronized activity (10 to 30 μV and more than 17 Hz); and alpha rhythm. This stage is usually, but not necessarily, accompanied by a relatively high tonic EMG, and often rapid eye movements and eye blinks are present in the EOG tracing.
Stage 1 contains some alpha waveforms mixed with theta waves. It is characterized by the presence of slow eye movements and the absence of rapid eye movements. EMG activity is moderate to low.
Stage 2 is composed of a background activity consisting of low voltage, mixed frequency EEG signals with bursts of distinctive waves of 12 to 14 Hz called sleep spindles. These are accompanied by K complexes, which are delineated, negative, sharp waves immediately followed by positive components lasting more than 0.5 seconds.
Stage 3 contains at least 20% but less than 50% delta waves which are high-amplitude (greater than 75 μV from peak to peak) and slow-frequency waveforms.
Stage 4 is indicated by more than 50% delta waves.
Stage REM (or REM sleep) is characterized by relatively low-voltage, mixed-frequency EEG activity with episodic rapid eye movements and low EMG activity.
After scoring, the evolution of night sleep can be displayed by an hypnogram which represents the global course of the night.
The double analysis provided two hypnograms for each patient: the first hypnogram derived from the analysis of signals recorded by the classical system, and the second hypnogram obtained by analyzing the extracted signals issued from the new system described above. Figure 8 shows hypnograms obtained for patient P1.
Fig. 8.

Hypnograms of patient P1. Top: with the classical system, down: with the new system. W: wakefulness, R: REM sleep, S1-S2-S3-S4: stages 1, 2, 3 and 4 (After manual scoring, hypnograms are automatically generated by the software Coherence of Deltamed).
B-. Performance Evaluation
In order to evaluate the performance of the new system, both hypnograms have been compared to verify whether each epoch had been scored as the same sleep stage or not, first hypnogram being considered as the reference hypnogram. From a medical point of view, stages 3 and 4 being very close. They are typically lumped together when clinicians discuss sleep architecture and referred to as slow-wave sleep [20]. To evaluate the performance of our system we maintain this convention and referred to this new stage as stage “3+4”. This led to a confusion matrix for each patient, from which two criteria of performance have been performed. The first computes the sensitivity and the specificity for each stage and the second computes the concordance between both hypnograms of each patient.
1. Criteria 1
The sensitivity and the specificity are calculated for the whole database from the confusion matrix of all the patients, reported in Table I. This matrix is obtained by the addition of the confusion matrices of the 14 patients.
TABLE I.
Confusion matrix of all the patients. Rows: original coding, columns: new coding.
| Stages | W | 1 | 2 | 3+4 | REM | Total |
|---|---|---|---|---|---|---|
| W | 2458 | 856 | 68 | 19 | 60 | 3461 |
| 1 | 118 | 1417 | 692 | 91 | 167 | 2485 |
| 2 | 77 | 290 | 3266 | 971 | 200 | 4804 |
| 3+4 | 14 | 16 | 409 | 1589 | 1 | 2029 |
| REM | 32 | 391 | 406 | 14 | 1281 | 2124 |
| Total | 2699 | 2970 | 4841 | 2684 | 1709 | 14903 |
To show how this criteria has been performed, let us consider the case of stage W. From a total of 14903 epochs, 3461 were coded in stage W in the reference hypnogram whereas with the new system 2458 epochs were coded in stage W and 1003 (856+68+19+60) were coded in a different stage. On the other hand, a total of 2699 epochs were coded in stage W in the new system, among which 2458 were already in stage W and 241 (118+77+14+32) were coded in another stage. From these values, 2458 True Positives, 241 False Positives, 1003 False Negatives and 11201 (14903-3461-241) True Negatives are obtained. Then the sensitivity Se and the specificity Sp are defined by:
| (6) |
| (7) |
which leads to a value of 0.71 for sensitivity and 0.98 for specificity for stage W.
The sensitivity and the specificity calculated for all the stages are presented in Table II.
TABLE II.
Sensitivity and specificity calculated for the whole database for each stage.
| Stage W | Stage 1 | Stage 2 | Stage 3+4 | REM | |
|---|---|---|---|---|---|
| Se | 0.71 | 0.57 | 0.68 | 0.78 | 0.60 |
| Sp | 0.98 | 0.87 | 0.84 | 0.91 | 0.97 |
We can see that sensitivity ranges from 0.57 (stage 1) to 0.78 (stage 3+4), whereas specificity is between 0.84 (stage 2) and 0.98 (stage W).
2. Criteria 2
The concordance between both hypnograms has been calculated for each patient from his confusion matrix (not presented here). It is obtained as the sum of the diagonal over the total number of epochs. The results obtained for each patient in the database are presented in Figure 9.
Fig. 9.
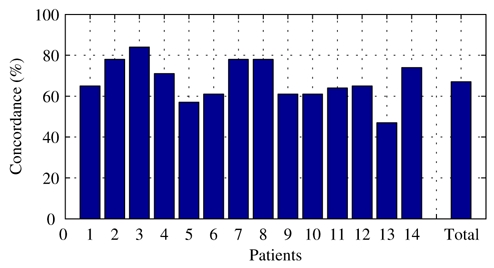
Concordance for the 14 patients and for the whole database (Total).
The percentage of concordance varies from 47.0% for patient P13 to 83.5% for patient P3. When considering the total of the database, the global concordance is 67.2%.
V. Discussion and Perspectives
Evaluating our system is not an easy task. In fact, the results rely on the assumption that the scoring based on PSG gold standard is the target whereas patterns specific to particular stages are more obvious with the new system. Thus mismatching of sleep stages may also arise from reference scoring.
The results obtained from criteria 1 show that large confusions exist between stages. As seen in Table I, the most important confusion occurs between stage 2 and stage 3+4. This may be due to percentage of delta activity in the EEG channel. In fact, the epoch is scored as stage 2 when EEG contains delta activity of less than 20%, and as stage 3+4 when this percentage is greater than 20%. The quantification of delta activity is subjective and thus leads to questionable decision. Moreover, we noticed that spindles and K-complexes are particularly visible with the new system. This may explain why several epochs scored as stage 1, 3+4 or REM in the reference coding were scored as stage 2 in the new coding. Another confusion occurs between stage W and stage 1: 856 epochs scored as stage W in the reference system are scored as stage 1 in the new system. Since stage W is characterized by high tonic EMG whereas in stage 1 EMG is moderate to low, confusion may arise from the reconstructed muscular activity. This latter is well correlated with the EMG recorded on the chin but often has a low amplitude. An additional mismatch is observed between REM and stage 1: among 2124 epochs scored as REM in the reference system, 391 became stage 1 in the new coding. However, it is important to note that 40% of the encountered confusions are related to one patient (P13) for which the signal to noise ratio in both recordings (original and new) is weak. The results obtained from criteria 2 show that six patients have a concordance greater than 70%, six between 60% and 70% and two below 60% (Figure 9). The weakest performance is obtained for patient P13 (47.0%) where the quality of the recorded data is poor. Knowing the observed inconsistencies when night sleep is scored by several specialists [21], on the whole these results are satisfactory.
The proposed system is able to record electrophysiological activities required for sleep staging using less technological constraints. Indeed, the number of electrodes has been reduced to five and their placement (frontal and temporal) avoids, on the one hand, the chin area, to ensure quality of muscular signal and on the other hand, the hair region for patient convenience (the placement of the reference electrode in a non-hair region remains to be tested). From a computational point of view, the cost is very low since a night can be processed in less than one minute using a standard computer thus making the system appropriate for daily clinical use. The integration of the overall proposed method on Deltamed’s sleep platform is in progress as well as the development of a headband, incorporating the sensors, easy to put on.
Acknowledgments
The authors would like to thank Dr Monge-Strauss of “Fondation Rothschild” of Paris who performed the recordings and the manual scoring of the data. This work was supported by the RNTS Program of the Ministry of Research and Technology (Grant n°4906060).
Biographies
Fabienne Porée received the PhD degree in signal processing and telecommunications from University of Rennes 1, France, in 2001. She is Associate Professor at the Institut Universitaire de Technologie de Rennes. She is working in Laboratoire Traitement du Signal et de l'Image (LTSI), INSERM U642, at the University of Rennes 1. Her research interests include biomedical signal processing and analysis and statistical processing methods.
Amar Kachenoura was born in Tizi-Ouzou, Algeria, in 1975. He received the diploma in electronic engineering from M.M.T.O. University, Tizi-Ouzou, Algeria, in 1998 and Diplôme d‘Etudes Approfondies from Ecole Central de Nantes (ECN), Nantes, France, in July 2002. He is currently working toward the Ph.D. degree in Laboratoire Traitement du Signal et de l‘Image (LTSI), INSERM U642-University of Rennes 1, France. His research interests focus mainly on biomedical and statistical signal processing, and blind source separation.

Hervé Gauvritgraduated in Electrical Engineering from ESEO, Angers, France, in 1992. He received his Diplôme d‘Etudes Approfondies (M.S.) in signal processing in 1994 and his PhD degree in 1997, both from the University of Rennes 1. From 1994 to 1997, he was a PhD student in signal processing at IRISA, Rennes working on multisensor multitarget tracking problems. Since 1998, he has joined the LTSI-INSERM laboratory at the University of Rennes where he is an associate professor. His research activities have now moved towards biomedical engineering. His main research interests include decision making, optimization, and estimation and detection theory applied to electrophysical signals.

Catherine Morvanbecame MD in 1991 from Paris University. She also received a Diplôme d‘Etudes Supérieures Spécialisées in ‘Informatics applied to Life Science‘. She works in DELTAMED (French Company specialized in neurology) since 1990. She is currently at the head of research and development department. DELTAMED develops its own EEG and Sleep products, including innovative signal processing tools.

Guy Carraultreceived his PhD in 1987 in Signal processing & telecommunications and from the Université de Rennes 1. He is working in the Signal and Image Processing laboratory of Université de Rennes 1 since 1984. He is currently professor at the Institut Universitaire de Technologie de Rennes. His research interests include detection and analysis of electrophysical signals by means of nonstationnary and statistical processing methods, as well as intelligent instrumentation design.
Lotfi Senhadji was born in Rabat, Morocco, in 1966. He received the Ph.D. degree in signal processing and telecommunications from the University of Rennes 1, France, in 1993. He is currently a Professor at the University of Rennes 1 with the department of electrical engineering and the head of LTSI-INSERM U642. Since 1989, he has been working in Laboratoire Traitement du Signal et de l‘Image (LTSI) at the University of de Rennes 1, Rennes, France, where his main research efforts are focused on non-stationary signal processing with particular emphasis on wavelet transforms and time-frequency representations for detection, classification and interpretation of biosignals. He has published more than 70 research papers in journals and conferences. He made contributions to four text books.
Appendix
Whitening linearly transforms the observed mixing vector x in a whitened vector z (i.e. its components are uncorrelated and their variance equal unity):
| (8) |
A traditional whitening method makes use of the eigenvalue decomposition of the observation vector covariance matrix: E[xxT] = VDVT, where V is an orthogonal matrix of the eigenvectors of E[xxT] and D is a diagonal matrix of its eigenvalues. Whitening is performed by z = V D−1/2VT x and gives:
| (9) |
The whitening enables reducing the number of parameters to estimate. More precisely, we have:
| (10) |
which means that à is orthogonal (an orthogonal matrix contains degrees of freedom). Thus, only m(m − 1)/2 parameters instead of m × n have to be estimated. Such a process may also be useful to reduce the dimension of the observation subspace: when eigenvalues of E[xxT] are determined, those lower than a given threshold are discarded.
References
- 1.Young T, Palta M, Dempsey J, Skatrud J, Weber S, Badr S. The occurence of sleep-disordered breathing among middle-aged adults. N Engl J Med. 1993;328:1230–1235. doi: 10.1056/NEJM199304293281704. [DOI] [PubMed] [Google Scholar]
- 2.Weitzenblum E, Racineux J-L. Syndrome d’apnées obstructives du sommeil. 2. Masson: 2004. [Google Scholar]
- 3.Findley L, Unverzagt M, Guchu R. Vigilance and automobile accidents in patients with sleep apnea or narcolepsy. Chest. 1995;108:619–624. doi: 10.1378/chest.108.3.619. [DOI] [PubMed] [Google Scholar]
- 4.Man GC, Kang BV. Validation of portable sleep apnea monitoring device. Chest. 1995;108(2):388–393. doi: 10.1378/chest.108.2.388. [DOI] [PubMed] [Google Scholar]
- 5.Pack AI. Economic implications of the diagnosis of obstructive sleep apnea. Ann Intern Med. 1999;130:533–534. doi: 10.7326/0003-4819-130-6-199903160-00019. [DOI] [PubMed] [Google Scholar]
- 6.Flemons WW, Littner MR, Rowley JA, Gay P, Anderson WM, Hudgel DW, McEvoy RD, Loube DI. Home diagnosis of sleep apnea: a systematic review of the literature. Chest. 2003;124(4):1543–1579. doi: 10.1378/chest.124.4.1543. [DOI] [PubMed] [Google Scholar]
- 7.Portier F, Portmann A, Czernichow P, Vascaut L, Devin E, Benhamou D, Cuvelier A, Muir JF. Evaluation of home versus laboratory polysomnography in the diagnosis of sleep apnea syndrome. Am J Respir Crit Care Med. 2000;162:814–818. doi: 10.1164/ajrccm.162.3.9908002. [DOI] [PubMed] [Google Scholar]
- 8.Margaglio E, Porée F, Senhadji L, Carrault G. Séparation de mélanges par ondelettes et réseaux de neurones: étude comparée. 19e colloque Gretsi; Paris, France. September 2003; pp. 186–189. [Google Scholar]
- 9.Kachenoura A, Gauvrit H, Senhadji L. Extraction and separation of eyes movements and the muscular tonus from a restricted number of electrodes using the Independent Component Analysis. 25th annual international conference of the IEEE Engineering in Medicine and Biology Society; Cancun, Mexico. September 2003; pp. 2359–2362. [Google Scholar]
- 10.Rechtschaffen A, Kales A. A manual of standardized terminology, techniques and scoring system for sleep stages in human subjects. US Government Printing Office; 1968. [DOI] [PubMed] [Google Scholar]
- 11.Teplan M. Fundamentals of EEG measurement. Measurement Science Review. 2002;2:1–11. [Google Scholar]
- 12.Benoit O, Goldenberg F. Exploration du sommeil et de la vigilance chez l’adulte. Editions Médicales Internationales; 1997. [Google Scholar]
- 13.Cardoso JF, Souloumiac A. Blind beamforming for non gaussian signals. IEE Proceedings-F. 1993;140(6):362–370. [Google Scholar]
- 14.Belouchrani A, Abed-Meraim K, Cardoso JF, Moulines E. A blind source separation technique using second order statistics. IEEE Trans Signal Process. 1997;45(2):434–444. [Google Scholar]
- 15.Holobar A, Fevotte C, Doncarli C, Zazula D. Single autoterms selection for blind source separation in time-frequency plane. Proc. EUSIPCO 2002; Toulouse, France. September 2002; pp. 565–568. [Google Scholar]
- 16.Hyvärinen A. Fast and robust fixed-point algorithms for Independent Component Analysis. IEEE Trans Neural Netw. 1999;10(3):626–634. doi: 10.1109/72.761722. [DOI] [PubMed] [Google Scholar]
- 17.Hyvärinen A, Karhunen J, Oja E. Independent Component Analysis. John Wiley & Sons; 2001. [Google Scholar]
- 18.Jung TP, Humphries C, Lee TW, Makeig S, McKeown MJ, Iragui V, Sejnowski T. Extended ICA removes artefacts from electroencephalographic recordings. Adv Neural Inf Process Syst. 1998;10:894–900. [Google Scholar]
- 19.Hyvärinen A, Oja E. Fast fixed-point algorithm for Independent Component Analysis. Neural Comput. 1997;9:1483–1492. [Google Scholar]
- 20.Martin CR, Marzec ML. Sleep scoring: 35 years of standardized sleep staging. RT Magazine. On-Line, 2003, Available: http://www.rtmagazine.com/Articles.ASP?articleid=R0306F03.
- 21.Viardot G. PhD dissertation. Université de Technologie de Troyes; 2002. Reconnaissance des formes en présence d’incertitude sur l’expertise. Application à l’étude des phases d’activation transitoires du sommeil chez l’homme. [Google Scholar]


