

Abstract
Many older people experience changes in appetite and consume marginal or inadequate dietary protein. This study was designed to examine the appetitive responses to habitual protein intakes that span the range of adequacy in younger and older men. Twenty-two men (12 younger, aged 21–43 y and 10 older, aged 63–79 y) completed, in random order, three 18-d trials that involved consumption of individualized, isoenergetic menus providing 1.00, 0.75, and 0.50 g protein · kg BW−1 · d−1, which were 125% (trial P125), 94% (trial P94), and 63% (trial P63) of the Recommended Dietary Allowance for protein. Near the end of each trial, the subjects recorded appetitive sensations hourly throughout one day using a visual analogue scale. Independent of age, ratings of hunger were lower for P125 (1.3 ± 0.5 cm) than P94 (1.8 ± 0.8 cm) and P63 (1.8 ± 0.6 cm) (P = 0.037), and desire to eat was lower during the P125 trial (1.4 ± 0.5 cm), compared with the P63 trial (2.1 ± 0.7 cm) (P = 0.003), and P94(1.8 ± 0.7 cm) was not different when compared with P63 and P125. Protein intake did not influence fullness. These results show that younger and older men who consume inadequate protein experience appetite changes that may promote increased food intake.
Introduction
Dietary protein is considered to be more satiating than carbohydrate and fat, based primarily on results from acute and short-term feeding studies (1-5). In a metaanalysis of data from 10 studies that included measurements of energy intake at the meal following a higher vs. lower protein preload, 8 of the studies indicated that subjects consumed less energy (mean 9% lower) at the meal subsequent to the higher protein preload (6). These findings have been used to support the notion that a person’s habitual protein intake might influence their appetite and thus ingestive behavior. However, limited research has addressed the effects of habitual protein intake on appetite in humans. One 2-wk trial noted an inverse correlation between habitual protein intake and the postprandial satiety response to a high-protein meal (7).
Research in pigs (8), chickens (9), and sheep (10) indicate animals will preferentially choose nonpurified diet with a protein content that matches their requirements or need for more protein when deprived. Rats show a preference for higher-protein nonpurified diet vs. a protein-free nonpurified diet (11). Pigs provided inadequate protein compensate by increasing total food intake (8). The impact of habitual inadequate protein intake on appetite is not readily documented in older humans, but is important to understand because 15–40% of older Americans may consume protein at or below the recommended dietary allowance (RDA)6 of 0.8 g · kg−1 · d−1 (12,13). Previous research has shown that older persons give higher hedonic ratings to soups containing higher concentrations of casein hydrolysate than younger persons, especially when the older persons had low serum albumin concentration, a marker of poor protein nutritional status (14).
The purpose of this study was to examine the effects of protein intakes that span the range of adequacy on indices of appetite in men. We hypothesized that inadequate protein intake would increase the perception of hunger.
Methods
Subjects
Twelve younger (mean age 29 ± 7 y, range 21–43 y) and 10 older (aged 72 ± 6 y, range 63–79 y) men completed the study. One younger participant and 2 older participants dropped out during the study. Inclusion criteria were the following: ages of 21–45 y and 60–80 y; clinically normal heart, liver, kidney, and thyroid status; no diabetes mellitus; complete bladder control; not taking over-the-counter or prescription medications or nutritional supplements known to affect energy or protein metabolism; nonsmoker; BMI 21–30 kg/m2; community-dwelling; ambulatory, and recreationally active, performing structured physical activities (exercise) ≤3 d/wk; have not started a new exercise program within the past 3 mo; body weight stable (±3 kg) during the past 6 mo. Potential participants responded to advertisements placed in local newspapers and flyers and underwent a phone interview. This was followed by a screening that included a medical history questionnaire, electrocardiogram, and routine blood and urine chemistries. The study physician reviewed all medical information and approved each subject to participate. Each participant received oral and written explanations of the purpose and procedures of the study, signed an informed consent document, and received monetary compensation. The study was approved by the Purdue University Committee of the Use of Human Research Subjects, West Lafayette, IN.
Experimental design
The study consisted of three, 18-d trials with different dietary protein intakes utilizing a randomized, crossover design. Each trial was separated by a minimum 1-wk washout period, and during this time, the subjects were asked to consume their usual diets.
Diet
All foods and beverages, except water (ad libitum intake), were provided to the subjects throughout the 3 controlled eating periods. Each subject’s total energy requirement was estimated to equal 1.75 times their resting energy expenditure, which was predicted using the Harris-Benedict equation for men (15). The 1.75 activity factor was used instead of the more commonly used 1.60 activity factor to account for the energy expenditure of the recreational activities most of the subjects performed. The somewhat higher factor was also used to compensate for a potential overestimation of actual metabolizable energy intakes when the Atwater energy equivalents of 16.7, 16.7, and 37.7 kJ/g of protein, carbohydrate, and fat, respectively, were used to calculate the energy contents of the diets provided to the subjects (16). During each trial, if a volunteer’s weight fluctuated by ± 0.5 kg from baseline for >3 d, energy intake was adjusted for weight maintenance. On d 1 of each trial, subjects consumed a very low protein diet of 0.2 g protein · kg body weight (BW)−1 · d−1, which was used to enhance adaptation to the subsequent protein intake (17). On d 2–18 of each trial, the subjects consumed a 3-d cycle of lacto-ovo vegetarian, isoenergetic menus that contained 1.00 g (125% of the RDA; P125), 0.75 g (94% of the RDA; P94), or 0.50 g (63% of the RDA; P63) protein · kg BW−1 · d−1 and a nonprotein ratio of 65% carbohydrate and 35% fat. The sources of protein were dairy (27, 29, 12%), egg (4, 3, 2%), grains (48, 47, 57%), legumes (9, 8, 8%), and other (12, 13, 21%) for the P125, P94, and P63 trials, respectively. Subjects were instructed to rinse and scrape all food containers and to consume the rinsings. Although we relied primarily on the serum urea nitrogen (BUN) and urinary total nitrogen excretion data (see below) as independent, objective markers of dietary compliance, we also used less quantitative means to promote compliance. These included frequently questioning the subjects about their perceptions of the diets and the ingestion of any nonprotocol foods and beverages; providing each subject with a daily check-off list of the foods and beverages to be consumed; and monitoring their returned food and beverage containers, which they were requested to not wash. We did not have a formal rating assessing the acceptability of the 3-d menu cycle during the 3 trials. However, all subjects reviewed the menus prior to starting the protocol, and any extreme food aversions were discussed and limited menu changes allowed.
Subjects were given a daily multivitamin/mineral dietary supplement (Centrum, Wyeth Consumer Healthcare) and instructed to refrain from other supplements during the entire study. The ingestion of alcohol was prohibited during the study. The energy and macronutrient contents of the diets were determined using Nutritionist Pro nutrition analysis software, version 1.5 (First Data Bank).
Body composition and analytical methods
Body height without shoes was measured to ± 0.1 cm using a wall-mounted stadiometer (Holtain). Body weight was measured on a clinical scale, and the percentage of body fat and fat-free mass were estimated using air displacement plethysmography (Bod Pod, Life Measurement) (18). Blood urea nitrogen was determined from a fasting blood sample obtained during d 12 (Urease/GLDH, Olympus CHEM, Mid America Clinical Laboratories). Urinary total nitrogen excretion was measured from four, 24-h urine collections made during d 14–17 of each trial and analyzed using a nitrogen analyzer (FP-528, Leco).
Appetite assessment
Appetite was assessed during a single 24-h period in the third week of each trial using the general labeled magnitude scale (gLMS) (19). Each subject completed the gLMS questionnaire hourly during waking hours over the 24-h period. The following questions were asked starting with “How strong is your”: feeling of hunger?; feeling of fullness?; desire to eat? The subjects were instructed to place a horizontal line through the vertical axis describing their feeling at that moment for each question. The vertical axis was 10.0 cm, measured using a ruler to the nearest mm. The anchors were 0.2 cm “barely detectable,” and 10.0 cm “strongest imaginable”; and the intermediate identifiers, displayed with quasi-logarithmic spacing, were 0.6 cm “weak,” 1.7 cm “moderate,” 3.4 cm “strong,” and 5.3 cm “very strong.” Each subject’s peak and mean scores were used for analyses.
Statistical analysis
Values are means ± SD. Comparisons between younger and older men and among the three trials were performed using a mixed model repeated measures ANOVA and post-hoc analyses with Tukey-Kramer (JMP Statistical Discovery Software, version 3; SAS Institute). Statistical significance was defined as P < 0.05.
Results
The younger and older men did not differ in body weight (78.8 ± 15.1 and 78.8 ± 11.5 kg, respectively) or BMI (24.6 ± 4.1 and 26.2 ± 3.2 kg/m2). The younger men had higher fat-free mass (61.0 ± 8.8 vs. 55.8 ± 5.4 kg) and a lower percentage of body fat (21.5 ± 7.5 vs. 28.6 ± 6.5%) than the older men.
For the 3 trials combined, total energy, carbohydrate, and fat intakes were higher for the younger men, whereas protein and fiber intakes did not differ between the 2 age groups (Table 1). Blood urea nitrogen was lower in younger men than in older men, and urinary total nitrogen excretion did not differ between the 2 groups (P = 0.097).
TABLE 1.
Effect of 3 chronic protein intake levels on nitrogen assessments for younger and older men1
| Protein intake
|
|||
|---|---|---|---|
| P125 | P94 | P63 | |
| Energy, MJ/d | |||
| Younger | 13.3 ± 2.5x | 13.2 ± 2.4x | 13.5 ± 2.7x |
| Older | 11.8 ± 1.9y | 11.5 ± 1.6y | 11.3 ± 1.8y |
| Protein, g/d | |||
| Younger | 81 ± 15a | 61 ± 12b | 40 ± 8c |
| Older | 81 ± 12a | 60 ± 9b | 40 ± 6c |
| Protein, g · kg BW−1 · d−1 | |||
| Younger | 1.02 ± 0.02a | 0.77 ± 0.02b | 0.51 ± 0.01c |
| Older | 1.01 ± 0.02a | 0.76 ± 0.02b | 0.51 ± 0.01c |
| Carbohydrate, g/d | |||
| Younger | 468 ± 93x | 479 ± 88x | 499 ± 105x |
| Older | 408 ± 72y | 407 ± 56y | 422 ± 71y |
| Fat, g/d | |||
| Younger | 110 ± 21x | 113 ± 20x | 119 ± 25x |
| Older | 98 ± 17y | 98 ± 15y | 100 ± 17y |
| Fiber, g/d | |||
| Younger | 35 ± 5a | 31 ± 5ab | 27 ± 5b |
| Older | 35 ± 4a | 28 ± 2ab | 26 ± 4b |
| BUN, mmol/L | |||
| Younger | 4 ± 1a,x | 4 ± 1ab,x | 3 ± 1b,x |
| Older | 6 ± 1a,y | 5 ± 1ab,y | 4 ± 1b,y |
| Urinary total nitrogen, mg · kg BW−1 · d−1 | |||
| Younger | 101 ± 18a | 83 ± 20b | 63 ± 11c |
| Older | 113 ± 18a | 90 ± 13b | 70 ± 9c |
Values are means ± SD, n = 12 (younger) and 10 (older) men.
Main effect of protein intake, means in a row with superscripts without a common letter differ, P < 0.05.
Main effect of age, means in a column with superscripts without a common letter differ, P < 0.05.
For the subjects combined, total energy, carbohydrate, and fat intakes did not differ among the 3 trials (Table 1). Protein intakes, expressed as g/d and g protein · kg BW−1 · d−1, decreased from the P125 to P94 to P63 trials. Fiber intake was higher during the P125 trial than during the P63 trial, and P94 was not different when compared with P63 and P125. Blood urea nitrogen concentration and 24-h urinary total nitrogen excretion decreased with decreasing dietary protein intakes (Table 1).
For the younger compared with the older men in all trials combined, the mean [Y 2.1 ± 0.8, O 2.6 ± 0.9; (P = 0.014)] and peak [Y 4.1 ± 1.3, O 5.3 ± 2.3) (P = 0.039)] feelings of fullness were lower. In contrast, feelings of hunger and desire to eat did not differ between the age groups. Independent of age, feelings of hunger were lower for P125 than P94 and P63, and desire to eat was lower during P125, compared with P63, and P94 was not different when compared with P63 and P125 (Table 2). The main effect of protein intake (data from younger and older men combined) on hunger and desire to eat is presented in Figure 1. Also, the peak feeling of hunger was lower in P125 (3.0 ± 1.1) than P94 (4.2 ± 1.9) and P63 (3.9 ± 1.0) (P = 0.04). Protein intake did not influence fullness.
TABLE 2.
Daily values for appetite ratings of younger and older men after 3 chronic protein intakes1
| Protein intake
|
|||
|---|---|---|---|
| P125 | P94 | P63 | |
| Hunger, cm | |||
| Younger | 1.4 ± 0.5a | 1.6 ± 0.6b | 1.7 ± 0.5b |
| Older | 1.2 ± 0.5a | 2.0 ± 0.9b | 2.0 ± 0.7b |
| Fullness, cm | |||
| Younger | 2.1 ± 0.8x | 1.8 ± 0.4x | 1.9 ± 0.4x |
| Older | 2.6 ± 0.9y | 2.4 ± 1.0y | 2.4 ± 1.0y |
| Desire to eat, cm | |||
| Younger | 1.4 ± 0.6a | 1.6 ± 0.6ab | 2.0 ± 0.4b |
| Older | 1.3 ± 0.5a | 1.9 ± 0.8ab | 2.4 ± 1.0b |
Values are means ± SD, n =12 (younger) and 10 (older) men.
Main effect of protein intake, means in a row with superscripts without a common letter differ, P < 0.05.
Main effect of age, means in a column with superscripts without a common letter differ, P < 0.05.
FIGURE 1.
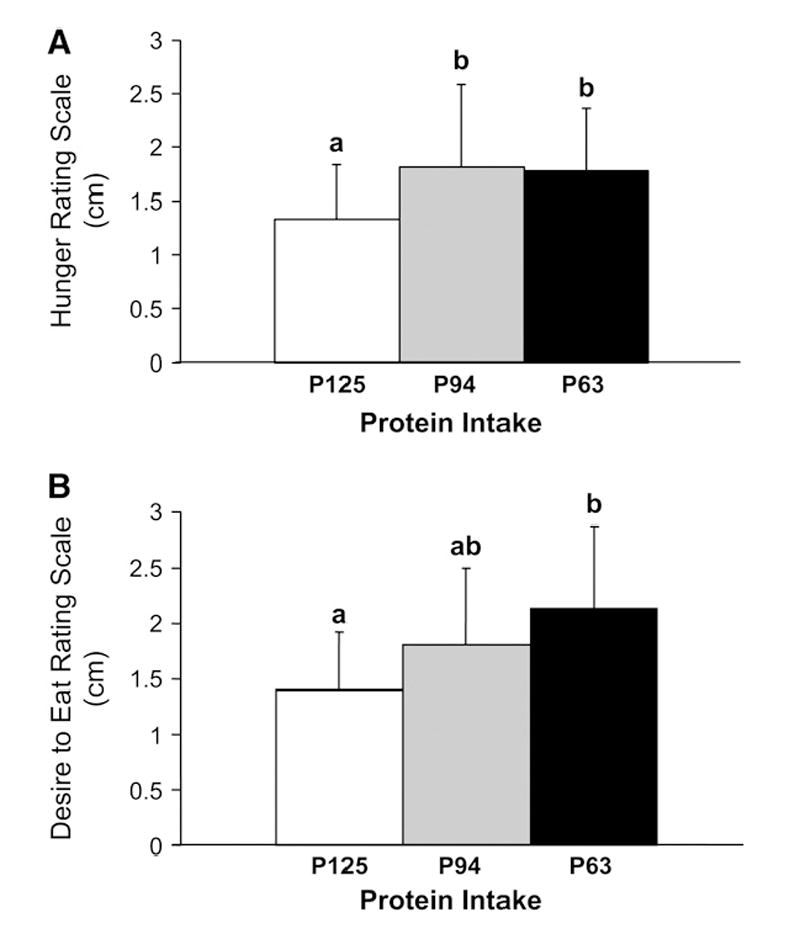
Effect of 3 chronic protein intake levels in younger and older men on waking hour feeling of hunger (P125, 1.3 ± 0.5; P94, 1.8 ± 0.8; P63 1.8 ± 0.6) (A) and desire to eat (P125, 1.4 ± 0.5; P94, 1.8 ± 0.7; P63 2.1 ± 0.7) (B) using a generalized labeled magnitude scale. Data from younger and older men were combined because there was no effect of age. Values are means ± SD, n = 22. Means with superscripts without a common letter differ, P < 0.05.
Discussion
The primary aim of this study was to explore the effects of chronic low-to-moderate dietary protein intakes on appetitive responses in younger and older men. A controlled feeding design was used to ensure dietary compliance. The protein intake-dependent differences in BUN and urinary total nitrogen excretion confirmed that subjects followed the protocol. Previous studies primarily focused on levels of protein intake above the current estimated average requirement (EAR) of 0.66 g protein · kg BW−1 · d−1 and RDA of 0.80 g protein · kg BW−1 · d−1 (7,20,21). However, because critical physiologic changes in muscle mass occur when the amount of protein consumed is at the RDA (22,23) and below the EAR (24,25), the current study examined protein intakes above, within, and below the normal range of adequacy, or 1.00, 0.75, and 0.50 g protein · kg BW−1 · d−1, respectively. Previous studies have shown that individuals who eat lower amounts of protein are at higher risk for weight gain (21,26,27). This is potentially due to decreased satiety associated with lower protein intake, a lower thermogenesis rate observed with lower protein intake, and/or lower preservation of fat-free mass (20). In our study, regardless of age, hunger and desire to eat were higher when the subjects consumed diets that contained 63 and 94% of the RDA for protein, intakes that might be considered inadequate and marginal, respectively, than when 125% of the RDA for protein was consumed. These results indicate that appetitive responses are affected by the amount of protein consumed within the range of adequacy. These results also indicate that it is possible to detect differences in appetite with relatively small (0.25 g protein · kg BW−1 · d−1) changes in protein intake.
A paucity of data exists on the effects of habituation at different levels of protein intake on appetite in humans. Long et al. (7) evaluated whether a person’s habitual protein intake affected the appetitive response to ingesting high-protein test meals. Subjects were recruited based on their self-selected protein intakes, which were ~1.0 (125% RDA) and ~1.4 (175% RDA) g protein · kg BW−1 · d−1, in the lower and higher protein groups, respectively. On a testing day, each subject rated their hunger and fullness hourly over a 13-h period and consumed test meals at h 0, 5, and 9 that provided 2.2 g protein · kg BW−1 · d−1 (275% RDA). For the next 13 d, the lower and higher protein groups consumed diets that contained 0.75 (94% RDA) and 1.96 (245% RDA) g protein · kg BW−1 · d−1, respectively, and the same testing protocol repeated. On the first testing day, the lower protein group reported lower hunger and higher fullness than the higher protein group when both groups consumed the same high-protein meals. A similar trend, that was not supported statistically, was observed after the 13-d period of dietary manipulation. Long et al. (7) concluded that a person’s habitual protein intake will influence their appetitive response to a high-protein meal. This experiment did not evaluate the appetitive responses of the 2 groups consuming meals that contained the same amounts of protein that they were habituated to, as was done for the current study.
Providing the subjects with isoenergetic-controlled diets with 3 levels of protein provided us with a unique opportunity to document their appetitive responses without the confounding influence of changes in energy intake, because they were not allowed to act upon any appetitive changes. A shift in motivation to eat protein has occurred in individuals who are protein deficient (14,28,29). Malnourished Mexican infants ingested ~23% more soup when it contained casein hydrolysate (18.4 ± 2.7 mL) than plain soup (14.1 ± 2.1 mL) (P < 0.01) (28). The nonmalnourished control children ate similar amounts of both soups (28). In another study measuring chemosensory perception, 26 persons tasted soup with 0, 1, 2, 3, 4, and 5% casein, w:v. Of 26 persons, 16 were elderly (aged 70–92 y) and 10 were younger (aged 18–26 y). The elderly persons had lower serum protein and albumin and higher BUN concentrations than the younger persons. The elderly persons rated the higher casein hydrolysate concentrations as more palatable than did the younger participants (14). Among the younger and elderly persons combined, persons with lower concentrations of serum albumin and persons with elevated BUN expressed greater liking for a higher concentration of casein hydrolysate (1.5 vs. 0.4%, w:v) (14). Consistent with the idea that people who consume inadequate protein show a preference for higher protein foods, Gibson et al. (29) showed, in 18–49 y–old subjects, that consumption of a lower-protein (vs. higher-protein) breakfast resulted in a preference for higher-protein flavored foods at a midday meal. Further, this preference for higher-protein flavors occurred mainly at the end of the meal. The authors suggested that the preference for protein was most likely to occur after a person’s energy needs were met. Collectively, these findings support the hypothesis that chronic ingestion of a diet containing inadequate protein, but adequate energy, elevates the motivation to eat protein, affects protein flavor preference, and triggers appetitive changes consistent with a desire to consume food.
The gLMS subjectively assesses the indices of appetite in individuals who have unique and personalized definitions for the terms “hunger,” “fullness,” and “desire to eat.” Tools like the gLMS are difficult if not impossible to validate against an objective measure such as food intake; however, when used under conditions of fixed feeding and repeated measurements within subjects, like the current study, they might provide important information that likely would not be possible to obtain from measurements of voluntary food intake (30). The gLMS is documented to be sensitive to a variety of experimental manipulations including changes in energy intake and diet composition [see (30) for review]. The use of a quasi-logarithmic scale to space the intermediate identifiers results in the potential for a relatively small quantitative change at the lower end of the scale (i.e., toward “barely detectable”) to represent a larger magnitude difference in perception than a comparable quantitative change at the higher end (i.e., toward “strongest imaginable”). The shift from below to above one of the intermediate identifiers represents an order of magnitude change in rating. These issues might be important with regard to the findings from the current study. Although statistically significant, the quantitative changes in hunger and desire to eat documented using the gLMS were relatively small (increased from P125 to P63 of ≤0.8 cm for daily mean hunger and ≤1.1 cm for daily mean desire to eat, on a 10 cm full range gLMS). These changes, however, shifted the mean values from between the “weak” and “moderate” identifiers to between the “moderate” and “strong” identifiers. Likewise, peak hunger shifted from between the “moderate” and “strong” identifiers to between the “strong” and “very strong” identifiers.
Appetite changes with age, and the anorexia of aging may relate to numerous social, psychological, hormonal, and medical factors that collectively result in inadequate feeding (31-33). The present finding, that the older men perceived greater fullness than the younger men despite consuming less total energy daily, supports observations that older men are generally more satiated (34) and become satiated more quickly during a meal (35). Some researchers have reported an age-related decrease in hunger (36), although this was not observed in our study. It is important to note, however, that the use of a controlled feeding experimental design limits generalization of these findings to an ad libitum diet.
As protein was varied to specified amounts, fat and carbohydrate did not change. Thus, the consistency of these macronutrients (as a percentage of nonprotein energy) likely minimized macronutrient influences on appetite. Trial-dependent differences in fiber intake occurred and could have confounded the results. However, the finding that hunger was significantly different between the P125 and P94 trials when there were no differences in fiber intake, argue against fiber being the dominant dietary factor causing the differential appetite responses among trials. All fiber intakes were generally 25–35 g/d. Recent studies have demonstrated that fiber has a limited effect on appetite (37-42). Overall, this indicates the results presented are likely due to the differences in dietary protein, not fiber. The results of this study indicate that inadequate dietary protein intake leads to increased hunger and desire to eat in men.
Acknowledgments
We thank Zonda Birge for her technical assistance with the urinary total nitrogen analyses and Arthur D. Rosen, MD, for serving as the study physician.
Footnotes
Supported by NIH R01 AG15750, Purdue University Lynn Fellowship, and Phyllis Izant gift funds.
Author disclosures: J. W. Apolzan, N. S. Carnell, R. D. Mattes, and W. W. Campbell, no conflicts of interest.
Abbreviations used: BUN, blood urea nitrogen; BW, body weight; gLMS, general labeled magnitude scale; P125, 1.0 g protein · kg BW−1 · d−1; P94, 0.75 g protein · kg BW−1 · d−1; P63, 0.50 g protein · kg BW−1 · d−1; RDA, recommended dietary allowance.
Literature Cited
- 1.Booth DA, Chase A, Campbell AT. Relative effectiveness of protein in the late stages of appetite suppression in man. Physiol Behav. 1970;5:1299–302. doi: 10.1016/0031-9384(70)90044-2. [DOI] [PubMed] [Google Scholar]
- 2.Hill AJ, Blundell JE. Macronutrients and satiety: the effects of a high-protein or high-carbohydrate meal on subjective motivation to eat and food preferences. Nutr Behav. 1986;3:133–44. [Google Scholar]
- 3.Vandewater K, Vickers Z. Higher-protein foods produce greater sensory-specific satiety. Physiol Behav. 1996;59:579–83. doi: 10.1016/0031-9384(95)02113-2. [DOI] [PubMed] [Google Scholar]
- 4.Latner JD, Schwartz M. The effects of a high-carbohydrate, high-protein or balanced lunch upon later food intake and hunger ratings. Appetite. 1999;33:119–28. doi: 10.1006/appe.1999.0237. [DOI] [PubMed] [Google Scholar]
- 5.Johnson J, Vickers Z. Effects of flavor and macronutrient composition of food servings on liking, hunger and subsequent intake. Appetite. 1993;21:25–39. doi: 10.1006/appe.1993.1034. [DOI] [PubMed] [Google Scholar]
- 6.Eisenstein J, Roberts SB, Dallal G, Saltzman E. High-protein weight-loss diets: are they safe and do they work? A review of the experimental and epidemiologic data. Nutr Rev. 2002;60:189–200. doi: 10.1301/00296640260184264. [DOI] [PubMed] [Google Scholar]
- 7.Long SJ, Jeffcoat AR, Millward DJ. Effect of habitual dietary-protein intake on appetite and satiety. Appetite. 2000;35:79–88. doi: 10.1006/appe.2000.0332. [DOI] [PubMed] [Google Scholar]
- 8.Kyriazakis I, Emmans GC, Whittemore CT. The ability of pigs to control their protein intake when fed in three different ways. Physiol Behav. 1991;50:1197–203. doi: 10.1016/0031-9384(91)90582-9. [DOI] [PubMed] [Google Scholar]
- 9.Shariatmadari F, Forbes JM. Growth and food intake responses to diets of different protein contents and a choice between diets containing two concentrations of protein in broiler and layer strains of chicken. Br Poult Sci. 1993;34:959–70. doi: 10.1080/00071669308417656. [DOI] [PubMed] [Google Scholar]
- 10.Kyriazakis I, Oldham JD. Diet selection in sheep: the ability of growing lambs to select a diet that meets their crude protein (nitrogen × 6.25) requirements. Br J Nutr. 1993;69:617–29. doi: 10.1079/bjn19930064. [DOI] [PubMed] [Google Scholar]
- 11.Deutsch JA, Moore BO, Heinrichs SC. Unlearned specific appetite for protein. Physiol Behav. 1989;46:619–24. doi: 10.1016/0031-9384(89)90341-7. [DOI] [PubMed] [Google Scholar]
- 12.Agricultural Research Service. Continuing survey of food intakes by individuals (CSFII) and 1994–96 Health Knowledge Survey [CD-ROM] Beltsville (MD): Beltsville HumanNutrition Research Center; 1998. [Google Scholar]
- 13.Cid-Ruzafa J, Caulfield LE, Barron Y, West SK. Nutrient intakes and adequacy among an older population on the eastern shore of Maryland: the Salisbury Eye Evaluation. J Am Diet Assoc. 1999;99:564–71. doi: 10.1016/S0002-8223(99)00140-6. [DOI] [PubMed] [Google Scholar]
- 14.Murphy C. Aging and chemosensory perception of and preference for nutritionally significant stimuli. Ann N Y Acad Sci. 1989;561:251–66. doi: 10.1111/j.1749-6632.1989.tb20987.x. [DOI] [PubMed] [Google Scholar]
- 15.Harris JA, Benedict FG. A biometric study of basal metabolism in man. Washington (DC): Carnegie Institute of Washington; 1919. [Google Scholar]
- 16.Kruskall LJ, Campbell WW, Evans WJ. The Atwater energy equivalents overestimate metabolizable energy intake in older humans: results from a 96-day strictly controlled feeding study. J Nutr. 2003;133:2581–4. doi: 10.1093/jn/133.8.2581. [DOI] [PubMed] [Google Scholar]
- 17.Scrimshaw NS. Criteria for valid nitrogen balance measurement of protein requirements. Eur J Clin Nutr. 1996;50(Suppl 1):S196–197. [PubMed] [Google Scholar]
- 18.McCrory MA, Gomez TD, Bernauer EM, Mole PA. Evaluation of a new air displacement plethysmograph for measuring human body composition. Med Sci Sports Exerc. 1995;27:1686–91. [PubMed] [Google Scholar]
- 19.Sorensen LB, Moller P, Flint A, Martens M, Raben A. Effect of sensory perception of foods on appetite and food intake: a review of studies on humans. Int J Obes Relat Metab Disord. 2003;27:1152–66. doi: 10.1038/sj.ijo.0802391. [DOI] [PubMed] [Google Scholar]
- 20.Westerterp-Plantenga MS. The significance of protein in food intake and body weight regulation. Curr Opin Clin Nutr Metab Care. 2003;6:635–8. doi: 10.1097/00075197-200311000-00005. [DOI] [PubMed] [Google Scholar]
- 21.Lejeune MP, Kovacs EM, Westerterp-Plantenga MS. Additional protein intake limits weight regain after weight loss in humans. Br J Nutr. 2005;93:281–9. doi: 10.1079/bjn20041305. [DOI] [PubMed] [Google Scholar]
- 22.Campbell WW, Trappe TA, Jozsi AC, Kruskall LJ, Wolfe RR, Evans WJ. Dietary protein adequacy and lower body versus whole body resistive training in older humans. J Physiol. 2002;542:631–42. doi: 10.1113/jphysiol.2002.020685. [DOI] [PMC free article] [PubMed] [Google Scholar]
- 23.Campbell WW, Trappe TA, Wolfe RR, Evans WJ. The recommended dietary allowance for protein may not be adequate for older people to maintain skeletal muscle. J Gerontol A Biol Sci Med Sci. 2001;56:M373–380. doi: 10.1093/gerona/56.6.m373. [DOI] [PubMed] [Google Scholar]
- 24.Castaneda C, Charnley JM, Evans WJ, Crim MC. Elderly women accommodate to a low-protein diet with losses of body cell mass, muscle function, and immune response. Am J Clin Nutr. 1995;62:30–9. doi: 10.1093/ajcn/62.1.30. [DOI] [PubMed] [Google Scholar]
- 25.Castaneda C, Gordon PL, Fielding RA, Evans WJ, Crim MC. Marginal protein intake results in reduced plasma IGF-I levels and skeletal muscle fiber atrophy in elderly women. J Nutr Health Aging. 2000;4:85–90. [PubMed] [Google Scholar]
- 26.Westerterp-Plantenga MS, Lejeune MP, Nijs I, van Ooijen M, Kovacs EM. High protein intake sustains weight maintenance after body weight loss in humans. Int J Obes Relat Metab Disord. 2004;28:57–64. doi: 10.1038/sj.ijo.0802461. [DOI] [PubMed] [Google Scholar]
- 27.Skov AR, Toubro S, Ronn B, Holm L, Astrup A. Randomized trial on protein vs carbohydrate in ad libitum fat reduced diet for the treatment of obesity. Int J Obes Relat Metab Disord. 1999;23:528–36. doi: 10.1038/sj.ijo.0800867. [DOI] [PubMed] [Google Scholar]
- 28.Vazquez M, Pearson PB, Beauchamp GK. Flavor preferences in malnourished Mexican infants. Physiol Behav. 1982;28:513–9. doi: 10.1016/0031-9384(82)90148-2. [DOI] [PubMed] [Google Scholar]
- 29.Gibson EL, Wainwright CJ, Booth DA. Disguised protein in lunch after low-protein breakfast conditions food-flavor preferences dependent on recent lack of protein intake. Physiol Behav. 1995;58:363–71. doi: 10.1016/0031-9384(95)00068-t. [DOI] [PubMed] [Google Scholar]
- 30.Stubbs RJ, Hughes DA, Johnstone AM, Rowley E, Reid C, Elia M, Stratton R, Delargy H, King N, Blundell JE. The use of visual analogue scales to assess motivation to eat in human subjects: a review of their reliability and validity with an evaluation of new hand-held computerized systems for temporal tracking of appetite ratings. Br J Nutr. 2000;84:405–15. doi: 10.1017/s0007114500001719. [DOI] [PubMed] [Google Scholar]
- 31.Morley JE. Anorexia of aging: physiologic and pathologic. Am J Clin Nutr. 1997;66:760–73. doi: 10.1093/ajcn/66.4.760. [DOI] [PubMed] [Google Scholar]
- 32.Roberts SB, Rosenberg I. Nutrition and aging: changes in the regulation of energy metabolism with aging. Physiol Rev. 2006;86:651–67. doi: 10.1152/physrev.00019.2005. [DOI] [PubMed] [Google Scholar]
- 33.MacIntosh C, Morley JE, Chapman IM. The anorexia of aging. Nutrition. 2000;16:983–95. doi: 10.1016/s0899-9007(00)00405-6. [DOI] [PubMed] [Google Scholar]
- 34.Sturm K, Parker B, Wishart J, Feinle-Bisset C, Jones KL, Chapman I, Horowitz M. Energy intake and appetite are related to antral area in healthy young and older subjects. Am J Clin Nutr. 2004;80:656–67. doi: 10.1093/ajcn/80.3.656. [DOI] [PubMed] [Google Scholar]
- 35.Chapman IM, MacIntosh CG, Morley JE, Horowitz M. The anorexia of ageing. Biogerontology. 2002;3:67–71. doi: 10.1023/a:1015211530695. [DOI] [PubMed] [Google Scholar]
- 36.Rolls BJ, Dimeo KA, Shide DJ. Age-related impairments in the regulation of food intake. Am J Clin Nutr. 1995;62:923–31. doi: 10.1093/ajcn/62.5.923. [DOI] [PubMed] [Google Scholar]
- 37.Heini AF, Lara-Castro C, Schneider H, Kirk KA, Considine RV, Weinsier RL. Effect of hydrolyzed guar fiber on fasting and postprandial satiety and satiety hormones: a double-blind, placebo-controlled trial during controlled weight loss. Int J Obes Relat Metab Disord. 1998;22:906–9. doi: 10.1038/sj.ijo.0800680. [DOI] [PubMed] [Google Scholar]
- 38.Frost GS, Brynes AE, Dhillo WS, Bloom SR, McBurney MI. The effects of fiber enrichment of pasta and fat content on gastric emptying, GLP-1, glucose, and insulin responses to a meal. Eur J Clin Nutr. 2003;57:293–8. doi: 10.1038/sj.ejcn.1601520. [DOI] [PubMed] [Google Scholar]
- 39.Saltzman E, Moriguti JC, Das SK, Corrales A, Fuss P, Greenberg AS, Roberts SB. Effects of a cereal rich in soluble fiber on body composition and dietary compliance during consumption of a hypocaloric diet. J Am Coll Nutr. 2001;20:50–7. doi: 10.1080/07315724.2001.10719014. [DOI] [PubMed] [Google Scholar]
- 40.Weickert MO, Spranger J, Holst JJ, Otto B, Koebnick C, Mohlig M, Pfeiffer AF. Wheat-fibre-induced changes of postprandial peptide YY and ghrelin responses are not associated with acute alterations of satiety. Br J Nutr. 2006;96:795–8. doi: 10.1017/bjn20061902. [DOI] [PubMed] [Google Scholar]
- 41.Howarth NC, Saltzman E, McCrory MA, Greenberg AS, Dwyer J, Ausman L, Kramer DG, Roberts SB. Fermentable and nonfermentable fiber supplements did not alter hunger, satiety or body weight in a pilot study of men and women consuming self-selected diets. J Nutr. 2003;133:3141–4. doi: 10.1093/jn/133.10.3141. [DOI] [PubMed] [Google Scholar]
- 42.Silberbauer C, Frey-Rindova P, Langhans W. Breakfasts with different fiber and macronutrient contents do not differentially affect timing, size or microstructure of the subsequent lunch. Z Ernahrungswiss. 1996;35:356–68. doi: 10.1007/BF01610554. [DOI] [PubMed] [Google Scholar]