

Abstract
In attention/hyperactivity and aggressive behavior problems were measured in 335 children from school entry throughout adolescence, at 3-year intervals. Children were participants in a high-risk prospective study of substance use disorders and comorbid problems. A parallel process latent growth model found aggressive behavior decreasing throughout childhood and adolescence, whereas inattentive/hyperactive behavior levels were constant. Growth mixture modeling, in which developmental trajectories are statistically classified, found two classes for inattention/hyperactivity and two for aggressive behavior, resulting in a total of four trajectory classes. Different influences of the family environment predicted development of the two types of behavior problems when the other behavior problem was held constant. Lower emotional support and lower intellectual stimulation by the parents in early childhood predicted membership in the high problem class of inattention/hyperactivity when the trajectory of aggression was held constant. Conversely, conflict and lack of cohesiveness in the family environment predicted membership in a worse developmental trajectory of aggressive behavior when the inattention/hyperactivity trajectories were held constant. The implications of these findings for the development of inattention/hyperactivity and for the development of risk for the emergence of substance use disorders are discussed.
A cluster of child problems including inattention, disorganization, hyperactivity, and impulsivity present serious dilemmas for our society. These problems tend to co-occur and, when sufficiently severe, are diagnosed clinically as attention-deficit/hyperactivity disorder (ADHD; American Psychiatric Association [APA], 2000). Clinical diagnosis of ADHD is associated with serious impairment in multiple domains (Johnston, Murray, Hinshaw, Pelham, & Hoza, 2002) and risk for poor long-term outcome (Klein & Mannuzza, 1991) including development of later substance use disorders (Zucker & Gomberg, 1986). Treatment of attention problems and hyperactivity has led to increased rates of medication of children in the United States (Robison, Sclar, Skaer, & Galin, 1999) and associated controversy (Searight & McLaren, 1998). As a result, understanding the antecedents of these problems is an important priority.
Yet the determinants of this cluster of childhood problems are far from well understood. Twin and adoption studies indicate that heritability of normal and severe levels of these behavior problems is substantial (Loney, Paternite, Schwartz, & Roberts, 1997) and neuropsychological correlates are becoming more clearly delineated (Nigg, 2001). At the same time, it is recognized that epigenetic processes, including family context effects, must also be better understood to fully account for the developmental trajectory of these difficulties (Whalen & Henker, 1999). Indeed, even heritable processes are likely to exert at least part of their effects through family processes (Scarr & McCartney, 1983).
Role of the Family Context in Development of Inattention/Hyperactivity Versus Aggression
One concern in the field has been that insufficient energy has been expended to understand the family context for development of attention problems and hyperactivity, despite ample theoretical and empirical grounds for doing so (Greenberg, Kusche, & Speltz, 1991; Johnston & Mash, 2001). Perhaps the major difficulty in isolating family context factors specific to inattention/hyperactivity is that the latter so often co-occur with aggression and other disruptive behaviors (Frick, 1994). Work conducted 2 decades ago established the partial independence of the related child problem domains of inattention/hyperactivity and aggression/conduct problems (Hinshaw, 1987). Substantial progress ensued in understanding family processes related to the development of other disruptive behaviors such as aggression, conduct problems, and oppositional behavior. These include parent hostility, lack of monitoring, and coercive interchange with children in the development of aggression (Patterson, 1982) along with low parental competence and inconsistent discipline in oppositional behaviors (Kendziora & O’Leary, 1993). These effects on the development of antisocial behavior and aggression are mediated by the joint contribution of shared genes (vulnerability to antisocial behavior) and adverse home environments featuring hostility, conflict, and other characteristics (Ge, Conger, Cadoret, Neiderhiser, Yates, Troughton, & Stewart, 1996), which interact (Cadoret, Yates, Troughton, Woodworth, & Stewart, 1995).
Success in understanding family correlates of aggression, however, has conversely spelled difficulty in understanding the family environment specific to inattention/hyperactivity. Child aggression tends to take up all the variance in family adversity, leaving no variance to be related to child inattention/hyperactivity. Most family risks associated with ADHD are notable primarily when children have comorbid conduct problems or aggression (Johnston & Mash, 2001) and studies that associate family adversity with ADHD (e.g., Biederman, Milberger, Foraone, Kiely, Guite, Mick, Ablon, Warburton, & Reed, 1995), often fail to control for comorbid child aggression or conduct problems. Indeed, some family context variables that at one time were thought to be related to inattention/hyperactivity now appear to be primarily related to co-occurring child aggression/conduct problems (see Frick, 1994, for a review). As a result, few family context effects relate to inattention/hyperactivity specifically. However, family processes have not been studied sufficiently deeply or broadly in relation to inattention/hyperactivity to solidify any conclusions (Johnston & Mash, 2001). Moreover, most studies have been cross-sectional, and few have considered multiple family process variables while systematically assessing both inattention/hyperactivity and antisocial child behaviors over time (Johnston & Mash, 2001).
In fact, a few studies have suggested family context variables specific to child inattention/hyperactivity. For example, parent attention problems appear to be specific to child attention problems apart from child aggression or conduct problems (Frick, Kamphaus, Lahey, Leober, Christ, Hart, & Tannenbaum, 1991). Parenting problems also may be related distinctly to attention problems in addition to their link to aggression (Loeber, Brinthaupt, & Green, 1990; Nigg & Hinshaw, 1998).
Further, we should note that a substantial literature addresses the development of attention and self-regulation per se, without regard to family correlates. For example, components of attentional operations as described in the cognitive literature mature at varying rates throughout childhood and into adolescence (for review and recent data, see Huang–Pollock, Carr, & Nigg, 2002) and a substantial developmental literature considers the broader construct of self-regulation from the point of view of temperament and relating those constructs to behavioral problems (Eisenberg, Cumberland, Spinrad, Fabes, Shepard, Reiser, Murphy, Losoya, & Guthrie, 2001; Kochanska, Coy, & Murray, 2001; Kopp, 1982; see Nigg, 2000, for a general overview). Thus, the field is scarcely devoid of understanding about developmental processes that are related in a broad sense to child inattention and hyperactivity/impulsivity. Nonetheless, developmental relations of family context measures to psychopathological symptoms of inattention/hyperactivity, as distinct from antisocial behaviors, remain sorely in need of further clarification in long-term, longitudinal studies.
Whereas one could nominate several family domains for further study (Frick, 1994), we elected to emphasize characteristics of the early family and home environment. Several reviewers and theorists (Greenberg et al., 1991; Winsler, 1998) have proposed a relation between responsive parenting and the development of self-regulation in children. Further, parenting style, such as captured by the authoritative/authoritarian dichotomy (Baumrind, 1968), may be more strongly related to child behavior than more discrete measures of parenting (Darling & Steinberg, 1993). Thus, one might expect that parenting style or responsiveness of the parent would relate specifically to development of child inattention/hyperactivity. Conceptually, some family characteristics may be specifically associated with development of aggression (e.g., family conflict, coercive exchange, cohesiveness, monitoring), while others are specific to the development of inattention/hyperactivity (e.g., parental responsiveness and stimulation), even though some covariation of those contexts and associated problems is expected.
In cross-sectional studies, the direction of effects also needs be considered. Several studies have found that parenting behaviors improve when disruptive children are medicated for ADHD (Barkley & Cunningham, 1979). Furthermore, family correlates can reflect both heritable and experiential processes, so that conclusions must be drawn carefully from family data with regard to specific causal mechanisms. Nonetheless, understanding of family correlates is a key kind of data needed to understand the processes by which child inattention and hyperactivity develop and are maintained over time. By measuring home and family environment factors at a time prior to the measurement of child behavior problems, we reduce the risk that the relationship we study is actually caused by the effect of the child behavior on the home and family environment.
Advantages of a Longitudinal, High-Risk Sampling Strategy
To study the problem of how family context might relate to development of child behavioral problems with inattention and activity, it is essential to have longitudinal data that permit assessment of the development of behavior problems over time. Doing so requires that children be identified before being selected for clinical diagnoses. In the current study, we followed a “high-risk” strategy, identifying children who would be at elevated risk for both aggression/conduct problems and inattention and hyperactivity/impulsivity problems, due to parental alcoholism. By not selecting specifically for risk for ADHD or aggression, we increase the generality of results with regard to the nature of family correlates with each behavioral domain. Moreover, the strategy allows us to study a sample of children with a full range of inattention/hyperactivity during development, not just children with diagnosable symptom levels. Doing so is consistent with a dimensional rather than a categorical formulation of etiology of these problems (Fergusson & Horwood, 1995).
Children of Alcoholics
In selecting a high-risk sample, we chose a sample of children of alcoholics; we briefly note some established risk characteristics in this population. Although the relation of family context and child behavior problems has often been studied in normal populations, the major questions driving this research originated in the observation that problems of both hyperactivity and aggressiveness were over-represented among children of alcoholics (Zucker & Gomberg, 1986). Early studies found greater prevalence of alcoholism in biological mothers and fathers of adopted hyperactive children, but not the legal parents (Cantwell, 1975), indicating a substantial biological component mediating this relationship. Retrospective reports of hyperactivity in alcoholic men predicted earlier onset of alcoholism and more family history of alcohol problems (Tarter, McBride, Buonpane, & Schneider, 1977). More recently, Kuperman, Scholssner, Lidrad, and Reich (1999) found that the children with alcoholic parents had a higher likelihood of having ADHD after controlling for family factors such as low income and child–parent conflict. The family environment of children of alcoholics may be an important factor in the development of inattention/hyperactivity. For instance, Reich, Earls, and Powell (1988) found that the home environment of children of alcoholics was characterized by increased marital conflict and parent–child conflict. However, marital conflict is also associated with child antisocial behaviors (Grych & Fincham, 2001) and specificity to ADHD symptoms again remains unclear because of mixed findings across studies (Johnston & Mash, 2001).
The Current Study
The aims of our study were to establish the developmental trajectories of inattention/hyperactivity behavior problems, and to examine these trajectories in relation to family context, over a 9-year time span from school entry to adolescence. To avoid the problem of confounding of inattention/hyperactivity and aggression, we examined the development of aggression in parallel with inattention/hyperactivity. Then we could hold constant the development of aggression and compare family context effects in children who only differed in inattention/hyperactivity trajectories. We hypothesized that the distinct trajectory groups describing the development of inattention/hyperactivity and aggression could be identified over this 9-year period, and that membership in a particular trajectory group would be anticipated by family context factors measured in the preschool period.
This study extends the work of Loukas and colleagues from our group (Loukas, Zucker, Fitzgerald, & Krull, 2003). The latter used hierarchical linear modeling to examine the effects of parent psychopathology, family conflict, and behavioral undercontrol on the development of children’s disruptive behavior. Their outcome of interest was disruptive behavior, as measured by the aggression subscale of the Child Behavior Checklist (CBCL; Achenbach, 1991a) from ages 3 to 12. Child undercontrol (measured via the items: inattentive; demands must be met immediately, easily frustrated; gets overexcited easily; easily bored by a repetitive activity; fails to finish things he started) was controlled as a child temperament variable at one time point, the initial contact with the children. Hence, Loukas et al. (2003) treated undercontrol as a covariate of aggression problems and measured undercontrol only at one point in time. In the current study, the outcomes of interest were the developmental trajectories of inattention/hyperactivity, with the trajectory of aggressive behavior examined so as to isolate effects of child-rearing measures on inattention/hyperactivity. In the present study, however, inattention/hyperactivity was measured across the full time course of the longitudinal study from childhood to adolescence. Furthermore, because we also measured aggression longitudinally and a parallel process model was developed, the current study allows for investigation of the effects of home and family environments on each of these trajectories independent of the other. These effects were not examined by Loukas et al. (2003).
Method
Participants
The present work is part of an ongoing multi-wave prospective study (Zucker, Fitzgerald, Refior, Puttler, Pallar, & Ellis, 2000) that is following a community sample of families with high levels of alcohol use disorders and other drug use especially among the fathers, along with a community contrast sample of families that were drawn from the same neighborhoods but that did not have the high substance abuse profile. Substance abusing men were initially identified through the courts when they were convicted of drunk driving with a high blood alcohol level (at least 0.15%, or at least 0.12% and a previous drinking-related legal problem). To be included in the study, the fathers were required (a) to have a Feighner diagnosis for probable or definite alcoholism (Feighner, Robins, Guze, Woodruff, Winokur, & Munoz, 1972), (b) to have at least one son between 3 and 5 years of age, and (c) to be living with both the child and his biological mother at the time of recruitment. Later funding allowed the inclusion of female siblings from the same families. A contrast/control group of families who resided in the same neighborhoods as the alcoholic families but with no substance abuse history was also recruited using door to door canvassing. In addition, an intermediate risk group was provided by recruiting all families with an alcohol abuse/dependence diagnosis who were found during the community canvass. For a more detailed description see Zucker et al. (2000).
The child and both parents were assessed extensively in their home following the initial recruitment (Wave 1, child age 3–5) with assessment repeated every 3 years for a total of five assessment waves. The information obtained from the parents included, among other issues, substance use, mental health, child rearing practices and ratings of children’s behavior problems. In addition, at each wave of data collection following school entry, teachers rated children’s behavior problems. Ratings were completed in elementary school by the regular teacher and in middle school and high school by the English teacher or another teacher who had significant contact with the child. Beginning in 1998, annual collection of teacher reports was begun for children 11 years and older, and continued until the child left school. The present analysis included all children for whom there were two or more waves of teacher- and parent-report data.
Successful follow-up procedures in this study have limited the number of dropouts and missed waves. However, because of complexities in the study design, not all children had data available for all waves. Most of the unavailable data were attributable to children who were recruited into the study at a time following the initial startup (e.g., the sisters of the original target boys were added to the study after the initial assessment had been made). Some of these children were added to the study when they were already past the age of 8, so they missed the Wave 2 (age 6–8) assessment entirely. Other children were not followed at Wave 2 due to funding limitations. With the exception of these “missing by design” children, very few children are missing wave data. At Wave 2, only 9 children (2.7%) were missing data for other reasons; at Wave 3 (age 9–11), 13 children (3.9%) were missing data for other reasons. At Wave 4 (age 12–14), 22 children (6.6%) and Wave 5 (age 15–18), 6 children (1.8%) were missing data for other reasons. Similarly, extensive measures were taken to collect all of the teacher report data that was available, but not all of the annual and wave data were available from all the children. For instance, the annual collection was started in 1998. At that time, some of the children were not yet 11, and some of the target children who were assessed earliest in the study were already out of school. High success rates of collection of teacher report data for the children of the appropriate age can be seen in these example rates: in school year 2000–2001, 435 Teacher Report Forms were sent out and 400 returned (92%); in 2001–2002, 385 were sent out and 346 returned (90%); and in 2002–2003, 369 were sent out and 335 returned (91%).
The 335 children with two or more waves of data were in 248 families: 85 of the families included 2 participating siblings, 1 family had 3 participating children, and the remaining 162 families had only 1. Of the children in this sample, 238 (71%) are boys, because girls, who were all siblings of the initial boys in the sample, were included in the study well after the first assessments. The total sample sizes for parent reports were 256 for ages 6–8, 299 for ages 9–11, 295 for ages 12–14, and 205 for ages 15–17; and for teacher report data there were 151 for ages 6–8, 251 for ages 9–11, 289 for ages 12–14, and 231 for ages 15–17.
Measures
DSM-IV (APA, 2000) alcohol abuse/dependence diagnoses in the parents were assessed with the Diagnostic Interview Schedule (DIS-III; Robins, Helzer, Croughan, & Ratcliff, 1980) as well information provided from the Drinking and Drug History (Zucker, Fitzgerald, & Noll, 1990), at the first wave of data collection. Only an alcohol diagnosis in adulthood (over age 20) was considered, because remitted adolescent alcoholism would be less likely to affect children via the family environment. For the purposes of analysis, either parent’s diagnosis was sufficient for a family classification of “alcoholic”; however, in 25% of the families, both parents met criteria for a diagnosis of alcoholism. Overall, there were 225 families that met the definition of family alcoholism: 129 families with only the father meeting alcohol diagnosis, 93 in which mother and father were lifetime alcoholics, 3 families with only the mother having lifetime alcohol diagnosis, and 110 families with no parent having lifetime alcohol diagnosis.
Socioeconomic status (SES) was evaluated based on occupational prestige, using the Duncan TSEI2 Socioeconomic Index (Stevens & Featherman, 1981). Family income was estimated by taking the average of each parent’s report of family annual income, adjusted to 1998 dollars.
Child behavior was rated by parents on the Attention Problems subscale of the CBCL (Achenbach, 1991a) and by teachers on the Teacher Report Form (Achenbach, 1991b) at each assessment period. Both parents responded and their reports were averaged (intercorrelations between mother and father report at each time point ranged from 0.40 to 0.53 across the four waves of data). Data from biological parents was used when available; otherwise, we used ratings from step-parents if available. These forms are widely used and recognized empirical measure of child behavior problems, with excellent reliability and validity (Achenbach, 1991a, 1991b). Items are rated on a 3-point scale: not true, somewhat or sometimes true, or very true or often true. The Attention Problems subscale includes 20 items such as “can’t concentrate, can’t pay attention for long,” “can’t sit still, restless, or hyperactive,” and “poor school work.” It thus includes features of both inattention and overactivity, the two core domains associated with ADHD as defined in DSM-IV (APA, 2000) and high scores have relatively good convergence with ADHD diagnoses made from structured interviews (Chen, Faraone, Biederman, & Tsuang, 1994). The Aggression subscale contains 20 items, including “gets in many fights,” “argues a lot,” “physically attacks people,” and “temper tantrums or hot temper.” It thus reflects antisocial behaviors and aggressive behaviors. For each of the problem behavior subscales, the range of possible scores was 0– 40, with 0 being no problems reported and 40 being often true for all 20 items. Actual scores ranged from 0 to 37 for inattention/hyperactivity and 0 to 28 for aggression.
Given the known variations in child behavior as a function of setting (Nesselroade, 1992), the choice of whether to use parent or teacher ratings (or both) is a conceptual as well as a practical issue. This is especially the case for behaviors with a socially undesirable component, such as aggressiveness, for which dampening is more likely to occur in public (e.g., school) than in private (e.g., home) settings. The problem is also evident in circumstances when the social environment is less evocative of the behavior being evaluated. Thus, for inattention/hyperactivity, the school setting in contrast to the home should be more evocative of difficulties because of the nature of school task demands. Indeed, in our data, we found that teachers rated the children as having more inattention/hyperactivity than the parents, whereas parents rated the children as having more aggressive behaviors. Previous research has also found that the teacher reports of inattention/hyperactivity yielded more discrimination of these problems than did parent reports (Loeber et al., 1990). Second, we hoped to evade negative halo effects, in which a child with one type of problem is rated inaccurately as having additional problems (e.g., Stevens, Quittner, & Abikoff, 1998). For these reasons, we selected different informants for measurement of the dependent variables. We used parent ratings to assess aggression, and teacher ratings to assess inattention/hyperactivity. We note later that this choice did not yield different results than the more conceptually questionable alternative of parent–teacher composites.
The child-rearing environment was evaluated in three ways. First, the preschool version of the Home Observation for Measurement of the Environment (HOME; Bradley, Caldwell, Rock, Hamrick, & Harris, 1988) was used to measure intellectual stimulation and social and emotional support provided by parents as well as the physical environment. A trained interviewer conducted an interview of the mother in the child’s home during the first wave of assessment (child between ages 3 and 5) and completed the HOME inventory based on the interview as well as observation of the home. The HOME scale has been used extensively and relates well to child developmental outcomes, including IQ and externalizing behavior (Duncan, Brooks–Gunn, & Klebanov, 1994; Luster & McAdoo, 1994). The alpha reliability of the scale total score was 0.68.
Second, the Family Environment Scale (FES; Moos & Moos, 1994) was completed by both parents at the first wave of data collection. The FES is comprised of 10 subscales, grouped into three dimensions: Relationship (Cohesion, Expressiveness, and Conflict), Personal Growth (Independence, Achievement Orientation, Intellectual–Cultural Orientation, Active–Recreational Orientation, and Moral–Religious Emphasis), and System Maintenance (Organization and Control). Relation of FES subscales to child outcomes has been shown, for example, by the finding that alcoholic families who scored higher on Cohesion and Organization had children with greater self-esteem and less anxiety (Moos & Moos, 1994). Sanford Bingham, and Zucker (1999) found poor psychometric properties on four of the FES scales: Expressiveness, Control, Independence, and Achievement. Those four scales therefore were omitted herein. To isolate the factors relevant to our study, we conducted a factor analysis of the remaining 12 scores (mother and father report on the six other FES subscales), resulting in a four-factor solution. The first factor consisted of mother’s and father’s reports of Cohesion, Organization, and Conflict (reverse coded), which accounted for 27% of the variance, and was the factor of substantive interest to our study due to our interest in family stability and cohesiveness. (The other three factors, of less interest and so omitted from our subsequent analysis, were moral–religious emphases, active–recreation orientation, and intellectual–cultural orientation). This factor analysis result parallels the previously reported factor structure for this instrument (Gondoli & Jacob, 1993). The three scales loading on the first factor were thus averaged (across mother and father report) to form a single scale that we called FES Cohesiveness (α = 0.76).
Third, information on parenting styles was obtained at Wave 1 via maternal ratings on the Child Rearing Practices Report (Block, 1981). This is a Q-sort instrument in which the mother ranks various aspects of her parenting into seven categories from most important to least important. Authoritarian and Authoritative parenting scales were derived from this instrument following Kochanska (1989). Mothers with an authoritarian style of parenting seek to control the child through physical punishment and fear, with a great deal of supervision of the child. Mothers using authoritative styles of parenting are more likely to discipline with reasoning and praise, to encourage the child’s independence and to provide a warmer environment.
Symptoms of ADHD (inattention/hyperactivity) in the parents are a possible confounding factor in linking child inattention/hyperactivity with family environment or parenting. Parents with inattention/hyperactivity are more likely to have children with inattention/hyperactivity (Frick, Kamphaus, et al., 1991) and may also provide a less optimal parenting and family environment. Parent ratings of their own childhood symptoms of inattention and hyperactivity were obtained by interview using the DIS.
Parents were asked to report if their child was on a medication program for hyperactivity as well as if they were on medication for any other chronic problem. Between the ages of 6 and 17, 20 children (6.1%) were reported to be taking medication for hyperactivity or were taking a drug that may have been prescribed for inattention, impulsivity, or hyperactivity. The analysis was repeated excluding these children to check effects of medication usage on the analysis.
Data analysis
Handling missing data
The Mplus program was used to handle missing data in the models (Muthén & Muthén, 1998). The missing data method used by this program estimates the parameters with a full information maximum likelihood estimator using all observations in the data set. In mixture models, the Mplus program allows missing data for the dependent variables (in this analysis, child behaviors), but not the predictors (in this analysis, the child-rearing/family environment variables). To use as much of the data as possible, we used the entire sample of 335 for the latent growth model and the unconditional growth mixture models (i.e., models without the child-rearing predictor variables in them). When predictors were included in the subsequent models (i.e., HOME, Child-Rearing Practices, and FES Cohesiveness), missing data for them was handled as follows. First, the growth mixture models with predictors were estimated for the smaller sample that had no missing predictors. This allowed us to check whether there were changes in predicted class membership and growth parameters between the full sample and the sample limited by the predictor variables. Because there were no major differences between the limited data set models and the full models, and because we judged the amount missing small enough to ignore, we accepted this listwise deletion for the FES and Child-Rearing Practices analyses. The predictor with the most missing data was the HOME, for which 113 (33.7%) of the children did not have data. To address this, for analyses with HOME as a predictor, models were first run in Mplus with the 222 children who had HOME scores. Then, the analyses were repeated with the HOME score imputed for the children missing the HOME. Imputation in this case was accomplished using the estimation maximization algorithm, which is a type of maximum likelihood method for data imputation. These methods are considered a superior option versus either listwise deletion or mean or regression based estimation (Schafer & Graham, 2002). Further detail on these analyses is provided later.
Handling siblings and nonindependence
Because multiple children from the same family (up to two in most cases, with three siblings from only one family) were included in the study, the assumption of independence was violated. To estimate the effect of this nonindependence, the design effect was estimated as (Muthén, 2000)
where ρ is the intraclass correlation and c is the common cluster size, a measure of the average number of units per cluster (in our case this is the average number of children per family). Generally, a design effect of <2.0 is considered acceptable and small enough to be ignored based on simulation data (Muthén & Satorra, 1995). For the 335 children in 248 families, the common cluster size in our data-set was 1.35, indicating that the maximum possible design effect was also 1.35. Because this was within the range considered small enough to ignore, we proceeded to fit models with all children. As a simple check on the effect of the violation of independence, models were also run with boys only, because all the boys in the sample are from different families and all the girls are siblings of these boys. The basic results held, as detailed later.
Latent growth modeling
Latent growth modeling is a statistical procedure that develops latent variables to describe different facets of the trajectories. In this case, we used a linear model, which consists of slope and intercept. Furthermore, inattention/hyperactivity and aggression were modeled as a parallel growth process, as shown in Figure 1. This type of analysis is analogous to examining aggression as a covariate of inattention/hyperactivity, while taking into account the developmental nature of the aggressive behavior as well as of the inattention/hyperactivity (Muthén, 2001). The four latent variables, shown in ovals, describe the trajectories of the two types of behavior problems. The indicators of these latent variables are the measured aggression and inattention/hyperactivity at each time point, shown in rectangles.
Figure 1.
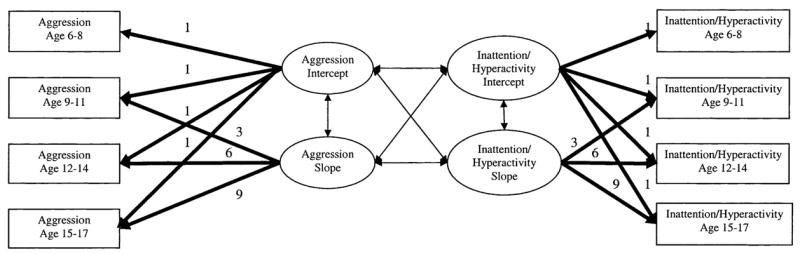
The parallel process model of inattention/hyperactivity and aggression. The bold arrows that have a number above the arrow represent model parameters that are fixed to the number indicated; the light arrows represent model parameters that are estimated. Residual variances (not shown) were estimated for each measured variable (in rectangles).
Primary analyses of latent classes
Latent trajectory class analysis was performed using Mplus software (Muthén & Muthén, 1998). This type of analysis, also called growth mixture modeling, allows one to find underlying heterogeneity of trajectories over several time points in a sample. The method builds upon latent growth modeling, in which a set of growth parameters is found for an entire sample. Growth mixture modeling extends this analysis by creating a categorical latent variable, which allows the trajectories in the sample to be defined by multiple sets of growth parameters. For instance, one class may have a high intercept and a positive slope (indicating a high level of initial problem behaviors that is worsening over time), whereas a different class could have a lower intercept and a negative slope (lower level of initial problems, improving over time). Given a certain number of classes, the estimation of the model involves determining (a) the sets of growth parameters that best define those classes, and (b) how many and which individuals are best fit into each class. To arrive at the optimal number of classes to describe the data, models are estimated for an increasing number of classes in succession. The best number of classes is determined by examination of substantive and statistical issues, described later with our results.
In these analyses, the trajectories of parallel growth of inattention/hyperactivity and aggression were examined for fit into latent classes. A limited set of trajectory shapes was allowed for each behavior problem, so that variations in development of one type of behavior problem could be examined in cases where the other type of behavior problem was essentially “held constant” by requiring the growth parameters to be equal. For instance, growth parameters of aggression were held equal across classes of inattention/hyperactivity to examine effects of child-rearing factors on inattention/hyperactivity trajectories. Figure 2 shows the schematic for this model. Each behavior has two growth parameters as in Figure 1. Now for each behavior there is also a latent categorical variable called the trajectory class indicator. These are the latent variables that define class membership. For these analyses, the model chosen as best fitting, based on substantive and statistical considerations detailed in Results, was one in which attention and aggression problem trajectories were each modeled with two classes so the trajectory class indicators would each have two possible values. This resulted in a 2 × 2 or four-class solution overall.
Figure 2.
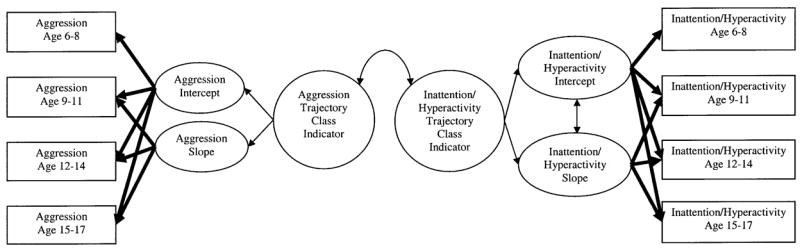
The latent trajectory class analysis model of parallel development of inattention/hyperactivity and aggression.
After this unconditional four-class model had been developed, it was used as a basis to evaluate our hypotheses about the relative contribution of various early predictors to the development of behavior problems. This was done independently for each of our three early predictors (the HOME total score, the FES Cohesiveness Scale, and the Child Rearing Practices authoritarian and authoritative scales). Each model was the same as the unconditional model shown in Figure 2, with the addition of child-rearing variables as predictors of the trajectory class indicators.
Results
Preliminary overview of the data
Despite careful matching, alcoholic families had lower income and SES than nonalcoholic families. The mean income for alcoholic families was $44,400 (SD = 21,500), whereas that for nonalcoholic families was $54,000 (SD = 19,700, t = 4.1, p < .001, Satterthwaite test, not assuming equal variances). For alcoholic families mean SES was 320.0 (SD = 115) and for nonalcoholic families mean SES was 385.0 (SD = 145, t = 4.1, p < .001).
Table 1 presents zero-order correlations between family environmental factors and child inattention/hyperactivity and aggression, for a first-pass descriptive examination of the relationships between the variables in this analysis. The summary problem behavior scores are averages across all time points throughout the study for each problem behavior. As expected, behavior problems in the two domains were correlated. Higher level of intellectual stimulation and emotional support (HOME) and higher scores on the FES Cohesiveness factor were associated with lower levels of both inattention/hyperactivity and aggression in children. There was no correlation between parenting style and child behavior problems. As expected, parental alcoholism was associated with more inattention/hyperactivity and aggression in children. For the most part, alcoholic families presented a lower level of functioning of the home environment as well. They scored lower on both the HOME and the FES Cohesiveness factor. The Child Rearing Practices Authoritarian factor did not differ between alcoholic and nonalcoholic families, although the Authoritative factor was higher in the alcoholic families (p < .01).
Table 1.
Correlations between family and parenting factors and child attention and aggression problem scores
| Parenting
|
|||||||||
|---|---|---|---|---|---|---|---|---|---|
| M | SEM | Inattention/Hyperactivitya | Aggressiona | Intellectual Stimulation/Emotional Support | Parental Alcoholism | Cohesiveness Factor | Authoritarian | Authoritative | |
| Inattention/hyperactivitya | 7.2 | 0.37 | — | .37*** | −.42*** | .27*** | −.15** | .10 | −.03 |
| Aggressiona | 8.1 | 0.21 | — | −.24*** | .16** | −.26*** | .08 | .03 | |
| Intellectual stimulation/emotional support | 44.9 | 0.33 | — | −.19** | .19** | −.10 | .19** | ||
| Parental alcoholism | .67 | 0.03 | — | −.15* | −.04 | .18** | |||
| FES Cohesiveness factor | 51.8 | 0.19 | — | .07 | .12 | ||||
| Parenting | |||||||||
| Authoritarian | 10.9 | 0.11 | — | −.30*** | |||||
| Authoritative | 16.6 | 0.08 | — | ||||||
Inattention/hyperactivity and aggression were averaged across the course of the study to form a summary score. Two-tailed significance:
p < .05.
p < .01.
p < .001.
At each data collection wave, some children scored in the clinical range for inattention/hyperactivity. We defined the clinical range of the data as the score of the 98th percentile of the sample control group (Drotar, Stein, & Perrin, 1995). The number of children in the clinical range was 18 (8.3%) for Wave 2, 14 (5.6%) for Wave 3, 17 (6.9%) for Wave 4, and 10 (6.9%) for Wave 5.
Preliminary parallel process latent growth model of inattention/hyperactivity and aggression
As explained earlier, the development of inattention/hyperactivity and aggression in the children was modeled with a parallel process latent growth model, in which two latent growth models are developed simultaneously and the growth factors for each are allowed to covary. Recall that this initial model did not try to sort children into classes, but simply described the growth parameters in the entire sample. We used a linear model, which estimates a trajectory for each child, identified with two growth parameters: an intercept and a slope for each type of problem behavior (McArdle & Epstein, 1987). Figure 1 shows the schematic for this model. Each arrow in the schematic represents a parameter estimated in the model. For instance, the arrow connecting “Aggression Intercept” and “Aggression Slope” represents the model parameter of the covariance of these two parameters. The growth parameters are defined by setting the loadings of the values measured at each age to 1.0 (indicated by the number above the arrow) for the intercept latent variable and proportional to the time elapsed for the slope variable (e.g., the loading of slope on Aggression Age 9–11 is 3, because there were three years from the start of the study to this point). Error variances for each indicator were estimated, but are not shown in the figure.
This initial latent growth model estimated for all children (again, no classes estimated at this stage) fit well. The chi-square was not significant, χ2 (22) = 28.4, p = .16, as is desired in a well-fitting model. Other fit indices were well within the acceptable range. The comparative fit index and Tucker–Lewis index, for which a value of .95 or higher is desirable, were .99. The root mean square error of approximation, for which desirable values are less than .06, was .029. This model produces estimates of inattention/hyperactivity and aggression trajectories for the entire sample, defined by mean and variance of the growth parameters and shown in Figure 3 (bold lines). For inattention/hyperactivity, the mean intercept was 6.8, and mean slope was 0.04 (ns). The mean aggression intercept was 8.6 and mean slope of aggression was −.30. Consistent with our expectation that this was not a problem-free risk sample, the intercept terms for inattention/hyperactivity and aggression were significantly different from zero. The slope of aggression problems was significantly negative, indicating improvement over time. These intercepts are given in the units of the original raw score on these scales, and thus reflect relatively low to moderate average levels of behavior problems in the sample as a whole. A score of 6 could indicate, for example, a rating of very often true (2) for three items or a sometimes true (1) for six items. Figure 3 shows the results of this parallel process latent growth model, with the bold lines showing the mean trajectories and the light lines each representing an individual’s development of behavior problems. There was significant variance in all of the growth parameters, indicating enough variability in growth parameters between subjects that it was reasonable to conduct further analyses to explain more variability. We next attempted such explanation using latent trajectory class analysis, in effect assuming multiple populations of children with different trajectories of behavior problems.
Figure 3.

The trajectories of inattention/hyperactivity and aggression development for the latent growth model. The heavy lines show mean trajectories of inattention/hyperactivity and aggression, and each thin line represents the trajectory of an individual.
Latent trajectory class analysis models
Latent trajectory class analysis is a technique that seeks to explain some of the variance in the trajectories in a sample by assuming that the sample is drawn from different populations, each having a different set of growth parameters. In addition, in the current modeling we sought to identify classes that only differed in one type of behavior problem. Accordingly, in the four-class model, two classes had equal trajectories of aggression development and two had equal trajectories of inattention/hyperactivity development. This was accomplished by setting the parameters for the trajectories equal in the classes for which equivalent trajectories were desired.
Choosing the number of classes
Choosing the number of classes is based on several criteria, including statistical considerations, such as the Vuong–Lo–Mendell–Rubin likelihood ratio test (VLMR LRT), which provides a statistical test of the fit of a model compared to a model with one less class. Another criterion is the robustness of the model to find the same solution with different starting values. Inspection of the trajectories of the different classes provides a substantive evaluation of the necessity of using more or fewer classes.
Each individual in the model is assigned a probability of membership in each of the classes and can be said to be “in” the class for which he or she is assigned the highest probability of membership. Classification quality is determined by averaging the probability of membership in each class for all the individuals. Values that are close to 1 for the individuals in the assigned class and close to 0 for individuals in the other classes are desired. For instance a value close to 1 for the Class 1 element for the class one individuals indicates that all of the individuals in Class 1 have a high probability of being in Class 1 and a low probability of being in any other class.
When we followed the procedure of increasing the number of classes in successive models and examining the various relative fit indices, the four-class model was clearly chosen by the statistical criteria over a three-class model, with a significant VLMR LRT (p = .03), indicating a significantly better fit for the four-class than the three-class model. The substantive difference between trajectories for both inattention/hyperactivity and aggression was similarly clear for choosing two classes over one class for each of these behavior problems. The four-class model was also robust with respect to different start values for the intercepts and slope of the problem behavior trajectories. The classification quality was acceptable, with average class probabilities of Class 1 = .89, Class 2 = .84, Class 3 = .84, and Class 4 =.93. Because the primary focus of this study was the developmental nature of inattention/hyperactivity controlling for aggression, as a further check we also tested a model in which three classes of trajectories were allowed for inattention/hyperactivity (resulting in a 3 × 2 or six-class model overall). However, this six-class alternative model was not able to converge on a solution, even when multiple starting values were attempted. We therefore accepted the four-class solution as the best fit to these longitudinal data.
These four classes were quite interpretable. We labeled the classes as follows: (a) the Comorbid class had a high intercept and level slope on both inattention/hyperactivity and aggression, (b) the Inattentive class had a high intercept on inattention/hyperactivity but a low intercept on aggression, (c) the Aggressive class was high on aggression but not inattention/hyperactivity, and (d) the Healthy class exhibited the lowest level of both aggression and inattention/hyperactivity. To isolate effects of inattention/hyperactivity and aggression, in the two high attention classes (Comorbid and Inattentive) the inattention/hyperactivity trajectories (parameters of intercept and slope) were fixed to be equal (compare mean trajectories for inattention/hyperactivity in these two classes in Figure 4). For the classes with high inattention/hyperactivity trajectories, Inattentive and Comorbid, one set of parameters described the growth of inattention/hyperactivity of the two classes, forcing them to be equal. A different set of parameters was used for inattention/hyperactivity trajectories of the two low inattention/hyperactivity classes, the Aggressive and Healthy classes. Similarly, one set of parameters was used for aggression in the high aggression classes (Aggressive and Comorbid) and another set was used for the two low aggression classes (the Inattentive and the Healthy classes). This procedure allowed us to examine in isolation classes that only differed with respect to one type of behavior problem while holding the other constant.
Figure 4.


The trajectories of inattention/hyperactivity and aggression development for the four-class latent trajectory class model. For each class, two graphs are displayed: one of development of inattention/hyperactivity over time, and the other the development of aggression over time. Heavy lines show mean trajectories for each class, and each of the thin lines represent the development of behavior problems for one individual. Inattention/hyperactivity growth parameters were fixed equal in the Comorbid and Inattentive/Hyperactive classes and in the Aggressive and Healthy classes. Aggression problem growth parameters were fixed equal in the Comorbid and Aggressive classes and in the Inattentive/Hyperactive and Healthy classes.
The mean growth parameters are shown in Table 2 and define the mean trajectories shown in bold in the graphs in Figure 4 for inattention/hyperactivity and aggression respectively. For each class, we show a graph of inattention/hyperactivity and then one of aggression problems. Sample individual trajectories (light lines, Figure 4) are individual raw scores grouped into classes according to the outcome of the unconditional growth model. Both inattention/hyperactivity trajectories (high and low) were flat, one with an intercept of 11.0 and a nonsignificant slope of −0.04 (the high inattention/hyperactivity, characterizing both the Comorbid and the Inattentive class) and the other with an intercept of 1.2 and a nonsignificant slope of 0.08 (the Aggressive and Healthy classes). For aggression, the high problem trajectory class (intercept = 12.4, characterizing the Aggressive and the Comorbid classes) had a constant level of problems over time (i.e., with a nonsignificant negative slope), whereas the low problem class (intercept = 6.97, characterizing the Inattentive and Healthy classes)had a decreasing problem trajectory over time (p < .001). With regard to prevalence of each class, the Healthy class was the most common, with 39% of the sample. This group displayed the lower trajectories for both types of problem behaviors, and decreasing aggression over time. The Inattentive class was the next most common, with 33% of the children falling in that group. The Comorbid class had 23% of the children, and the Aggressive had 4%.
Table 2.
Latent trajectory class analysis of parallel process model for inattention/hyperactivity and aggression
| Inattention/Hyperactivity
|
Aggression
|
|||||||
|---|---|---|---|---|---|---|---|---|
| Class | Trajectory | Intercept | Slope | Trajectory | Problem Intercept | Problem Slope | n | % |
| Comorbid | High | 11.0* | −0.04 | High | 12.4* | −0.17 | 82 | 24 |
| Aggressive | Low | 1.2* | 0.08 | High | 12.4* | −0.17 | 12 | 4 |
| Inattentive/hyperactive | High | 11.0* | −0.04 | Low | 6.97* | −0.39* | 111 | 33 |
| Healthy | Low | 1.2* | 0.08 | Low | 6.97* | −0.39* | 130 | 39 |
Note: Inattention/hyperactivity growth parameters were fixed equal in the Comorbid and Inattentive/Hyperactive classes (high) and in the Aggressive and Healthy classes (low). Aggression problem growth parameters were fixed equal in the Comorbid and Aggressive classes (high) and in the Inattentive/Hyperactive and Healthy classes (low).
Significantly different from zero, p < .05.
Family factors as predictors of trajectory class membership
With this basic four-class developmental model in place, we proceeded to examine familial predictors of class membership. Parental alcoholism and the three measures of the child-rearing environment were used to predict trajectory class membership in the parallel process latent trajectory class model. Each predictor was tested independently of the others, in a multinomial regression of the class membership on the child-rearing variable, within the Mplus model. Odds ratios were then computed to test the effect of the predictor on the odds of being in the particular class of interest. The first item to examine when adding predictors to a model is whether the model still finds the same solution. We found that that the solution remained quite similar for any of the predictors added to the model. The models all resulted in a four-class solution in which the most prevalent class was the Healthy class and the membership of this class varied between 37 and 39%. The second most prevalent class was always the Inattentive class; membership for this class varied from 34 to 38%. The Comorbid class membership varied between 24 and 25%. Finally, the Aggressive class was always rare, comprising only 1.2–4% of the sample. The growth parameters estimated by the model also remained relatively unchanged by the addition of the predictors. Thus, the inattention/hyperactivity intercept ranged from 11.0 to 11.5 for the high classes and from 1.2 to 1.6 for the low classes. Aggression intercept ranged from 12.4 to 13.2 for the high classes and 7.0 to 7.2 for the low classes. Slope estimates were also quite similar. In all cases, the parameter estimates that were not significantly different from zero remained so and the ones that were significantly different from zero also remained so. These results show that the model was quite stable to the addition of predictors and gave us confidence in our ability to meaningfully interpret these results.
To separate the effects of inattention/hyperactivity and aggression trajectories in relation to home environment predictors, a series of two-group comparisons were conducted using multinomial regression within the same modeling environment. Comparisons were made between classes, which only differed in the trajectory of one type of problem behavior at a time (i.e., either inattention/hyperactivity or aggression), in effect holding the other behavior constant. For each behavior problem, two sets of comparisons were made, one for each level of the other type of behavior problem. For instance, as shown in Figure 4, the Comorbid class and the Aggressive class both have the same high mean trajectory of aggressive behavior (this is by design; They are fixed to equality as described earlier). These classes therefore only differ in the trajectory of inattention/hyperactivity, which is higher in the Comorbid class. Tables 3 and 4 show the results of the multinomial regressions predicting membership in trajectory classes. Table 3 shows odds ratios for predicting membership in the higher trajectory class of inattention/hyperactivity compared to low inattention/hyperactivity, for the two sets of classes in which the aggression trajectory was the same. Classes with low aggression trajectories were Healthy and Inattentive, whereas those with high aggression trajectories were Aggressive and Comorbid. Odds ratios for continuous predictors, such as HOME scores and FES Cohesiveness, show the relative change in likelihood in membership in the higher behavior trajectory classes for a one unit change in the predictor. As seen in Table 3, for example, for each one unit higher HOME score, children had 86% lower odds of being in the higher inattention/hyperactivity class, compared to the lower inattention/hyperactivity class. The interpretation for a binary variable is simpler, with the odds ratio being the ratio of the odds for the two classes. For example, Table 3 shows that for the group of children with higher aggression trajectories, those with an alcoholic parent have 11.7 times higher odds of being in the high inattention/hyperactivity trajectory class. Table 4 shows odds ratios for predicting membership in the higher trajectory class of aggression compared to low aggression, for the two sets of classes in which the inattention/hyperactivity trajectory was the same.
Table 3.
Odds ratios for predicting membership in higher vs. lower inattention/hyperactivity trajectory classes
| Emotional Support and Intellectual Stimulation | Parental Alcoholism | Cohesiveness | |
|---|---|---|---|
| Within low aggression trajectory group (Inattentive/Hyperactive vs. Healthy classes) | 0.86** (0.78–0.95) | 2.1* (1.1– 4.1) | 0.87 (0.64–1.2) |
| Within high aggression trajectory group (Comorbid vs. Aggressive classes) | 0.87** (0.80–0.95) | 11.7** (1.6–84.8) | 1.2 (0.67–2.0) |
p < .05.
p < .01.
p < .001.
Table 4.
Odds ratios for predicting membership in higher vs. lower aggression problem trajectory classes
| Emotional Support and Intellectual Stimulation | Parental Alcoholism | Cohesiveness | |
|---|---|---|---|
| Within low inattention/hyperactivity trajectory group (Aggressive vs. Healthy class) | 0.94 (0.82–1.0) | 0.25 (0.04–1.6) | 0.44* (0.24–0.84) |
| Within high inattention/hyperactivity trajectory group (Comorbid vs. Inattentive/Hyperactive class) | 0.95 (0.88–1.0) | 1.4* (1.1– 4.1) | 0.59* (0.43–0.82) |
Note: Odds ratio (95% confidence interval).
p < .05.
p < .01.
p < .001.
In relation to the primary study hypotheses, consistent with a model in which stimulation and support contribute to attention development, lower HOME scores predicted that the children were more likely to be in classes with higher inattention/hyperactivity trajectories (with aggression trajectories held constant, shown in Table 3). Membership in lower aggression trajectory classes was not predicted by the HOME total score when inattention/hyperactivity trajectory classes were held constant (Table 4). Conversely, a cohesive family environment (FES Cohesiveness) predicted membership in lower aggression trajectory classes when inattention/hyperactivity trajectories were held constant (Table 3) but did not predict attention class membership.
With regard to other predictors, having an alcoholic parent was associated with membership in the higher inattention/hyperactivity trajectory classes. It was also associated with the higher aggression trajectory group, but only for high attention trajectories (i.e., Comorbid vs. Inattentive, but not Aggressive vs. Healthy). Authoritarian and authoritative parenting styles (Child Rearing Practices) did not predict trajectory class membership (data not shown).
Potential confounds
The possible confound of parent’s inattention/hyperactivity in childhood was tested by using it as a predictor of trajectory class. Although father’s inattention/hyperactivity did not predict membership in any of the different trajectory classes, mother’s report of her own childhood inattention/hyperactivity problems predicted membership in aggression trajectory classes (again, while holding inattention/hyperactivity trajectories constant). It did not predict membership in inattention/hyperactivity trajectory classes. Thus, parental history of inattention/hyperactivity did not account for the primary findings.
As we noted earlier, the Mplus modeling program does not allow missing data for predictors (the child-rearing environment variables). Hence, when data is missing for predictors, list-wise deletion was performed in the results just described. For the HOME score, there was a large percentage of the sample missing (33.8%). Listwise deletion, while widely used in psychological research, has many known shortcomings (Graham, Cumsille, & Elek Fisk, 2003; Schafer & Graham, 2002). To test whether this methodology had biased the results, the analysis was repeated using imputation of the HOME data by the EM algorithm as described in the Method section. As in the original data set, HOME scores predicted membership in trajectory classes that only differed in inattention/hyperactivity trajectory (odds ratio [OR] = 0.78), but not aggression (OR =1.003). These results provide some assurance that the effects of the HOME on trajectory class membership were not merely a result of an inferior missing data handling algorithm.
As a check on the assumption that these results were not attributable to nonindependence of the siblings used in the analyses, the unconditional model and the model with HOME as predictor were estimated using only the boys, all of whom are in different families. The intercept of inattention/hyperactivity in the two classes with lower inattention/hyperactivity trajectories (Aggressive and Healthy) was 35% higher than before, but all of the other parameters were within 10% of the full sample model. Consistent with the previous results, those children with higher HOME scores were less likely to be in classes with higher inattention/hyperactivity trajectories (OR = 0.86, p < .005).
Next, we considered that the source of predictor report was confounded with the behavior domain (parents reported on aggression and teachers on inattention/hyperactivity). To evaluate whether results depended on this procedure, we repeated the entire analysis sequence, from unconditional model through predicting membership with child-rearing measures, using a composite measure of teacher reports and parent reports for each behavior problem. That analysis again yielded a four-class solution as the best solution, and reproduced the basic association of HOME with attention, and FES Cohesiveness with aggression, as reported above.
Finally, we noted that 20 children were reported to have been on ADHD medication at some point during the course of the study. We estimated both the unconditional model and the model with HOME as a predictor, excluding these children from the analysis. In the unconditional model, class membership was within 2% of the model with all children. For the inattention/hyperactivity intercepts, the estimates were lower for both high and low trajectory classes (by 9 and 10%, respectively). For the intercept of aggressive problems, the estimates were within 5% of the original estimates. All of the significant slopes were within 2% of the original model estimates. When HOME was used as a predictor of class membership, it remained a significant predictor for classes differing in inattention/hyperactivity trajectory only (OR = 0.86, p < .01), whereas FES scores significantly predicted membership in classes differing in aggression only (OR = 0.44, p < .05).
Discussion
This is one of the first attempts to examine effects of family and home environment on the development of children’s inattention/hyperactivity with growth mixture modeling. The two most striking findings were the emergence of four classes or pathways of development, and the double dissociation with regard to family environment, in which early stimulation (HOME Score) predicted attentional trajectories but not aggression, and family Cohesiveness (FES) predicted aggression but not inattention/hyperactivity. We discuss each of these in turn.
First, let us comment on the nature of the trajectory paths we obtained. To recap, we obtained reports of inattention/hyperactivity and aggression from the early school years throughout childhood into adolescence, using continuous measures of these important externalizing behavior problems. With growth mixture modeling, we were then able to categorize the children in a statistically supported way, into groups based on the trajectory of development of these problems. The first step in such modeling was to develop a latent growth model of the development of the two behavior problems for the entire sample. This model showed that inattention/hyperactivity overall tended to remain constant throughout the course of childhood while aggression problems were decreasing.
An important element of the study was that our methodology isolated inattention/hyperactivity from overlapping aggression. This confound has rendered interpretation of family influences on inattention/hyperactivity problematic in much of the literature. We did this by modeling the growth of inattention/hyperactivity and aggression as a parallel process and creating multiple trajectory groups in which the trajectory of one type of behavior was held constant, while the trajectory of the other type of problem varied. A four-class model was chosen as the best fitting model, with two classes for inattention/hyperactivity trajectories and two for aggression trajectories. The class with the largest number of children had stable, low levels of inattention/hyperactivity and moderate and decreasing levels of aggression. The next most prevalent class had higher, stable levels of inattention/hyperactivity while their level of aggression started out higher than the normative class and was decreasing throughout childhood and adolescence. Even though this group was remitting from aggression, in the normative way, they were not improving in their attention problems/hyperactivity. The third most prevalent class was the most problematic class, with high levels of aggression that were only slightly remitting throughout childhood and adolescence and with high stable levels of inattention/hyperactivity. This is obviously the most disruptive group and continued to experience greater problems of both types throughout adolescence. Only a small group of children were in the class with high levels of aggression and low levels of inattention/hyperactivity. This is consistent with findings that there are few children with aggressive problems who do not have inattention/hyperactivity in most population samples (Nagin & Tremblay, 2001).
Moreover, it is noteworthy that the inattention/hyperactivity and aggression did not evolve in parallel for many of the children. All of the trajectory class had flat levels of inattention/hyperactivity, but 72% of the children were in a decreasing aggression trajectory group. These trajectory findings were quite comparable to those of Nagin and Tremblay (1999). They found that 80% of a community sample of 1,037 boys, drawn from low socioeconomic areas of Montréal and assessed repeatedly from 6 to 15 years of age, were in decreasing aggression trajectory classes, whereas only 4% were in a high stable group. Their results were quite similar for hyperactivity. Their finding of substantial but not complete, overlap between problem domain trajectories was in agreement with our results. In another report from the same study, Nagin and Tremblay (2001) used modeling to jointly estimate hyperactivity and physical aggression development. They found four classes for each type of behavior yielded the best fit for their model. Their larger sample size may have allowed finer differentiation of classes. Grouping their data into a high/low trajectory as ours, 62% of the sample showed the low trajectories for both problem behaviors. This is comparable to the 39% found in the current study’s Healthy class. The lower percentage in the present study could reflect that ours was a high-risk sample. They identified 1.8% as following high aggression, low hyperactivity trajectories, similar to our placement of 4% in the Aggressive class.
Our finding of a decreasing trajectory of aggressive behavior is consistent with that of a number of other investigators, besides those just mentioned (cf. Loeber, 1982, pp. 1439–1440, for a review). For instance, over the ages of 9–14, there was a decrease in teacher- and self-report aggression and fighting in a sample of 115 girls and 104 boys (Cairns, Cairns, Neckerman, Ferguson, & Gariépy, 1989). It should be noted however, that a different pattern might have appeared had we instead assessed other antisocial misbehaviors related to delinquency, given that the transition to adolescence is frequently marked by an increase in problem behavior (Stanger, Achenbach, & Verhulst, 1997). Similar to the aggression and delinquency trajectories found by Stanger et al. (1997), an early examination of the trajectory of delinquency in our own data, as measured on the Delinquency subscale of the Achenbach CBCL (Mayzer, Moñtanez, Wong, Puttler, Fitzgerald, & Zucker, 2002) and based on a heavily overlapping sample, shows a parallel decrease in delinquency scores and aggression from early to late childhood, followed by a sharp increase in delinquency, with aggression continuing to decline, at the advent of adolescence. Delinquency may indeed be related differently to the child-rearing factors studied here.
When it came to identifying family correlates, we identified membership in classes that only differed in the trajectory of inattention/hyperactivity. For both high and low aggression trajectory groups, lower levels of emotional support and intellectual stimulation predicted membership in the high inattention/hyperactivity trajectory groups. Conversely, cohesiveness of the family environment predicted high aggression trajectories, but not higher inattention/hyperactivity trajectory classes. This is one of the first clear demonstrations of specific family environment effects on attention problem and hyperactivity development, independent of aggressive development. As such, it may provide clues for theories of how these problems in particular develop.
The Moos Family Environment scales (which were related to aggression) used here were Cohesion, Organization, and Conflict (reverse coded). These reflect the overall quality of the family’s interactions; high scores are found in highly functional families that display structure and warmth toward all the members of the family and a minimum of conflict and in-fighting. Violent behavior in the home, which is related to aggressive behavior in children, would also be reflected in lower scores on this measure. The HOME (which was related to inattention/hyperactivity) is a measure that is collected specifically with respect to a particular child and was done during the preschool period. Several of the subscales are related to different types of intellectual stimulation, such as stimulation through toys and games, academic behavior, and the variety of stimulation. These types of stimulation may reflect parenting that encourages children’s development of self-regulation in the pre-school years through early learning experiences. This may be one determinant of the child’s ability to be attentive in the school environment. Because this measure does not take into account the overall quality of the family environment, it may be less important for aggressive behavior.
Findings with regard to the Block Child-Rearing Practices Report were not as expected. The scores on Authoritarian parenting, which were expected to be higher in alcoholic families, were not different between alcoholic and nonalcoholic families. Neither Authoritarian nor Authoritative parenting were related to the trajectory classes of aggression or inattention/hyperactivity. These results were all based on responses from the mothers of the children. Perhaps ratings were biased. Alternatively, they may strive to compensate for the alcoholic father by increasing warmth and rational guidance for the child, but these efforts may be overwhelmed by the stress in the family due to the father’s psychopathology.
In a previous analysis from our group, Loukas et al. (2003) found that family conflict predicted the development of aggressive behavior in boys, controlling for the boys’ undercontrol. Although the methodology is somewhat different, their results were similar to ours in that a measure of conflict, cohesion, and organization predicted a worse trajectory of aggressive behavior, when concurrent inattention/hyperactivity were held constant. Loukas et al. (2003) did not use the longitudinal measure of inattention/hyperactivity and did not include the measure of intellectual stimulation and warmth. Loukas also found that paternal alcoholism was a predictor of child aggressive behavior, whereas we found that alcoholism predicted only inattention/hyperactivity, not aggression. They measured of alcoholism throughout the study as a time-varying covariate that would strengthen the relation between child problems and paternal alcoholism, as it more accurately reflected the presence of alcohol problems in the fathers concurrent with the measures of aggressive behavior in the children.
This study utilized a sample with high prevalence of alcoholism in the fathers. Alcoholism in the women was free to vary. Due to assortative mating, the sample also has a substantially higher than population-rate prevalence of women with alcohol use disorders (28.7% in this population, compared to the national norm of 14.6% for this age range; Kessler, McGonagle, Zhao, Nelson, Hughes, Eshleman, Wittchen, & Kendler, 1994). To reduce the possible confounding of teratogenic effects of drinking during pregnancy upon development, children with evidence of fetal alcohol effects were excluded from the sample. Given what was already known about children of alcoholics when the study began, it was anticipated that these children would be at elevated risk for behavioral problems. Indeed, children in the alcoholic families in this study did display higher levels of inattention/hyperactivity and aggressive behaviors than children in the control group. Family alcoholism status also predicted membership in classes with higher levels of inattention/hyperactivity, when aggressive behavior trajectories were held constant. This finding strengthens the existing literature showing a relationship between alcoholism in the parent and higher levels of child ADHD symptomatology (Kuperman et al., 1999).
Family alcoholism was also associated with lower SES and lower quality of the child-rearing environment. Lower SES in alcoholic families has been often noted in previous literature (Fitzgerald & Zucker, 1995). We chose not to control for SES in our analyses because lower SES is also an important consequence of the problem of alcoholism, especially for alcoholism with antisocial behavior (Zucker, Ellis, Fitzgerald, Bingham, & Sanford, 1996). Controlling for a variable that is an important part of the syndrome under investigation is not advised (Miller & Chapman, 2001). Lower SES, in turn, is associated with diminished quality of child-rearing environment (Garrett, Ng’andu, & Ferron, 1994). As the child-rearing environment also predicted inattention/hyperactivity and aggression trajectories, it may be that these variables are mediators of the relationship between family alcoholism and child behaviors.
Several potential sources of error in the analyses were examined. Two potential confounds were children’s medication for ADHD, and the inclusion of siblings in the data set. In each case, the model results confirmed the robustness of our approach. Another possible source of error was that the child-rearing measures were obtained from the parents, the same reporter as for aggressive behavior in the cross-informant model. Shared method variance for these might cause a greater apparent relationship between aggressive behavior and the child-rearing environmental variables. The ability of the model to differentiate the influence of parenting and family environment variables on aggressive behavior suggests that this reporter confound does not dominate the predictions of the model. Further, a model that used cross-informant composites of aggressive behavior and inattention/hyperactivity rated by teachers and parents yielded exactly equivalent results of predicting aggressive behavior with family environment and inattention/hyperactivity with intellectual stimulation. This reinforces our findings and provides evidence that the results are not a function of this shared method variance.
The identification of family factors related to inattention/hyperactivity in children may be due to several differences between our study and prior studies. First, previous studies may not have measured the same elements of the environment that we did. For example, Paternite and Loney (1980) used self- and spouse reports of “parental shortcomings.” Loney, Langhorne, and Paternite’s (1978) measures included only love/hostility and control/autonomy continuums. Second, the current sample was high risk because of the high prevalence of alcoholism in the parents, but it was not selected specifically for inattention/hyperactivity or conduct disorder and was a community, as opposed to clinical, sample. Third, the children were studied over an interval of at least 6 and up to 12 years, as contrasted with many studies that are cross-sectional or consist of only two time points. Information on child behavior was obtained from two independent reporters, the child’s teachers as well as the parents. It was notable that the home environment, which was assessed by interviewing and observing the parent, was related to the development of teacher-reported inattention/hyperactivity.
These findings do not necessarily contradict the substantial literature indicating that inattention/hyperactivity problems are substantially heritable (but not exclusively so, non-genetic effects remain notable in most studies; Sherman, Iacono, & McGue, 1997). Rather, our results usefully supplement this other work. What the data suggest is that mechanisms specific to maintaining and moderating problems with inattention/hyperactivity behaviors over time do occur in the home. This is an important step in a field that is lacking a clear picture of such mechanisms (Johnston & Mash, 2001). It must be recognized that in a family study, genetic and environmental effects are not dissociable. Thus, even the measure of home environment is likely to be mediating genetic effects via parent temperament or personality traits that we did not measure (Nigg & Goldsmith, 1998; O’Connor, Deater Deckard, Fulker, Rutter, & Plomin, 1998). Further, it is possible that, although the home environment was measured before the measurement of the inattention/hyperactivity, these problems may have been present in children starting at a very early age. The ability of the parents to provide intellectual stimulation to the child could therefore have been compromised due to the behavior of the child. This does not change the importance of understanding the mediating mechanisms in the home environment by which such effects may be actualized.
The finding that there are differential influences of characteristics in the environment of the child has implications for the development of the risk of substance disorders in these children. The children most at risk for substance disorders and serious behavioral consequences are those in the most dysfunctional families, for whom both high levels of conflict and low levels of cohesion in the family are present as well as low levels of emotional support and intellectual stimulation from the parents. These families may be ones in which both parents are experiencing difficulties with drugs of abuse themselves, which would further increase the likelihood of the child’s having later substance use disorders.
In contrast, we found little relationship between development of children’s inattention/hyperactivity and the parents’ retrospective reports of their own inattention/hyperactivity problems in childhood. Although there were significant zero-order correlations between inattention/hyperactivity of the child and the mother’s report of her own inattention/hyperactivity in childhood, her inattention/hyperactivity did not predict trajectory class membership in a higher inattention/hyperactivity class. However, there was a relationship between the child’s aggression level and the mother’s report of inattention/hyperactivity in childhood. This stands in some contrast to a sizeable literature indicating associations between ADHD in children and in parents (Frick, Lahey, Christ, Loeber, & Green, 1991). Retrospective reports from parents reporting on their childhood problems of attention and aggression are problematic, because they are reporting on a time period up to several decades prior. In the Frick study (1991b), for the most part the mothers were reporting on behavior problems of the children’s biological fathers in childhood. In the present study, two different models of inattention/hyperactivity were utilized: children were assessed with the Achenbach (single factor) model, while parents were assessed with the DSM-IV (two-factor) model. Furthermore, it is possible that the mothers who reported childhood inattention/hyperactivity problems also experienced elevated aggression problems in childhood and the relationship reflects this comorbidity. Nonetheless, it was notable that parent history of inattention/hyperactivity problems did not account for our findings of home environment effects on child inattention/hyperactivity development.
Both the home environment and parental alcoholism were measured at the first time point of the study (children aged 3–5 years), whereas the developmental trajectories span the age range from 6 to 8 years of age up to 15 to 17 years. Therefore, these early indicators are predicting development over a span of up to 12 years. Early prediction of which children are more likely to experience more inattention/hyperactivity may make it possible to direct intervention to those children most in need.
In summary, by applying recently developed statistical techniques that create groups of children based on developmental trajectories, we were able to find factors in the family and home environment that predicted development of inattention/hyperactivity problems independent of the development of aggression problems. In addition, different home environment factors predicted aggression development, independent of differences in the development of inattention/hyperactivity problems. Disentangling the development of inattention/hyperactivity and aggression problems has allowed us to find distinct predictors of aggression and inattention/hyperactivity trajectories throughout childhood and adolescence.
Acknowledgments
This work was supported by National Institute on Alcohol Abuse and Alcoholism grants (R01 AA12217 to R.A.Z. and J.T.N. and R37 AA07065 to R.A.Z. and H.E.F.). We are indebted to Bengt Muthén for Ms advice on the statistical analyses for this study.
References
- Achenbach TM. Manual for the Child Behavior Checklist/4–18 and 1991 profile. Burlington, VT: University of Vermont Department of Psychiatry; 1991a. [Google Scholar]
- Achenbach TM. Manual for the teacher’s report form and 1991 profile. Burlington, VT: University of Vermont Department of Psychiatry; 1991b. [Google Scholar]
- American Psychiatric Association. Diagnostic and statistical manual of mental disorders. 4. Washington, DC: Author; 2000. text revision. [Google Scholar]
- Barkley RA, Cunningham CE. The effects of methylphenidate on the mother–child interactions of hyperactive children. Archives of General Psychiatry. 1979;36:201–208. doi: 10.1001/archpsyc.1979.01780020091010. [DOI] [PubMed] [Google Scholar]
- Baumrind D. Authoritarian vs. authoritative parental control. Adolescence. 1968;3:255–272. [Google Scholar]
- Biederman J, Milberger S, Faraone SV, Kiely K, Guite J, Mick E, Ablon S, Warburton R, Reed E. Family–environment risk factors for attention–deficit hyperactivity disorder: A test of Rutter’s indicators of adversity. Archives of General Psychiatry. 1995;52:464– 470. doi: 10.1001/archpsyc.1995.03950180050007. [DOI] [PubMed] [Google Scholar]
- Block JH. The child rearing practices report. Berkeley, CA: University of California, Institute of Human Development; 1981. [Google Scholar]
- Bradley RH, Caldwell BM, Rock SL, Hamrick HM, Harris P. Home observation for measurement of the environment: Development of a home inventory for use with families having children 6 to 10 years old. Contemporary Educational Psychology. 1988;13:58–71. [Google Scholar]
- Cadoret RJ, Yates WR, Troughton E, Woodworth G, Stewart MA. Genetic–environmental interaction in the genesis of aggressivity and conduct disorders. Archives of General Psychiatry. 1995;52:916–924. doi: 10.1001/archpsyc.1995.03950230030006. [DOI] [PubMed] [Google Scholar]
- Cairns RB, Cairns BD, Neckerman HJ, Ferguson LL, Gariépy JL. Growth and aggression: I. Childhood to early adolescence. Developmental Psychology. 1989;25:320–330. [Google Scholar]
- Cantwell D. Familial-genetic research with hyperactive children. In: Cantwell D, editor. Hyperactivity, diagnosis, management, and current research. New York: Spectrum; 1975. [Google Scholar]
- Chen WJ, Faraone SV, Biederman J, Tsuang MT. Diagnostic accuracy of the Child Behavior Checklist scales for attention–deficit hyperactivity disorder: A receiver–operating characteristic analysis. Journal of Consulting & Clinical Psychology. 1994;62:1017–1025. doi: 10.1037/0022-006X.62.5.1017. [DOI] [PubMed] [Google Scholar]
- Darling N, Steinberg L. Parenting style as context: An integrative model. Psychological Bulletin. 1993;113:487– 496. [Google Scholar]
- Drotar D, Stein REK, Perrin EC. Methodological issues in using the Child Behavior Checklist and its related instruments in clinical child psychology research. Journal of Clinical Child Psychology. 1995;24:184–192. [Google Scholar]
- Duncan GJ, Brooks–Gunn J, Klebanov PK. Economic deprivation and early childhood development. Child Development. 1994;65:296–318. [PubMed] [Google Scholar]
- Eisenberg N, Cumberland A, Spinrad TL, Fabes RA, Shepard SA, Reiser M, Murphy BC, Losoya SH, Guthrie IK. The relations of regulation and emotionality to children’s externalizing and internalizing problem behavior. Child Development. 2001;72:1112–1134. doi: 10.1111/1467-8624.00337. [DOI] [PubMed] [Google Scholar]
- Feighner JP, Robins E, Guze SB, Woodruff RA, Jr, Winokur G, Munoz R. Diagnostic criteria for use in psychiatric research. Archives of General Psychiatry. 1972;26:57– 63. doi: 10.1001/archpsyc.1972.01750190059011. [DOI] [PubMed] [Google Scholar]
- Fergusson DM, Horwood LJ. Early disruptive behavior, IQ, and later school achievement and delinquent behavior. Journal of Abnormal Child Psychology. 1995;23:183–199. doi: 10.1007/BF01447088. [DOI] [PubMed] [Google Scholar]
- Fitzgerald HE, Zucker RA. Socioeconomic status and alcoholism: The contextual structure of developmental pathways to addiction. In: Fitzgerald HE, Lester BM, Zuckerman B, editors. Children of poverty: Research, health, and policy issues. New York: Garland Publishing; 1995. pp. 125–148. [Google Scholar]
- Frick PJ. Family dysfunction and the disruptive behavior disorders: A review of recent empirical findings. In: Ollendick TH, Prinz RJ, editors. Advances in clinical child psychology. Vol. 16. New York: Plenum Press; 1994. pp. 203–226. [Google Scholar]
- Frick PJ, Kamphaus RW, Lahey BB, Loeber R, Christ MAG, Hart EL, Tannenbaum LE. Academic underachievement and the disruptive behavior disorders. Journal of Consulting & Clinical Psychology. 1991;59:289–294. doi: 10.1037/0022-006X.59.2.289. [DOI] [PubMed] [Google Scholar]
- Frick PJ, Lahey BB, Christ MA, Loeber R, Green S. History of childhood behavior problems in biological relatives of boys with attention–deficit hyperactivity disorder and conduct disorder. Journal of Clinical Child Psychology. 1991;20:445– 451. [Google Scholar]
- Garrett P, Ng’andu N, Ferron J. Poverty experiences of young children and the quality of their home environments. Child Development. 1994;65:331–345. [PubMed] [Google Scholar]
- Ge X, Conger RD, Cadoret RJ, Neiderhiser JM, Yates W, Troughton E, Stewart MA. The developmental interface between nature and nurture: A mutual influence model of child antisocial behavior and parent behaviors. Developmental Psychology. 1996;32:574–589. [Google Scholar]
- Gondoli DM, Jacob T. Factor structure within and across three family-assessment procedures. Journal of Family Psychology. 1993;6:278–289. [Google Scholar]
- Graham JW, Cumsille PE, Elek Fisk E. Methods for handling missing data. In: Schinka JA, Velicer WF, editors. Handbook of psychology: Research methods in psychology. Vol. 2. New York: Wiley; 2003. pp. 87–114. [Google Scholar]
- Greenberg MT, Kusche CA, Speltz M. Emotional regulation, self-control, and psychopathology: The role of relationships in early childhood. In: Cicchetti D, editor. Internalizing and externalizing expressions of dysfunction. Hillsdale, NJ: Erlbaum; 1991. pp. 21–55. [Google Scholar]
- Grych JH, Fincham FD, editors. Interparental conflict and child development: Theory, research, and applications. New York: Cambridge University Press; 2001. [Google Scholar]
- Hinshaw SP. On the distinction between attentional deficits/hyperactivity and conduct problems/aggression in child psychopathology. Psychological Bulletin. 1987;101:443– 463. [PubMed] [Google Scholar]
- Huang–Pollock CL, Carr TH, Nigg JT. Development of selective attention: Perceptual load influences early versus late attentional selection in children and adults. Developmental Psychology. 2002;38:363–375. [PubMed] [Google Scholar]
- Johnston C, Mash EJ. Families of children with Attention–Deficit/Hyperactivity Disorder: Review and recommendations for future research. Clinical Child & Family Psychology Review. 2001;4:183–207. doi: 10.1023/a:1017592030434. [DOI] [PubMed] [Google Scholar]
- Johnston C, Murray C, Hinshaw SP, Pelham WE, Hoza B. Responsiveness in interactions of mothers and sons with ADHD: Relations to maternal and child characteristics. Journal of Abnormal Child Psychology. 2002;30:77–88. doi: 10.1023/a:1014235200174. [DOI] [PubMed] [Google Scholar]
- Kendziora KT, O’Leary SG. Dysfunctional parenting as a focus for prevention and treatment of child behavior problems. 1993;15 [Google Scholar]
- Kessler RC, McGonagle KA, Zhao S, Nelson CB, Hughes M, Eshleman S, Wittchen HU, Kendler KS. Lifetime and 12-month prevalence of DSM-III-R psychiatric disorders in the United States. Results from the National Comorbidity Survey. Archives of General Psychiatry. 1994;51:8–19. doi: 10.1001/archpsyc.1994.03950010008002. [DOI] [PubMed] [Google Scholar]
- Klein RG, Mannuzza S. Long-term outcome of hyperactive children: A review. Journal of the American Academy of Child & Adolescent Psychiatry. 1991;30:383–387. doi: 10.1097/00004583-199105000-00005. [DOI] [PubMed] [Google Scholar]
- Kochanska G, Coy KC, Murray KT. The development of self-regulation in the first four years of life. Child Development. 2001;72:1091–1111. doi: 10.1111/1467-8624.00336. [DOI] [PubMed] [Google Scholar]
- Kochanska G, Kuczynski L, Radke–Yarrow M. Correspondence between mothers’ self-reported and observed child-rearing practices. Child Development. 1989;60:56– 63. doi: 10.1111/j.1467-8624.1989.tb02694.x. [DOI] [PubMed] [Google Scholar]
- Kopp CB. Antecedents of self-regulation: A developmental perspective. Developmental Psychology. 1982;18:199–214. [Google Scholar]
- Kuperman S, Schlosser SS, Lidral J, Reich W. Relationship of child psychopathology to parental alcoholism and antisocial personality disorder. Journal of the American Academy of Child Adolescence & Psychiatry. 1999;38:686– 692. doi: 10.1097/00004583-199906000-00015. [DOI] [PubMed] [Google Scholar]
- Loeber R. The stability of antisocial and delinquent child behavior: A review. Child Development. 1982;53:1431–1446. [PubMed] [Google Scholar]
- Loeber R, Brinthaupt VP, Green SM. Attention deficits, impulsivity, and hyperactivity with or without conduct problems: Relationships to delinquency and unique contextual factors. In: McMahon RJ, Peters RD, editors. Behavior disorders of adolescence: Research, intervention, and policy in clinical and school settings. New York: Plenum Press; 1990. pp. 39–61. [Google Scholar]
- Loney J, Langhorne JE, Paternite CE. An empirical basis for subgrouping the hyperkinetic/minimal brain dysfunction syndrome. Journal of Abnormal Psychology. 1978;87:431– 441. doi: 10.1037//0021-843x.87.4.431. [DOI] [PubMed] [Google Scholar]
- Loney J, Paternite CE, Schwartz JE, Roberts MA. Associations between clinic-referred boys and their fathers on childhood inattention-overactivity and aggression dimensions. Journal of Abnormal Child Psychology. 1997;25:499–509. doi: 10.1023/a:1022689832635. [DOI] [PubMed] [Google Scholar]
- Loukas A, Zucker RA, Fitzgerald HE, Krull JL. Developmental trajectories of disruptive behavior problems among sons of alcoholics: Effects of parent psychopathology, family conflict, and child undercontrol. Journal of Abnormal Psychology. 2003;112:119–131. [PubMed] [Google Scholar]
- Luster T, McAdoo HP. Factors related to the achievement and adjustment of young African American children. Child Development. 1994;65:1080–1094. doi: 10.1111/j.1467-8624.1994.tb00804.x. [DOI] [PubMed] [Google Scholar]
- Mayzer R, Montanez M, Wong MM, Puttler LI, Fitzgerald HE, Zucker RA. Onset of alcohol use: A comparison between early drinkers and non-drinkers in the continuity of aggression and delinquency from preschool to adolescence. Paper presented at the Annual meeting of the American Society of Criminology; Chicago. 2002. [Google Scholar]
- McArdle JJ, Epstein D. Latent growth curves within developmental structural equation models. Child Development. 1987;58:110–133. [PubMed] [Google Scholar]
- Miller GM, Chapman JP. Misunderstanding analysis of covariance. Journal of Abnormal Psychology. 2001;110:40– 48. doi: 10.1037//0021-843x.110.1.40. [DOI] [PubMed] [Google Scholar]
- Moos RH, Moos BS. Family Environment Scale manual. 3. Palo Alto, CA: Consulting Psychologists Press; 1994. [Google Scholar]
- Muthén B. Methodological issues in random coefficient growth modeling using a latent variable framework: Applications to the development of heavy drinking. In: Rose J, Chassin L, Presson C, Sherman J, editors. Multivariate applications in substance use research: New methods for new questions. Hillsdale, NJ: Erlbaum; 2000. pp. 113–140. [Google Scholar]
- Muthén B. Latent variable mixture modeling. In: Marcoulides GA, Schumacker RE, editors. New developments and techniques in structural equation modeling. Mahwah, NJ: Erlbaum; 2001. pp. 1–33. [Google Scholar]
- Muthén B, Satorra A. Complex sample data in structural equation modeling. Sociological Methodology. 1995;25:267–316. [Google Scholar]
- Muthén LK, Muthén BO. Mplus user’s guide. Los Angeles: Muthén & Muthén; 1998. [Google Scholar]
- Nagin D, Tremblay RE. Trajectories of boys’ physical aggression, opposition, and hyperactivity on the path to physically violent and nonviolent juvenile delinquency. Child Development. 1999;70:1181–1196. doi: 10.1111/1467-8624.00086. [DOI] [PubMed] [Google Scholar]
- Nagin DS, Tremblay RE. Analyzing developmental trajectories of distinct but related behaviors: A group-based method. Psychological Methods. 2001;6:18–34. doi: 10.1037/1082-989x.6.1.18. [DOI] [PubMed] [Google Scholar]
- Nesselroade JR. Adult personality development: Issues in assessing constancy and change. In: Zucker RA, editor. Personality structure in the life course: Essays on personology in the Murray tradition. New York: Springer; 1992. p. xiv.p. 382. [Google Scholar]
- Nigg JT. On inhibition/disinhibition in developmental psychopathology: Views from cognitive and personality psychology and a working inhibition taxonomy. Psychological Bulletin. 2000;126:220–246. doi: 10.1037/0033-2909.126.2.220. [DOI] [PubMed] [Google Scholar]
- Nigg JT. Is ADHD a disinhibitory disorder? Psychological Bulletin. 2001;127:571–598. doi: 10.1037/0033-2909.127.5.571. [DOI] [PubMed] [Google Scholar]
- Nigg JT, Goldsmith HH. Developmental psychopathology, personality, and temperament: Reflections on recent behavioral genetics research. Human Biology. 1998;70:387– 412. [PubMed] [Google Scholar]
- Nigg JT, Hinshaw SP. Parent personality traits and psychopathology associated with antisocial behaviors in childhood attention–deficit hyperactivity disorder. Journal of Child Psychology & Psychiatry & Allied Disciplines. 1998;39:145–159. [PubMed] [Google Scholar]
- O’Connor TG, Deater Deckard K, Fulker D, Rutter M, Plomin R. Genotype–environment correlations in late childhood and early adolescence: Antisocial behavioral problems and coercive parenting. Developmental Psychology. 1998;34:970–981. doi: 10.1037//0012-1649.34.5.970. [DOI] [PubMed] [Google Scholar]
- Paternite CE, Loney J. Hyperactive Children: The Social Ecology of Identification and Treatment. New York: Academic Press; 1980. Childhood hyperkinesis: Relationships between symptomatology and home environment. [Google Scholar]
- Patterson GR. Coercive family process. Eugene, OR: Castalia; 1982. [Google Scholar]
- Reich W, Earls F, Powell J. A comparison of the home and social environments of children of alcoholic and nonalcoholic parents. British Journal of Addiction. 1988;83:831–839. doi: 10.1111/j.1360-0443.1988.tb00518.x. [DOI] [PubMed] [Google Scholar]
- Robins LN, Helzer JE, Croughan JL, Ratcliff KS. The NIMH Diagnostic Interview Schedule: Its history, characteristics and validity. St. Louis, MO: Washington University School of Medicine; 1980. [Google Scholar]
- Robison LM, Sclar DA, Skaer TL, Galin RS. National trends in the prevalence of attention–deficit/hyperactivity disorder and the prescribing of methylphenidate among school-age children: 1990–1995. Clinical Pediatrics. 1999;38:209–217. doi: 10.1177/000992289903800402. [DOI] [PubMed] [Google Scholar]
- Sanford K, Bingham CR, Zucker RA. Validity issues with the Family Environment Scale: Psychometric resolution and research application with alcoholic families. Psychological Assessment. 1999;11:315–325. [Google Scholar]
- Scarr S, McCartney K. How people make their own environments: A theory of genotype → environment effects. Child Development. 1983;54:424– 435. doi: 10.1111/j.1467-8624.1983.tb03884.x. [DOI] [PubMed] [Google Scholar]
- Schafer JL, Graham JW. Missing data: Our view of the state of the art. Psychological Methods. 2002;7:147–177. [PubMed] [Google Scholar]
- Searight HR, McLaren AL. Attention–deficit hyperactivity disorder: The medicalization of misbehavior. Journal of Clinical Psychology in Medical Settings. 1998;5:467– 495. [Google Scholar]
- Sherman DK, Iacono WG, McGue MK. Attention–deficit hyperactivity disorder dimensions: A twin study of inattention and impulsivity–hyperactivity. Journal of the American Academy of Child & Adolescent Psychiatry. 1997;36:745–753. doi: 10.1097/00004583-199706000-00010. [DOI] [PubMed] [Google Scholar]
- Stanger C, Achenbach TM, Verhulst FC. Accelerated longitudinal comparisons of aggressive versus delinquent syndromes. Development and Psychopathology. 1997;9:43–58. doi: 10.1017/s0954579497001053. [DOI] [PubMed] [Google Scholar]
- Stevens G, Featherman DL. A revised socioeconomic index of occupational status. Social Science Research. 1981;10:364–395. [Google Scholar]
- Stevens J, Quittner AL, Abikoff H. Factors influencing elementary school teachers’ ratings of ADHD and ODD behaviors. Journal of Clinical Child Psychology. 1998;27:406– 414. doi: 10.1207/s15374424jccp2704_4. [DOI] [PubMed] [Google Scholar]
- Tarter RE, McBride H, Buonpane N, Schneider DU. Differentiation of alcoholics: Child-hood history of minimal brain dysfunction, family history, and drinking pattern. Archives of General Psychiatry. 1977;34:761–768. doi: 10.1001/archpsyc.1977.01770190023002. [DOI] [PubMed] [Google Scholar]
- Whalen CK, Henker B. Handbook of disruptive behavior disorders. New York: Kluwer Academic; Plenum Press; 1999. The child with attention–deficit/hyperactivity disorder in family contexts; pp. 139–155. [Google Scholar]
- Winsler A. Parent–child interaction and private speech in boys with ADHD. Applied Developmental Science. 1998;2:17–39. [Google Scholar]
- Zucker RA, Ellis DA, Fitzgerald HE, Bingham CR, Sanford K. Other evidence for at least two alcoholisms II: Life course variation in antisociality and heterogeneity of alcoholic outcome. Development and Psychopathology. 1996;8:831–848. [Google Scholar]
- Zucker RA, Fitzgerald HE, Noll RB. Drinking and drug history. 4. Michigan State University; 1990. Unpublished manuscript. [Google Scholar]
- Zucker RA, Fitzgerald HE, Refior SK, Puttler LI, Pallas DM, Ellis DA. The clinical and social ecology of childhood for children of alcoholics: Description of a study and implications for a differentiated social policy. In: Fitzgerald HE, Lester BM, Zuckerman BS, editors. Children of addiction: Research, health and policy issues. New York: Garland Press; 2000. pp. 174–222. [Google Scholar]
- Zucker RA, Gomberg ES. Etiology of alcoholism reconsidered: The case for a biopsychosocial process. American Psychologist. 1986;41:783–793. doi: 10.1037//0003-066x.41.7.783. [DOI] [PubMed] [Google Scholar]