Abstract
Hepatocellular carcinoma (HCC) is an aggressive and often fatal neoplasm. HepG2 cells are a cell line derived from HCC. This investigation shows that vasoactive intestinal peptide (VIP) inhibits HepG2 cell proliferation in vitro. In addition, VIP decreases the expression of signal transducers and activators of transcription-3 (STAT-3) and phosphorylated STAT-3 (pSTAT-3). Transfection of HepG2 cells with STAT-3 siRNA also dose-dependently inhibits proliferation. These findings suggest that VIP-mediated inhibition of HepG2 proliferation may be mediated by STAT-3. Further studies demonstrate that VIP increases HepG2 cAMP levels and 8-cl-cAMP inhibits HepG2 proliferation as well as pSTAT-3 and STAT-3 levels, suggesting that cAMP is also involved in the inhibition of HepG2 proliferation. VIP also attenuates the proliferative effects of hepatocyte growth factor (HGF) and interleukin-6 (IL-6) on HepG2 cells. These preliminary studies suggest that the antiproliferative actions of VIP may offer a new and promising means of suppressing HCC.
Keywords: hepatocellular carcinoma, hepatocyte proliferation, VIP, IL-6, HGF
Introduction
Hepatocellular carcinoma (HCC) is an aggressive and commonly fatal malignancy; its incidence has been increasing in the latter part of the twentieth century. At this time, there is only a rudimentary understanding of the molecular and cellular mechanisms that control this disease process, with limited therapeutic options aside from surgical resection [1-4].
Signal transducers and activators of transcription (STATs) signaling pathways may play an important role in the malignant transformation of many human tissues. STATs are a family of transcription factors that are often activated in response to cytokines, chemokines, and growth factors. Constitutive activation of STAT-3 has been observed in tumor cell lines, as well as in some human cancers [5-14]. In many models, constitutive activation of STAT-3 results in gene transcription in the antiapoptotic/cell cycle progression pathways, a mechanism that is likely involved in oncogenic transformation [15]. Further, pharmacological agents that selectively reduce pSTAT-3 levels induce cellular apoptosis and growth inhibition [16]. Other studies have shown that STAT-3 can be activated by over-expression cytokines or growth factors; this is common in many cancers and may be one mechanism of malignant transformation and/or tumor progression.
VIP is widely distributed throughout the body and most commonly functions as a nonadrenergic, noncholinergic neurotransmitter or as a neuromodulator. Other studies have shown that VIP can inhibit proliferation of tumor cells, including human small cell lung carcinoma, Molt-4 lymphoblasts, adrenocortical carcinoma, neuroblastoma, glioblastoma, and neuroectodermal tumors [17, 18]. This has been shown to occur via a cAMP-dependent mechanism. Many human cancers over-express VIP receptors, VPAC-1 and VPAC-2; these receptors have been identified in cancers of the breast, prostate, pancreas, lung, colon, stomach, liver, and urinary bladder [17, 18]. Most importantly, 47% of hepatocellular carcinomas (HCC) expressed VIP receptors (12).
VIP can also inhibit the production of pro-inflammatory cytokines and chemokines, including tumor necrosis factor-alpha (TNF), interleukin-12, interleukin-6 (IL-6), macrophage inflammatory protein-1, macrophage inflammatory protein-2, interleukin-8 and inducible nitric oxide synthase [19-21]. Sundelin and associates have shown that IL-6, interferon-gamma (IFN-gamma), TNF, and hepatocyte growth factor (HGF) are important in the development of oral squamous cell carcinoma. These mediators affect cellular motility and invasiveness [22-24]. When oral squamous cell carcinoma cells were treated with IL-6, TNF, INF-gamma, and HGF, a dose-dependent, synergistic stimulatory effect was observed [25, 26]. Other investigations have clearly outlined the role of HGF and IL-6 in both normal hepatocyte proliferation as well as in hepatic malignancies [27]. HGF can be a potent stimulator of angiogenesis and cancer metastasis [28].
Carcinogenesis is a balance between proliferation and apoptosis and is likely regulated by multiple mediators and pathways. Since proliferation and apoptosis become deranged in carcinogenesis, the inhibitory effects of VIP on the growth and progression of a carcinoma may be related to the effects of these mediators on other cytokines and growth factors or on signal transduction pathways.
MATERIALS AND METHODS
1. Cell Culture
HepG2 cells, which belong to the classic subclass of HCC, were obtained from American Type Culture Collection (ATCC, Manassas, VA). Cells were maintained in DMEM medium with 10% FCS, sodium pyruvate, 100 units/ml penicillin, and 100 μg/ml streptomycin. Cells were incubated in tissue-culture flasks in a humidified atmosphere of 5% CO2 and grown as adherent cell aggregates. All chemicals needed for cell culture were purchased from Gibco. (Carlsbad, CA)
2. MTT Cellular Proliferation Assay
HepG2 cells in the logarithmic growth phase were plated into 24-well plates in 1.0 ml of DMEM medium without phenol red. STAT siRNA (20, 40 and 80 pmol), VIP (10−8, 10−7 and 10−6M), HGF (50 ng/ml), IL-6 (50ng/ml), and 8-chloro-cAMP (50, 100, and 200 uM) were added as described below. Cellular proliferation was measured using the Vybrant MTT Cell Proliferation Assay Kit (Molecular probe, Eugene, OR Catalog # V-13154) as per the manufacturer's instructions. All reagents used, except STAT-3 siRNA, were stored in DMSO at −20°C to minimize proteolytic degradation.
3. Western Blot Analysis
Western blot analysis was used to measure the effects of VIP (1 uM), IL-6 (50 ng/ml), HGF (50 ng/ml) and STAT-3 siRNA (40 pmol) on pSTAT-3 and STAT-3 protein expression in HepG2 cells. Cells were plated in 24-well plates (50,000 cell/1cc), at 37°C in a 5% CO2 atmosphere with 1 ml of conditioned media containing the test substance for 3, 6, 12, 24, 48 and 72 hours. After incubation, cell lysates were obtained and separated on 10% SDS-PAGE and transferred to 0.2 μm PVDF membranes for 5 hours at 4°C (Schleicher & Schuell, Dassel, Germany). Blots were blocked with 5% bovine serum albumin in TBS for 2 hours at room temperature, followed by incubation with primary antibody against pSTAT-3,and STAT-3 (R&D, Minneapolis, MN), for 24 hours at 4°C at optimum dilution. After washing 3 times for 20 minutes each, the membranes were incubated with HRP-conjugated secondary antibody (anti-IgG) at optimum dilution for 45 minutes at room temperature. The membranes were washed 5 times with TBS-T buffer. Immunodetected bands were visualized with the ECL-system (Amersham, Sunnyvale, CA). GAPDH was used as internal control: membranes were stripped, blocked and reincubated with monocolonal antibody against GAPDH (Santa Cruz, CA) for 24 hours at 4°C followed by washing, incubating with HRP conjugated antibody (anti-IgG) and immunodetected bands were visualized as mentioned above.
4. Immunofluorescent Identification of VIP and VPAC-1 Receptors in HepG2 Cells
Immunofluorescent identification of VIP and VPAC-1 was done according to the manufacturer's instructions. HepG2 cells were plated in sterile 2-well chamber plates (50,000 cell/1cc) and grown for 48 hours in culture with DMEM medium plus 10% FCS. Cells were fixed with cold methanol (−10°C) for 5 minutes followed by three washes. Cells were incubated with primary antibodies against VIP and VPAC-1 (Santa Cruz, Santa Cruz, CA) at a concentration of 4 ug/ml in 3.0% normal bovine serum for 24 hours at 4°C. Cells were then washed three times with 3.0% normal bovine serum in PBS for 5 minutes each, followed by a 45 minute incubation with fluorochrome-conjugated secondary antibody (bovine anti-goat IgG-FITC, Santa Cruz, CA) diluted to 3 ug/ml in PBS with 3.0% normal bovine serum. Cells were again washed three times with PBS plus 3.0% normal bovine serum. Negative controls were performed as described above in the presence of blocking peptide for competitive studies (Santa Cruz, CA) at a concentration of 10 ug/ml blocking serum, 3.0% normal bovine serum in PBS.
5. Transfecting STAT-3 siRNA Stealth into HepG2 Cells Using Lipofectamine 2000
Invitrogen BLOCK-iT Transfection Optimization Kit (Invitrogen, SanDiego, CA) was used to help optimize siRNA transfection using controls for transfection and viability. The kit includes BLOCK-iT Fluorescent Oligo from Invitrogen used to validate the transfection of HepG2 cells, a Stealth RNA molecule targeting the human p53 gene for use as a positive control and a Scrambled Stealth RNA molecule for use as a negative control. Cells were plated in 24-well plates. One day before transfection, 1ml of growth medium (DMEM) without antibiotics was added. Cells were plated at a density that resulted in 30−50% confluence at the time of transfection. Cells were transfected with STAT-3 siRNA validated Stealth from Invitrogen using Lipofectamine 2000 (Invitrogen, SanDiego, CA), as per the manufacturer's instructions. The Stealth STAT-3 siRNA oligomer was diluted (40 pmole) in 100 ul of Opti-MEM I Reduced Serum Medium without serum. Lipofectamine 2000 was diluted 1 ul in 50 ul in the same medium. After mixing gently for 5 minutes at room temperature, the diluted oligomer with the diluted Lipofectamine 2000 were combined and incubated for 20 minutes at room temperature to allow complex formation to occur. Oligomer-Lipofectamine 2000 complexes were added to the cells. After gentle mixing by rocking, cells were incubated at 37°C under 5% CO2 for 72 hours and were then assayed for STAT-3 protein levels and cellular proliferation.
| Duplex | Position | Sequence of STAT-3 siRNA Validated Stealth | % GC |
|---|---|---|---|
| 1 | 453 | 5′-CCUGCAAGAGUCGAAUGUUCUCUAU-3′ | 44 |
| 2 | 501 | 5′-GCAGUUUCUUCAGAGCAGGUAUCUU-3′ | 44 |
6. RT-PCR
HepG2 cells were plated on sterile 24-well culture plates (50,000 cell/1cc) and incubated for 72 hours. VIP was added at increasing concentrations from 0.1 nM to 1 uM. Cells were incubated for 3 hours, followed by mRNA extraction using Fast Tract 2.0 kits (Invitrogen, SanDiego, CA). The mRNA was then dissolved in 5 μl diethylpyrocarbonate-treated ddH2O. Next, the mRNA was reverse transcribed (RT) to DNA using a GeneAmp mRNA PCR kit (Perkin-Elmer, Bostn, MA); 1.0 μl sample plus 1.0 μl H2O, 0.5 μl 10× buffer, 0.5 μL MgCl2, and 30U RNase inhibitor (Perkin Elmer) were combined. One μl containing 10 U DNase (Boehringer Mannheim, Germany) was incubated in a thermocycler for 60 minutes at 37°C, then 5 minutes at 90°C followed by immediate cooling. The cDNA product was amplified in a 20μl reaction volume under the following conditions: 1 μl/100 U MMULV reverse transcriptase, 200 uM dNTP (Boehringer Mannheim) and 1 μl Random Hexamers; this mixture was then incubated in a thermocycler at 25°C for 10 minutes, then 42°C for 45 minutes followed by quick chill at 4°C. Next, DNA amplification was performed in a 100 μl reaction mixture containing 20 μl synthesized cDNA product and 10 μl of PCR buffer. Analysis of the transcripts was performed by real-time PCR using the 7000 Sequence Detection System (Applied Biosystems, Foster City, CA) with comparative CT method (User Bulletin #2, Applied Biosystems). The housekeeping gene GAPDH was used as an endogenous reference and obtained as a TaqMan pre-developed commercial kit (Applied Biosystems).
7. Primers and probes
STAT-3 and GAPDH primers and probes were designed with Primer Express Software (Applied Biosystems). Oligonucleotides were synthesized by OPERON TECHNOLOGIES, INC., CA. The thermal cycling conditions were programmed according to the manufacturer's instructions. Data was expressed as arbitrary units (AU) as previously described [29] . The oligonucleotide primers corresponding to the probes, sense and antisense strands, respectively, are listed in the table below for human STAT-3 and GAPDH.
| Agonist |
Probe (5′-3′) |
Sense Primer (5′-3′) |
Antisense Primer (5′-3′) |
|---|---|---|---|
| Human | CTGTGTGACACCATT | CCCCATACCTGAAGACCAA | CTTCACCATTATTTCCA |
| STAT-3 |
A |
GTTTA |
AAT |
| Human | TGCGACGAAACCAA | CATGTTTGTGATGGGCGT | GTGGCAGTGATGGCAT |
| GAPDH | GAACTGCC | GAAC | GGAC |
8. Intracellular cAMP Levels
HepG2 cells were incubated in 24 well plates in 1.0 ml/well of DMEM, pH 7.4, containing 2.5% FCS and three different concentrations of VIP (10−8, 10−7 and 10−6 M). After incubation for 15 minutes at 37°C, 1.0 ml of methanol was added to stop the reaction and extract cAMP. Cell samples were then sonicated and centrifuged for 15 minutes at 1,2000 × g. The pellet was washed with 1.0 ml of methanol, and the washings were added to the supernatant of each sample. The combined solution was evaporated to dryness, and the residue was dissolved in 0.2 ml of cAMP assay buffer. After centrifugation, supernatants were assayed for cAMP in duplicate by radioimmunoassay, with the use of a cAMP RIA kit from Perkin Elmer.
9. Statistical Analysis
Data is expressed as mean ± Standard Error of the Mean (SEM). Statistical differences were examined by One-Way Analysis of Variance (ANOVA) Tukey-Kramer Multiple Comparisons Test. N = number of experiments performed per group.
Results
1. VPAC-1 and VIP Immunoreactivities in HepG2 cells
These experiments document the presence of VIP and VPAC-1 receptors in HepG2 cells; their immunoreactivities were identified in HepG2 cells by immunofluorescent staining techniques. Figure 1A shows that VPAC-1 receptors are distributed throughout the cytoplasm and the nucleus. Figure 1B illustrates a similar distribution for VIP.
Figures 1A & 1B.

Immunofluorescent staining for VPAC-1 receptors (Figure 1A) and VIP (Figure 1B) in HepG2 cells. Figure 1C: Negative control, illustrating the specificity of the VPAC-1 and VIP antibodies. VIP and VPAC-1 immunoreactivities were specifically blocked with 10 ug/ml blocking peptides. Figure 1C is reflecting the specificity of VPAC-1 antibody (Blocking of VIP was similar to that of VPAC-1; data is not shown).
2. Selective, dose-dependent inhibition of HepG2 cell proliferation by VIP
In a concentration-response experiment limited to 3 days, VIP dose-dependently (10−8, 10−7 and 10−6M) inhibited the basal increase of HepG2 cell proliferation, by 26%, 56% and 71% (Figure 2).
Figure 2.
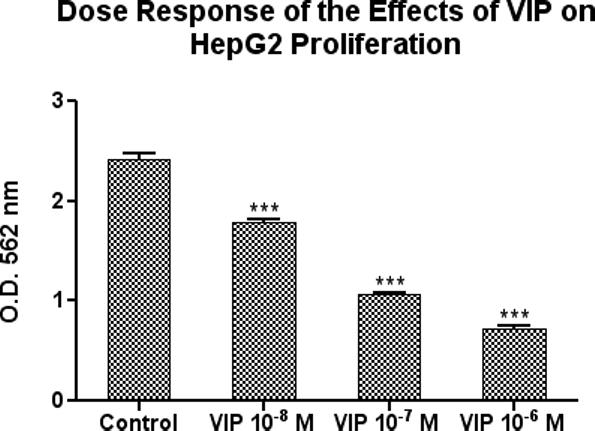
VIP dose-dependently inhibited HepG2 cell proliferation in vitro. The cells were cultured for 3 days in the presence or absence of VIP at concentrations of 10−8, 10−7 and 10−6 M. Data is expressed as the mean ± SEM, N = 3 and ***ρ< 0.001 for all measurements versus untreated cells.
3. VIP Attenuates the Proliferative Effects of HGF and IL-6 on HepG2 cells
Recent reports have suggested that HGF and IL-6 are important for stimulating cancer cell proliferation [25]. In order to determine whether VIP can inhibit the proliferative effects of HGF and IL-6, HepG2 cells were treated with HGF (50 ng/ml) or IL-6 (50 ng/ml), with and without VIP 10−6 M. HGF and IL-6 induced HepG2 cell proliferation (143% and 132% respectively), as compared to controls (untreated cells). When co-incubated with VIP 1uM for 72 hours, the proliferative effects of HGF and IL-6 were significantly reduced. VIP reduced HGF and IL-6-induced proliferation by 57% and 54%, respectively (Figure 3).
Figure 3.
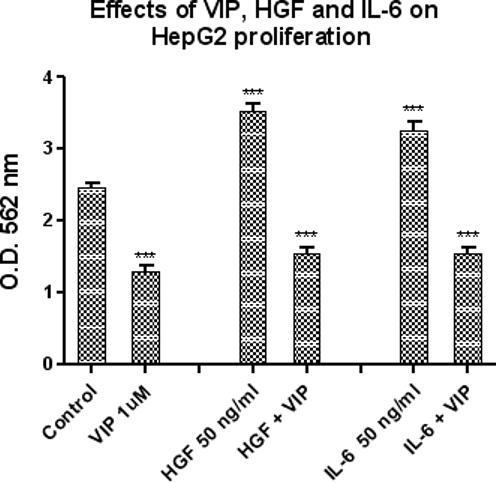
This figure illustrates the effects of VIP (10−6 M), HGF (50ng/ml) and IL-6 (50 ng/ml) on HepG2 cellular proliferation at 72 hours, as measured by MTT assay. IL-6 (50 ng/ml) alone and HGF (50 ng/ml) alone significantly increased HepG2 proliferation by 132% and 143% respectively, as compared to untreated controls (***ρ< 0.001). In contrast, VIP (10−6 M) alone significantly reduced HepG2 proliferation by 47%, again compared to untreated controls (***ρ< 0.001); when VIP was co-administered with Il-6 or HGF, VIP also inhibited the proliferative effects of these cytokines (HGF (50 ng/ml) by 57%, ***ρ< 0.001 and IL-6 (50 ng/ml) by 54%., ***ρ< 0.001). Data is expressed as the mean ± SEM, N = 5.
4. Selective, Dose-dependent Inhibition of Cell Proliferation by STAT-3 siRNA
In concentration-response experiments limited to 3 days, STAT-3 siRNA dose-dependently inhibited the basal increase of HepG2 cell proliferation by 43%, 65% and 84% at 72 hours, over a concentration range of 20, 40 and 80 pmol (Figure 4). Equimolar concentrations of lipofectamine and negative control oligonucleotide had no significant effects on cell proliferation.
Figure 4.
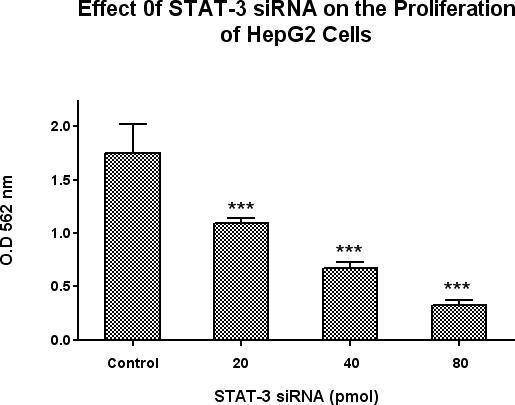
Effects of STAT-3 siRNA on HepG2 cell proliferation. A scrambled RNA molecule was used as a negative control. Cellular proliferation was measured at 72 hours by using the Vybrant MTT Cell Proliferation Assay Kit. Data is expressed as the mean ± SEM, N = 5 and ***ρ< 0.001 for all concentrations of STAT-3 siRNA versus cells transfected with scrambled RNA negative control using lipofectamin 2000. STAT-3 siRNA significantly decreased HepG2 proliferation at all doses.
5. Down Regulation of pSTAT-3 and STAT-3 Protein Levels by STAT-3 siRNA and VIP
To study the effects of STAT-3 siRNA and VIP on pSTAT-3 and STAT-3 protein levels in HepG2 cells, Western Blot analysis was used to measure pSTAT-3 and STAT-3 protein levels. Cells were treated with VIP (10−6 M), IL-6 (50 ng/ml) or HGF (50 ng/ml) and pSTAT-3 levels were measured after 6 hours of incubation. As illustrated in Figure 5A, VIP significantly reduced pSTAT-3 levels by 54%. In contrast, HGF and IL-6 significantly increased pSTAT-3 levels,197% and 203%, respectively. As shown in Figure 5B, STAT-3 levels were measured at 72 hours and a significant reduction in STAT-3 levels were observed after treatment with STAT-3 siRNA validated stealth (40 pmol/ml) and VIP (10−6 M), by 65% and 49%, respectively, where HGF and IL-6 increased STAT-3 levels by 183% and 167%, respectively, as compared to control cells.
Figures 5A and 5B.
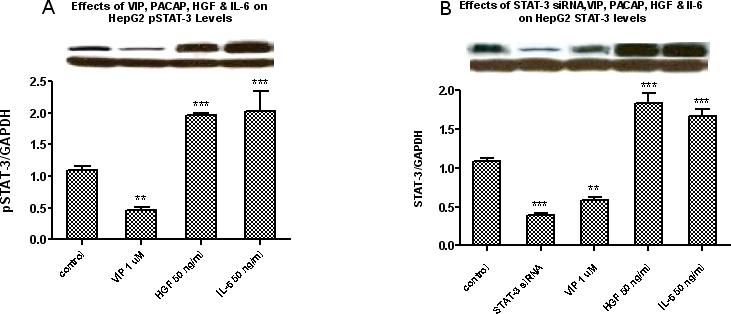
Western blot analysis for pSTAT-3 protein levels at 6 hours (Figure 5A) and STAT-3 levels at 72 hours (Figure 5B) shows that VIP at 10−6M decreased HepG2 pSTAT-3 and STAT-3 protein expressions; in contrast, HGF (50 ng/ml) and IL-6 (50 ng/ml) increased the protein expression of both pSTAT-3 and STAT-3. In addition, transfecting the cells with STAT-3 siRNA for 72 hours also significantly inhibited STAT-3 levels. Bars represent the quantitative analysis of the relative band intensities of STAT-3 and pSTAT-3 versus GAPDH. Figure 5A: Data is expressed as the mean ± SEM; for pSTAT-3 at 6 hours, N = 3 and ***ρ< 0.001 for HGF and IL-6, and **ρ< 0.01 for VIP versus untreated cells. Similarly, as shown in Figure 5B, VIP at 10−6M and STAT-3 siRNA at 40 pmol/ml significantly reduced HepG2 STAT-3 protein levels while HGF and IL-6 at 50 ng/ml increased them. Data is expressed as the mean ± SEM, N = 4 and ***ρ< 0.001 for STAT-3 siRNA, HGF and IL-6 and **ρ< 0.01 for VIP versus untreated cells.
6. VIP Inhibits STAT-3 Gene Expression in HepG2
In dose-response experiments, HepG2 cells were treated with increasing doses of VIP (10−10, 10−8, and 10−6 M) and cells were harvested at 3 hours. STAT-3 and GAPDH gene expression were measured by Real-time PCR. Results were expressed as the ratio of optical density for STAT-3 to that of GAPDH. A representative of each experiment is shown. Bars are mean arbitrary units (AU) ± SEM, N = 4, **p<0.01 for VIP at 10−6M, versus controls. As illustrated in Figure 6, VIP decreases STAT-3 gene expression in HepG2 cells. This was significant at the highest dose of 10−6 M. These experiments suggest that VIP may be functioning via a STAT-3-dependent mechanism.
Figure 6.
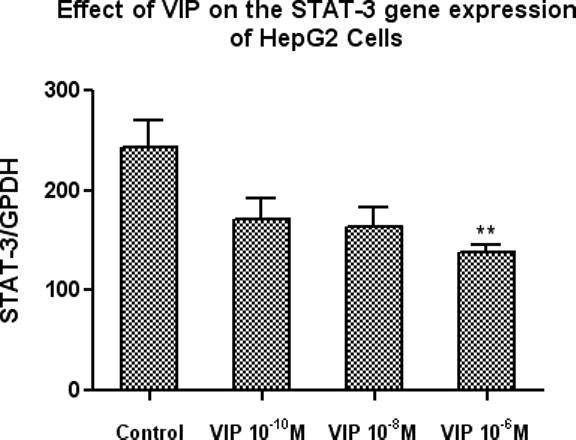
VIP inhibits STAT-3 gene expression. Three doses of VIP, 10−10, 10−8, and 10−6 M, were added and cells were harvested at 3 hours. Gene expression for STAT-3 and GAPDH were determined by Real-time PCR. Results were expressed as the ratio of optical density for STAT-3 to that of GAPDH. A representative of each experiment is shown. Bars are mean arbitrary units (AU) ± SEM, N = 4 and **p<0.01 for VIP 10−6M.
7A. 8-Cl-cAMP Inhibits HepG2 Proliferation
The next experiments were designed to clarify the relationship between the cAMP levels and the inhibition of cell proliferation. HepG2 cells were incubated with 8-Cl-cAMP for 72 hours at 37°C at doses of 50, 100 and 200 uM. 8-Cl-cAMP dose-dependently inhibited the basal increase of HepG2 cell proliferation by 64%, 81% and 90% respectively (Figure 7A). This suggests that the inhibitory effects of VIP may be partially mediated via cAMP dependent mechanisms.
Figure 7A.
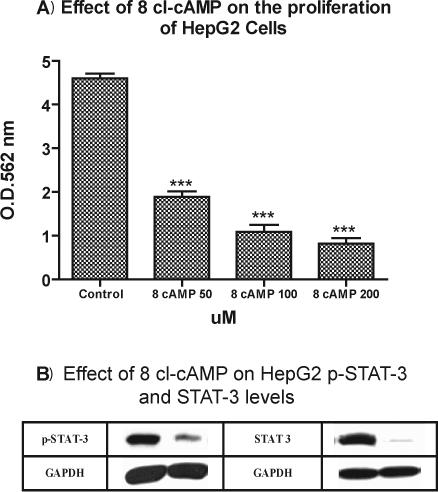
Effects of 8-chloro-cAMP on HepG2 cells proliferation. 8-chloro-cAMP dose-dependently attenuated the proliferation of HepG2 cells. HepG2 cells were 30−50% confluent at the time of treatment. Cells were treated with 8-chloro-cAMP at doses of 50, 100 and 200 uM. Cellular proliferation was measured at 72 hours by using the Vybrant MTT Cell Proliferation Assay Kit. Data is expressed as the mean ± SEM, N = 4 and ***ρ< 0.001 for all concentrations of 8-chloro-cAMP versus untreated cells.
Figures 7B: Western blot analysis shows that 8-Cl-cAMP 200 uM decreased pSTAT-3 protein expressions of HepG2 by 73% at 1 hour as compared to untreated cells and STAT-3 by 89% at 72 hours as compared to untreated cells. Western blot analysis were performed as described earlier. Briefly, HepG2 cells were cultured in 24 well plates at density of 5 × 10⁵ cells/well for 2 days, treated with 8-Cl-cAMP 200 uM and were collected at the indicated time points in each experiment. Cell lysates were immunoblotted to detect (pSTAT-3), STAT-3, and GAPDH.
7 B. 8-Cl-cAMP Inhibits pSTAT-3 and STAT-3
To study the effects of 8-Cl-cAMP on pSTAT-3 and STAT-3 protein levels of HepG2 cells, Western Blot analysis was used to measure pSTAT-3 and STAT-3 protein levels. Cells were treated with 8-Cl-cAMP 200 uM; pSTAT-3 levels were measured after 1 hours of incubation. As illustrated in Figure 7 B, 8-cl-cAMP significantly reduced pSTAT-3 levels by 73% as compared with control cells (untreated). As shown in Figure 7 B, STAT-3 levels were measured at 72 hours and a significant reduction in STAT-3 levels were observed after treatment with 8-Cl-cAMP 200 uM by 89%, as compared to control cells.
8. VIP Dose Dependently Increases cAMP levels in HepG2 cells
In experiments designed to clarify the relationship between the inhibition of HepG2 cell proliferation and intracellular cAMP levels, HepG2 cells were 80% confluent at the time of treatment, and were incubated with various concentrations of VIP (10−8, 10−7 and 10−6 M) for 10 minutes at 37°C. These experiments demonstrate that VIP dose-dependently increased intracellular cAMP levels in HepG2 cells by 24.7%, 57.57% and 112.86%, respectively (Figure 8). This, coupled with the fact that 8-Cl-cAMP also inhibits HepG2 proliferation, suggests that VIP-induced inhibition of HepG2 proliferation may be at least partially mediated by cAMP.
Figure 8.
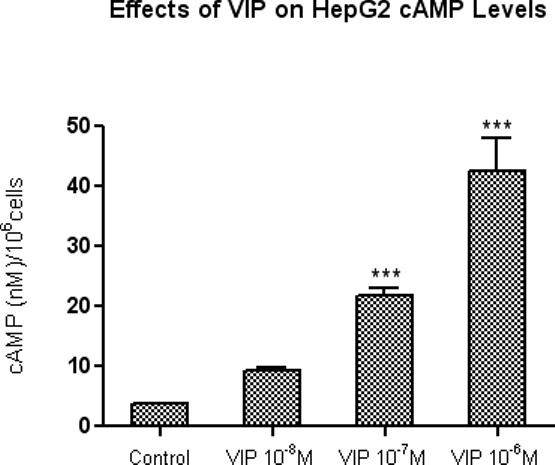
Dose-related stimulation of intracellular cAMP production in HepG2 cells by VIP. HepG2 cells were 80% confluent at the time of treatment. Cells were treated with VIP (10−8, 10−7 and 10−6 M) for 10 minutes at 37°C. Intracellular cAMP was measured at by using cAMP RIA kit from Perkin Elmer. Data is expressed as the mean ± SEM, N = 3; ***ρ< 0.001 for VIP (10−7M and 10−6M) versus untreated cells.
Discussion
Although there have been advances in surgical and standard chemotherapeutic treatments for HCC, overall survival has not changed significantly in recent years. While progress has been made in identifying the oncogenes and tumor suppressor genes involved in many types of cancer, including HCC, the molecular mechanisms controlling the development and progression of malignancies are still poorly understood. While in vitro studies in tumor cell lines do not exactly mimic the more complex and redundant in vivo situation of malignant transformation and tumor progression, they do provide a more controlled system for initial studies involving tumor growth and progression. The experiments described in this study provide the initial data which will guide more detailed studies of in vivo hepatic malignancies.
The initial experiments outlined in this study show that VIP has dose-dependent antiproliferative effects in HepG2 cells, a human hepatoma cell line. This peptide binds to VPAC-1 and VPAC-2 which are seven-transmembrane spanning G protein-coupled receptors [30]. VIP immunoreactivities and VPAC-1 were shown to be present in HepG2 cells via immunofluorescent staining. Many of the effects of VIP are mediated through VPAC-1and VPAC-2 receptors [31].
Constitutive activation of STAT-3 results in the ligand-independent transcription of genes in antiapoptotic cell cycle progression pathways, a mechanism that is likely involved in oncogenic transformation [32]. Other investigators have shown the involvement of STAT-3 signaling pathways in malignant transformation and tumor progression [28]. While our current studies do not specifically look at constitutive activation of STAT-3 in HepG2 cells, the STAT-3 signal transduction pathway clearly appears to be important in this system.
Our first set of experiments demonstrated that VIP inhibited HepG2 cell proliferation. Additional studies also showed that treatment of HepG2 cells with VIP decreased both mRNA and protein levels of STAT-3 and pSTAT-3. Further experiments also illustrated that STAT-3 siRNA dose-dependently inhibited HepG2 cell proliferation. These experiments taken together suggest that the antiproliferative effects of VIP may be mediated through a STAT-3 signal transduction pathway.
Previous investigations have clearly outlined the role of HGF and IL-6 in both normal hepatocyte proliferation, as well as in hepatic malignancies [15, 27]. In general, HGF is a potent stimulator of angiogenesis and cancer metastasis [28] and IL-6 is a pleiotropic cytokine that can act as an autocrine or paracrine growth factor in various tumor cells [23]. In studies by Coskun and associates, patients with primary and metastatic liver tumors had higher serum HGF and IL-6 levels than other patients and controls. In addition, these studies demonstrated that serum HGF and IL-6 levels can distinguish patients with primary or metastatic liver tumors from those with benign liver lesions [15]. Others investigators have also found a significant increase in the serum levels of IL-6, HGF, and type IV collagen 7S during the perioperative period following a hepatectomy for tumor [33]. To and associates also found that IL-6 and HGF increased tumor cell growth and proliferation in the lung adenocarcinoma cell line, A549. Their findings suggest an “autocrine circuit” among cytokines and growth factors in certain cancer cells which function to accelerate their biologic activities including their metastatic properties [23]. HCC is characterized by a high rate of intra-hepatic invasion. The stroma of HCC is infiltrated by myofibroblasts and studies have shown that HGF is secreted by human liver myofibroblasts and greatly increases the in vitro invasiveness of three human HCC cell lines. This data demonstrated that HCC cells increase HGF secretion by liver myofibroblasts in a paracrine way that acts to enhance invasion [34]. Neaud and associates reported similar results, showing that HGF increased the invasiveness and proliferative rate of two HCC cell lines (HepG2 and HuH7) [27]. Our results have demonstrated that VIP down-regulated the proliferative effects of both Il-6 and HGF which are also shown to play an important role in increasing HepG2 proliferation. These findings suggest a possible antiproliferative effect of VIP on HCC.
Prior studies have shown that VIP has anti-proliferative effects in a variety of tumor cell types and that these antiproliferative actions are mediated via a cAMP-dependent mechanism [35]. Cyclic AMP appears to be an important modulator in malignant transformation and tumor progression in many cell and tissue types [36]. Yin and associates have shown that the 8-chloro analogue of cAMP is reported to be unique among cAMP analogues in its ability to inhibit proliferation, induce differentiation and modulate PKA subunits; it is a site-specific cAMP analogue that mimics the effects of cAMP and micromolar concentrations have been shown to inhibit the growth of a wide variety of human cancer cell lines. The mechanism of action of 8-chloro-cAMP is thought to be related to the cAMP-dependent protein kinase (PKA) signaling pathway which regulates cell proliferation, differentiation and cell death (49). An increase in cAMP is associated with apoptosis (23,48). The binding of 8-chloro-cAMP to the RI subunit releases PKAc and thus activates PKA-I. Cyclic AMP also induces the expression of numerous genes through PKA-mediated phosphorylation of several transcription factors within the nucleus, including cAMP response element-binding protein, AT-1 and NF□B [37]. 8-chloro-cAMP can inhibit both in vitro and in vivo growth of several different HCC cell lines (HepG2, Hep3B and SKHep) via its adenosine metabolite [38].
Our experiments demonstrated that VIP dose-dependently inhibited HepG2 proliferation. and concurrently increased their intracellular cAMP levels. We have shown also that 8-Cl-cAMP dose dependently inhibited the proliferation of HepG2 cells as well as their pSTAT-3 and STAT-3 protein levels. These findings suggest that the anti-proliferative effects of VIP could be mediated via a cAMP-dependent mechanism. Additional studies presented in this paper also showed that treatment of HepG2 cells with VIP decreased both mRNA and protein levels of pSTAT-3 and STAT-3 and that STAT-3 siRNA also dose-dependently inhibited HepG2 cell proliferation. These experiments suggest that the antiproliferative effects of VIP may be mediated through a STAT-3 signal transduction pathway. Thus, the inhibitory effects of VIP on cell proliferation differs from one cell line to another. Takanaga and associates have shown elevation in the intracellular level of cAMP induced the astrocytic differentiation of C6 glioma cells and also showed cAMP-induced autocrine interleukin 6 (IL-6) promoted astrocytic differentiation of C6 cells, and when cells were treated with N6,2-O-dibutyryl cAMP (Bt2 cAMP) and theophylline) or recombinant IL-6 both glial fibrillary acidic protein (GFAP) expression and STAT-3 phosphorylation were induced [39]. Liu and associates also showed similar results in human embryonic kidney (HEK) 293 cells [40]. We are the first to report that cAMP down regulates the levels of both pSTAT-3 or STAT-3 of HepG2 malignant cell line. Our findings agree with Lee and associates that cAMP inhibits the proliferation of HepG2 cells [41]. The precise mechanisms of action of the inhibitory effects of VIP on HepG2 cells proliferation has not yet been elucidated and remain somewhat unclear, but appear to include inhibition of pSTAT-3 and STAT-3 and stimulation of cAMP levels. The inhibitory effects of cAMP could be explained as direct or indirect effects via inhibiting both pSTAT-3 and STAT-3 levels yet to be determined.
There is a great need for developing new and more successful strategies for the treatment of HCC. Although it is premature to predict whether VIP will pass the test of in vivo studies and later on clinical trials, our findings suggest that VIP holds promise as an effective and relatively novel and nontoxic anti-HCC agent.
ACKNOWLEDGMENTS
We would like to thank Aladdein Mattar, M.D.Ph.D. from our Department of Surgery for his assistance in preparing the figures for this manuscript.
Footnotes
Publisher's Disclaimer: This is a PDF file of an unedited manuscript that has been accepted for publication. As a service to our customers we are providing this early version of the manuscript. The manuscript will undergo copyediting, typesetting, and review of the resulting proof before it is published in its final citable form. Please note that during the production process errors may be discovered which could affect the content, and all legal disclaimers that apply to the journal pertain.
Bibliography
- 1.Steel J, Carney M, Carr BI, Baum A. The role of psychosocial factors in the progression of hepatocellular carcinoma. Medical Hypotheses. 2004;62(1):86–94. doi: 10.1016/s0306-9877(03)00263-9. [DOI] [PubMed] [Google Scholar]
- 2.Salem R, Thurston KG, Carr BI, Goin JE, Geschwind JFH. Yttrium-90 microspheres: Radiation therapy for unresectable liver cancer. J Vasc Interv Radiol. 2002;13(9):S223–S229. doi: 10.1016/s1051-0443(07)61790-4. [DOI] [PubMed] [Google Scholar]
- 3.Kelekis NL, Semelka RC, Worawattanakul S, de Lange EE, Ascher SM, Ahn IO, Reinhold C, Remer EM, Brown JJ, Bis KG, Woosley JT, Mitchell DG. Hepatocellular carcinoma in North America: A multiinstitutional study of appearance on T1-weighted, T2-weighted, and serial gadolinium-enhanced gradient-echo images. AJR Am J Roentgenol. 1998;170(4):1005–1013. doi: 10.2214/ajr.170.4.9530051. [DOI] [PubMed] [Google Scholar]
- 4.Casillas VJ, Amendola MA, Gascue A, Pinnar N, Levi JU, Perez JM. Imaging of nontraumatic hemorrhagic hepatic lesions. Radiographics. 2000;20(2):367–378. doi: 10.1148/radiographics.20.2.g00mc10367. [DOI] [PubMed] [Google Scholar]
- 5.Latchman DS, Stephanou A. STAT-1 and STAT-3: Closely related transcription factors with antagonistic effects on cell proliferation and apoptosis. Current Genomics. 2004;5(5):453–457. [Google Scholar]
- 6.Jing N, Tweardy DJ. Targeting STAT-3 in cancer therapy. Anticancer Drugs. 2005;16(6):601–607. doi: 10.1097/00001813-200507000-00002. [DOI] [PubMed] [Google Scholar]
- 7.Jing N, Li YD, Xu XJ, Sha W, Li P, Feng LL, Tweardy DJ. Targeting STAT-3 with G-quartet oligodeoxynucleotides in human cancer cells. DNA Cell Biol. 2003;22(11):685–696. doi: 10.1089/104454903770946665. [DOI] [PubMed] [Google Scholar]
- 8.Nikitakis NG, Siavash H, Sauk JJ. Targeting the STAT pathway in head and neck cancer: Recent advances and future prospects. Curr Cancer Drug Targets. 2004;4(8):637–651. doi: 10.2174/1568009043332736. [DOI] [PubMed] [Google Scholar]
- 9.Brender C, Lovato P, Sommer VH, Woetmann A, Mathiesen AM, Geisler C, Wasik M, Odum N. Constitutive SOCS-3 expression protects T-cell lymphoma against growth inhibition by IFN alpha. Leukemia. 2005;19(2):209–213. doi: 10.1038/sj.leu.2403610. [DOI] [PubMed] [Google Scholar]
- 10.Christine R, Sylvie R, Erik B, Genevieve P, Amelie R, Gerard R, Marc B, Christian G, Samir A. Implication of STAT-3 signaling in human colonic cancer cells during intestinal trefoil factor 3 (TFF3) - and vascular endothelial growth factor-mediated cellular invasion and tumor growth. Cancer Research. 2005;65(1):195–202. [PubMed] [Google Scholar]
- 11.Sun JZ, Blaskovich MA, Jove R, Livingston SK, Coppola D, Sebti SDM. Cucurbitacin Q: a selective STAT-3 activation inhibitor with potent antitumor activity. Oncogene. 2005;24(20):3236–3245. doi: 10.1038/sj.onc.1208470. [DOI] [PubMed] [Google Scholar]
- 12.Nam S, Buettner R, Turkson J, Kim D, Cheng JQ, Muehlbeyer S, Hippe F, Vatter S, Merz KH, Eisenbrand G, Jove R. Indirubin derivatives inhibit STAT-3 signaling and induce apoptosis in human cancer cells. Proc Natl Acad Sci U S A. 2005;102(17):5998–6003. doi: 10.1073/pnas.0409467102. [DOI] [PMC free article] [PubMed] [Google Scholar]
- 13.Dauer DJ, Ferraro B, Song LX, Yu B, Mora L, Buettner R, Enkemann S, Jove R, Haura EB. STAT-3 regulates genes common to both wound healing and cancer. Oncogene. 2005;24(21):3397–3408. doi: 10.1038/sj.onc.1208469. [DOI] [PubMed] [Google Scholar]
- 14.Turkson J, Zhang SM, Palmer J, Kay H, Stanko J, Mora LB, Sebti S, Yu H, Jove R. Inhibition of constitutive signal transducer and activator of transcription 3 activation by novel platinum complexes with potent antitumor activity. Mol Cancer Ther. 2004;3(12):1533–1542. [PubMed] [Google Scholar]
- 15.Coskun U, Bukan N, Sancak B, Gunel N, Ozenirler S, Unal A, Yucel A. Serum hepatocyte growth factor and interleukin-6 levels can distinguish patients with primary or metastatic liver tumors from those with benign liver lesions. Neoplasma. 2004;51(3):209–213. [PubMed] [Google Scholar]
- 16.Sun JZ, Wang DA, Jain RK, Carie A, Paquette S, Ennis E, Blaskovich MA, Baldini L, Coppola D, Hamilton AD, Sebti SM. Inhibiting angiogenesis and tumorigenesis by a synthetic molecule that blocks binding of both VEGF and PDGF to their receptors. Oncogene. 2005;24(29):4701–4709. doi: 10.1038/sj.onc.1208391. [DOI] [PubMed] [Google Scholar]
- 17.Anton PA, Shanahan F, Sun XP, Diehl D, Kodner A, Mayer EA. Vip Modulates Intracellular Calcium Oscillations in Human Lymphoblasts. Immunopharmacology and Immunotoxicology. 1993;15(4):429–446. doi: 10.3109/08923979309035238. [DOI] [PubMed] [Google Scholar]
- 18.Vertongen P, Camby I, Darro F, Kiss R, Robberecht P. VIP and pituitary adenylate cyclase activating polypeptide (PACAP) have an antiproliferative effect on the T98G human glioblastoma cell line through interaction with VIP2 receptor. Neuropeptides. 1996;30(5):491–496. doi: 10.1016/s0143-4179(96)90015-3. [DOI] [PubMed] [Google Scholar]
- 19.Delgado M, Ganea D. Vasoactive intestinal peptide and pituitary adenylate cyclase-activating polypeptide inhibit nuclear factor-kappa B-dependent gene activation at multiple levels in the human monocytic cell line THP-1. Journal of Biological Chemistry. 2001;276(1):369–380. doi: 10.1074/jbc.M006923200. [DOI] [PubMed] [Google Scholar]
- 20.Tuncel N, Tore F, Sahinturk V, Ak D, Tuncel M. Vasoactive intestinal peptide inhibits degranulation and changes granular content of mast cells: a potential therapeutic strategy in controlling septic shock. Peptides. 2000;21(1):81–89. doi: 10.1016/s0196-9781(99)00177-1. [DOI] [PubMed] [Google Scholar]
- 21.Tuncel N, Tore FC. The effect of vasoactive intestinal peptide (VIP) and inhibition of nitric oxide synthase on survival rate in rats exposed to endotoxin shock. Vip, Pacap, and Related Peptides. 1998;865:586–589. doi: 10.1111/j.1749-6632.1998.tb11241.x. [DOI] [PubMed] [Google Scholar]
- 22.Hanzawa M, Shindoh M, Higashino F, Yasuda M, Inoue N, Hida K, Ono M, Kohgo T, Nakamura M, Notani K, Fukuda H, Totsuka Y, Yoshida K, Fujinaga K. Hepatocyte growth factor upregulates E1AF that induces oral squamous cell carcinoma cell invasion by activating matrix metalloproteinase genes. Carcinogenesis. 2000;21(6):1079–1085. [PubMed] [Google Scholar]
- 23.To Y, Dohi M, Matsumoto K, Tanaka R, Sato A, Nakagome K, Nakamura T, Yamamoto K. A two-way interaction between hepatocyte growth factor and interleukin-6 in tissue invasion of lung cancer cell line. Am J Respir Cell Mol Biol. 2002;27(2):220–226. doi: 10.1165/ajrcmb.27.2.4804. [DOI] [PubMed] [Google Scholar]
- 24.Matsumoto H, Koyama C, Sawada T, Koike K, Hirota K, Miyake A, Arimura A, Inoue K. Pituitary Folliculo-Stellate-Like Cell-Line (Ttt Gf) Responds to Novel Hypophysiotropic Peptide (Pituitary Adenylate Cyclase-Activating Peptide), Showing Increased Adenosine-3',5'-Monophosphate and Interleukin-6 Secretion and Cell-Proliferation. Endocrinology. 1993;133(5):2150–2155. doi: 10.1210/endo.133.5.8404665. [DOI] [PubMed] [Google Scholar]
- 25.Sundelin K, Roberg K, Grenman R, Hakansson L. Effects of cytokines on matrix metalloproteinase expression in oral squamous cell carcinoma in vitro. Acta Otolaryngol. 2005;125(7):765–773. doi: 10.1080/00016480510027484. [DOI] [PubMed] [Google Scholar]
- 26.Knight B, Matthews VB, Akhurst B, Croager EJ, Klinken E, Abraham LJ, Olynyk JK, Yeoh G. Liver inflammation and cytokine production,but not acute phase protein synthesis, accompany the adult liverprogenitor (oval) cell response to chronic liver injury. Immunol Cell Biol. 2005;83(4):364–374. doi: 10.1111/j.1440-1711.2005.01346.x. [DOI] [PubMed] [Google Scholar]
- 27.Neaud V, Faouzi S, Guirouilh J, LeBail B, Balabaud C, BioulacSage P, Rosenbaum J. Human hepatic myofibroblasts increase invasiveness of hepatocellular carcinoma cells: Evidence for a role of hepatocyte growth factor. Hepatology. 1997;26(6):1458–1466. doi: 10.1053/jhep.1997.v26.pm0009397985. [DOI] [PubMed] [Google Scholar]
- 28.Syed V, Ulinski G, Mok SC, Ho SM. Reproductive hormone-induced, STAT-3-mediated interleukin 6 action in normal and malignant human ovarian surface epithelial cells. J Natl Cancer Inst. 2002;94(8):617–629. doi: 10.1093/jnci/94.8.617. [DOI] [PubMed] [Google Scholar]
- 29.Absood A, Furutani A, Kawamura T, Graham LM. Differential PDGF secretion by graft and aortic SMC in response to oxidized LDL. 2002;283(2):H725–H732. doi: 10.1152/ajpheart.00060.2002. [DOI] [PubMed] [Google Scholar]
- 30.Lutz EM, MacKenzie CJ, Johnson M, West K, Morrow JA, Harmar AJ, Mitchell R. Domains determining agonist selectivity in chimaeric VIP2 (VPAC(2))/PACAP (PAC(1)) receptors. British Journal of Pharmacology. 1999;128(4):934–940. doi: 10.1038/sj.bjp.0702872. [DOI] [PMC free article] [PubMed] [Google Scholar]
- 31.Kojima M, Ito T, Oono T, Hisano T, Igarashi H, Arita Y, Kawabe K, Coy DH, Jensen RT, Nawata H. VIP attenuation of the severity of experimental pancreatitis is due to VPAC(1) receptor-mediated inhibition of cytokine production. Pancreas. 2005;30(1):62–70. [PubMed] [Google Scholar]
- 32.Filippatos GS, Gangopadhyay N, Lalude O, Parameswaran N, Said SI, Spielman W, Uhal BD. Regulation of apoptosis by vasoactive peptides. American Journal of Physiology-Lung Cellular and Molecular Physiology. 2001;281(4):L749–L761. doi: 10.1152/ajplung.2001.281.4.L749. [DOI] [PubMed] [Google Scholar]
- 33.Namekata K, Takamori S, Kojima K, Beppu T, Futagawa S. Significant changes in the serum levels of IL-6, h-HGF, and type IV collagen 7S during the perioperative period of a hepatectomy: Relevance to SIRS. Surg Today. 2000;30(5):403–409. doi: 10.1007/s005950050612. [DOI] [PubMed] [Google Scholar]
- 34.Guirouilh J, Le Bail B, Boussarie L, Balabaud C, Bioulac-Sage P, Desmouliere A, Schuppan D, Rosenbaum J. Expression of hepatocyte growth factor in human hepatocellular carcinoma. J Hepatol. 2001;34(1):78–83. doi: 10.1016/s0168-8278(00)00014-3. [DOI] [PubMed] [Google Scholar]
- 35.Maruno K, Absood A, Said SI. Vasoactive intestinal peptide inhibits human small-cell lung cancer proliferation in vitro and in vivo. Proceedings of the National Academy of Sciences of the United States of America. 1998;95(24):14373–14378. doi: 10.1073/pnas.95.24.14373. [DOI] [PMC free article] [PubMed] [Google Scholar]
- 36.Yin Y, Allen PD, Jia L, MacEy MG, Kelsey SM, Newland AC. Constitutive levels of cAMP-dependent protein kinase activity determine sensitivity of human multidrug-resistant leukaemic cell lines to growth inhibition and apoptosis by forskolin and tumour necrosis factor alpha. Br J Haematol. 2000;108(3):565–73. doi: 10.1046/j.1365-2141.2000.01903.x. [DOI] [PubMed] [Google Scholar]
- 37.Ollivier V, Parry GCN, Cobb RR, deProst D, Mackman N. Elevated cyclic AMP inhibits NF-kappa B-mediated transcription in human monocytic cells and endothelial cells. J Biol Chem. 1996;271(34):20828–20835. doi: 10.1074/jbc.271.34.20828. [DOI] [PubMed] [Google Scholar]
- 38.Lee J, Choi YH, Nguyen PM, Kim JS, Lee SJ, Trepel JB. Cyclic AMP induces inhibition of cyclin A expression and growth arrest in human hepatoma cells. Biochim Biophys Acta. 1999;1449(3):261–268. doi: 10.1016/s0167-4889(99)00019-1. [DOI] [PubMed] [Google Scholar]
- 39.Takanaga H, Yoshitake T, Hara S, Yamasaki C, Kunimoto M. cAMP-induced astrocytic differentiation of C6 glioma cells is mediated by autocrine interleukin-6. 2004;279(15):15441–15447. doi: 10.1074/jbc.M311844200. [DOI] [PubMed] [Google Scholar]
- 40.Liu AMF, Lo RKH, Wong CSS, Morris C, Wise H, Wong YH. Activation of STAT-3 by G alpha(s) distinctively requires protein kinase A, JNK, and phosphatidylinositol 3-kinase. 2006;281(47):35812–35825. doi: 10.1074/jbc.M605288200. [DOI] [PubMed] [Google Scholar]
- 41.Lee J, Choi YH, Nguyen PM, Kim JS, Lee SJ, Trepel JB. Cyclic AMP induces inhibition of cyclin A expression and growth arrest in human hepatoma cells. 1999;1449(3):261–268. doi: 10.1016/s0167-4889(99)00019-1. [DOI] [PubMed] [Google Scholar]


