

Abstract
Previous work from this laboratory identified a polysome-associated endonuclease whose activation by estrogen correlates with the coordinate destabilization of serum protein mRNAs. This enzyme, named polysomal ribonuclease 1, or PMR-1, is a novel member of the peroxidase gene family. A characteristic feature of PMR-1 is its ability to generate in vitro degradation intermediates by cleaving within overlapping APyrUGA elements in the 5′-coding region of albumin mRNA. The current study sought to determine whether the in vivo destabilization of albumin mRNA following estrogen administration involves the generation of decay intermediates that could be identified as products of PMR-1 cleavage. A sensitive ligation-mediated polymerase chain reaction technique was developed to identify labile decay intermediates, and its validity in identifying PMR-1-generated decay intermediates of albumin mRNA was confirmed by primer extension experiments performed with liver RNA that was isolated from estrogen-treated frogs or digested in vitro with the purified endonuclease. Ligation-mediated polymerase chain reaction was also used to identify decay intermediates from the 3′-end of albumin mRNA, and as a final proof of principle it was employed to identify in vivo decay intermediates of the c-myc coding region instability determinant corresponding to sites of in vitro cleavage by a polysome-associated endonuclease.
The process of mRNA decay is closely linked to translation (1), and a growing body of data links the binding of proteins to the mRNA 3′-end with the efficiency of cap-dependent translation initiation (2, 3). mRNA decay in vertebrates can be generally divided into four basic pathways: deadenylation with the possible link to decapping and 5′-3′ degradation of the mRNA body, deadenylation followed by 3′-5′ decay of the mRNA body, nonsense-mediated decay, which may or may not involve decapping, and endonuclease-mediated decay (4–6). All of these effectively serve to disrupt the link between the 5′-and 3′-ends of the mRNA. It has yet to be proven whether the general pathway of mRNA decay in vertebrates will recapitulate processes that have been characterized in yeast, but there is suggestive evidence to support this.
A significant number of mRNAs are also degraded through endonuclease-mediated pathways (5). Examples include mRNAs for apo-very low density lipoprotein II (7), c-myc (8), transferrin receptor (9), insulin-like growth factor II (10), and α-globin (11). Estrogen induces a global change in the profile of proteins expressed in Xenopus liver resulting from the coordinate destabilization of the serum protein mRNAs (12) and the transcriptional induction and stabilization of the mRNA for the yolk protein precursor vitellogenin (13). mRNA destabilization in this tissue is mediated through the activation of polysomal ribonuclease 1 (PMR-1)1 (14), a novel endonuclease related to the peroxidase gene family (15). PMR-1 is a component of a large mRNP complex bearing its substrate mRNAs, and mRNA decay is initiated by a 22-fold increase in the unit activity of the polysome-bound enzyme following estrogen stimulation.2 This global change in mRNA decay occurs in the absence of major changes in the amount of cellular PMR-1. The purpose of the present study was to determine whether this increase in unit activity is matched by the appearance of albumin mRNA decay intermediates characteristic of endonuclease cleavage by PMR-1.
With the exception of insulin-like growth factor II mRNA, whose unique structure results in a remarkably stable in vivo endonuclease degradation product (10, 16), most mRNAs are degraded without significant accumulation of decay intermediates. However, decay intermediates have been observed using crude in vitro decay systems. The most likely explanation for this is that in vivo these intermediates are subject to rapid exonucleolytic clearance in a manner similar to that which occurs in prokaryotes, where polynucleotide phosphorylase or RNase II rapidly degrade intermediates generated by RNase E (5). For mRNAs that do not show obvious degradation intermediates only a few, highly abundant mRNAs have been examined, in general using primer extension or S1 nuclease protection assays (17). Although these techniques do work, they require long exposure times to visualize metastable products and are not readily applicable to low copy mRNAs. We describe here a new approach using ligation-mediated (LM) RT-PCR to identify the 3′-ends of degradation intermediates generated in vivo as a result of either endonuclease cleavage or pausing of a 3′- to 5′-exonuclease. The rationale behind this was our finding that PMR-1 generates degradation intermediates with 3′-hydroxyls, which are good substrates for further degradation by 3′- to 5′-exonucleases, whereas decay intermediates with 3′-phosphate termini are poor substrates for such enzymes. Using this assay we show that the estrogen-induced increase in unit activity of polysome-bound PMR-1 is accompanied by the appearance of albumin mRNA degradation intermediates corresponding to those generated by in vitro cleavage with the purified endonuclease. As a proof of principle this approach was used to demonstrate in vivo cleavage of c-myc mRNA in the coding region determinant that has been identified from in vitro studies as a potential regulatory element by Ross and coworkers (8, 18).
MATERIALS AND METHODS
Experimental Animals
Male Xenopus were obtained from Xenopus One (Ann Arbor, MI), fed a synthetic diet, and maintained in plastic aquaria with a 12-h light-dark cycle. One milligram of estradiol-17β was injected in 0.1 ml of a solution of 10% Me2SO/90% propylene glycol into the dorsal lymph sac. Animals were anesthetized with 0.1% tricaine methanesulfonate prior to removing the liver.
Purification of Xenopus Liver RNA
Livers were removed and perfused with ice-cold 1× SSC to remove as much blood as possible. They were chopped into 1-mm cubes followed by the addition of 10 ml/g of tissue of 5 m guanidine isothiocyanate, 50 mm Tris-HCl, pH 7.5, 10 mm EDTA, 5 mm β-mercaptoethanol, and the mixture was homogenized at 4 °C for 2 min at 4000 rpm using a Teflon glass homogenizer. The homogenate was centrifuged at 12,000 × g for 10 min at 4 °C to remove any insoluble material. One-tenth volume of 20% (w/v) N-lauroylsarcosine was added, and the mixture was heated at 65 °C for 2 min to denature protein. 0.1 g of CsCl/ml liver extract was added, and the extract was layered over 9 ml of 5.7 m CsCl in a siliconized polyallomer tube and centrifuged overnight at 113,000 × g at 22 °C in a Sorvall TH-641 swinging-bucket rotor. The supernatant was carefully removed, and the RNA pellet was dissolved in 3 ml of 5 mm EDTA, 0.5% (w/v) N-lauroylsarcosine, 5% (v/v) β-mercaptoethanol at 4 °C for 24 h. RNA was extracted once with one volume of phenol:chloroform:isoamyl alcohol (25:24:1) and once with one volume of chloroform:isoamyl alcohol (24:1). Sodium acetate, pH 5.2, was added to 0.3 m and RNA was precipitated by addition of 2.5 volumes of ice-cold ethanol. The recovered RNA pellet was washed with 70% ethanol and dissolved in DEPC-treated water prior to use.
Cell Culture
Murine erythroleukemia cells (MEL cells) were obtained from Dr. Lynne Maquat. They were cultured in Dulbecco’s minimal essential medium containing 10% fetal bovine serum. Total cellular RNA was isolated using TRIzol reagent (Life Technologies, Inc.) following the manufacturer’s protocol.
Primer Ligation
Between 2 and 10 μg of total RNA was added to a 15-μl reaction containing 50 mm Tris, pH 8, 10 mm MgCl2, 20 mm ATP, 2 mm DTT, 10 μg/ml BSA, 1 mm hexamine cobalt chloride, 25% (w/v) polyethylene glycol 8000, 30 units of placental ribonuclease inhibitor, and 2 μg of ligation primer MH11NH3P. The ligation primer MH11NH3P (P-CCAGGTGGATAGTGCTCAATCTCTAGATCG-NH3) was prepared by Operon and has 5′-phosphate and 3′-amino termini. Ligations were performed at 4 °C for 16 h with 15 units of T4 RNA ligase (Life Technologies, Inc.). The reaction mixture was extracted once with one volume of phenol:chloroform:isoamyl alcohol (25:24:1) and once with one volume of chloroform:isoamyl alcohol (24:1). The aqueous layer was adjusted to 0.3 m sodium acetate, pH 5.5, and RNA with the ligated primer was precipitated by addition of 2.5 volumes of ice-cold ethanol.
RT-PCR
The entire mixture of RNA ligated to the MH11NH3P primer was resuspended in 11 μl of DEPC-treated water, followed by addition of 250 ng of the primer MH12 (5′-CGAGCTAGAGATTGAGCAC), which is complementary to the first 19 nt of MH11NH3P. The solution was heated to 100 °C for 3 min and quickly cooled on ice. To this was added 4 μl of 5× buffer (250 mm Tris-HCl, pH 8.3, 375 mm KCl, 15 mm MgCl2, 10 mm DTT), 0.5 mm dNTPs, and H2O to a total volume of 20 μl. The mixture was heated at 42 °C for 2 min followed by the addition of 200 units of Superscript II reverse transcriptase (Life Technologies, Inc.) and incubated for an additional 50 min. The reaction was terminated by heating at 70 °C for 15 min. Three μl of the above reaction mixture was mixed with 2.5 μl of 10× buffer (100 mm Tris-HCl, pH 8.9, 1 m KCl, 15 mm MgCl2, 500 μg/ml BSA, 0.5% Tween 20 (v/v)). To this was added MgCl2 and dNTPs to a final concentration each of 3 mm. The wax bead of the Hot Start tube (Life Technologies, Inc.) was melted by heating the tube to 75 °C for about 30 s, and the mixture was cooled quickly on ice. 11 μl of DEPC water, 2 μl of 5′-32P-labeled gene-specific primer, and 0.5 μl of tTh polymerase from Roche Molecular Biochemicals (Indianapolis, IN) were then added to a final volume of 25 μl. The mixture was heated at 95 °C for 2 min, and PCR amplification was performed for 25 cycles at 95 °C for 2 min, 58 °C for 30 s, and 72 °C for 1 min, followed by extension for 3 min at 72 °C using primers synthesized by Operon Technologies (Alameda, CA). The gene-specific primers used were, Set A1 (5′-CGCGGTACCTGGATCACCCTGATTTGTC, beginning at position 40 of albumin mRNA), Set G1 (5′-TCCTTGTGAAGCTGATTA, beginning at position 1690 of albumin mRNA), and MH28 (5′-AAGAGGCGAACACACAACG, beginning at position 1669 of c-myc mRNA). The reaction mixtures were then extracted as above with phenol:chloroform:isoamyl alcohol, and amplified products were recovered by ethanol precipitation. The recovered pellet was dissolved in 3 μl of DEPC H2O, and an equal volume of formamide loading dye (80% formamide, 1 mm EDTA, pH 8, 0.1% bromphenol blue, and 0.1% xylene cyanol). This was heated for 5 min at 95 °C and loaded into a single lane of a denaturing 6% polyacrylamide/urea gel.
Product Recovery, Reamplification, and Sequencing
Products from the above reaction were identified by autoradiography of the dried polyacrylamide gel. The bands of interest were extracted from the dried gel following a modified protocol from Jo et. al. (19). The film was aligned with the gel, and an 18-gauge needle was used to punch holes at the four corners of each band. A fresh razor blade was then used to cut out each desired band, and the excised gel fragments were soaked in 200 μl of distilled H2O for 10 min. The tube was then boiled for 15 min with Parafilm to hold the lid closed. This was then centrifuged at 10,000 × g for 2 min, and the supernatant was removed. DNA was recovered by addition of one-tenth volume of 3 m sodium acetate, pH 5.5, 50 μg of glycogen, and 900 μl of 100% ethanol, followed by chilling at −80 °C for 30 min. The DNA pellet was recovered by centrifugation at 14,000 × g, 4 °C for 15 min, washed with cold 85% ethanol, and dissolved in 12 μl of distilled H2O.
Four microliters of the extracted DNA was added to a 40-μl reaction containing 4 μl of a 10× buffer consisting of 100 mm Tris-HCl, pH 8.9, 1 m KCl, 15 mm MgCl2, 500 μg/ml BSA, 0.5% Tween 20 (v/v). The reaction mixture was adjusted to 1.5 mm MgCl2, followed by the addition of 0.4 mm dNTPs, 1 ng of primer MH12, 1 ng of the gene-specific primer, and 2.5 units of tTh polymerase (Roche Molecular Biochemicals, Inc.). PCR amplification was performed as described above, following which 8 μl was treated with 10 units of exonuclease I and 2 units of shrimp alkaline phosphatase for 20 min at 37 °C to remove unincorporated primers. This reaction was terminated by heating for 15 min at 80 °C, followed by addition of 20 ng of the original gene-specific primer. This was annealed to the template, by heating at 100 °C for 3 min and then cooling on ice for 5 min, and sequenced using T7 DNA polymerase (USB T7 Sequenase Kit). The products were denatured and electrophoresed on a 6% polyacrylamide/urea gel as described above.
In Vitro Cleavage of the 3′-End of Albumin mRNA
A 5′-32P-labeled transcript corresponding to region G in Fig. 2 (spanning 1690–2002 of albumin mRNA) was prepared as described previously (17). This was incubated with 10 μg of polysome extract from estrogen-treated frogs (Fig. 5A) or 20 units of PMR-1 purified as described previously (20, 21) (Fig. 5B) in 30 mm Tris-HCl, pH 7.5, 1 mm DTT, 2 mm MgCl2, and 75 mm KCl, at 23 °C. One unit of PMR-1 is the amount needed to completely cleave 7 fmol of albumin substrate transcript in 30 min at 23 °C. The reactions were stopped by adding one volume of stop solution (98% formamide (v/v), 0.1% (v/v) bromphenol blue, and 0.1% xylene cyanole) and heating at 95 °C for 3 min. The samples were then electrophoresed on a 6% polyacrylamide-urea gel, and cleavage products were visualized by autoradiography.
Fig. 2. Consensus PMR-1 cleavage sites in albumin mRNA.
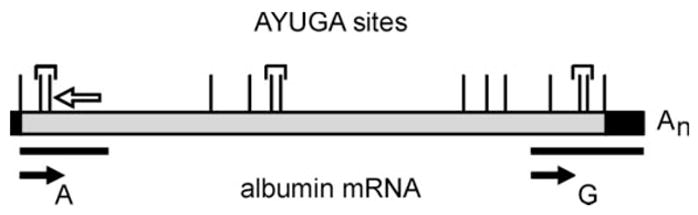
The 14 consensus APyrUGA PMR-1 cleavage sites in albumin mRNA are indicated by vertical lines, with brackets identifying the three sites with overlapping elements. The 5′ region A and 3′ region G examined by LM-PCR are indicated by the horizontal lines, with the locations of the LM-PCR primers indicated by filled arrows. The open arrow above the schematic indicates the position of the oligonucleotide used for primer extension analysis in Fig. 4. The albumin mRNA coding region is indicated in gray, and the untranslated regions are indicated in black.
Fig. 5. LM-PCR identification of decay intermediates in the 3′-end of albumin mRNA.
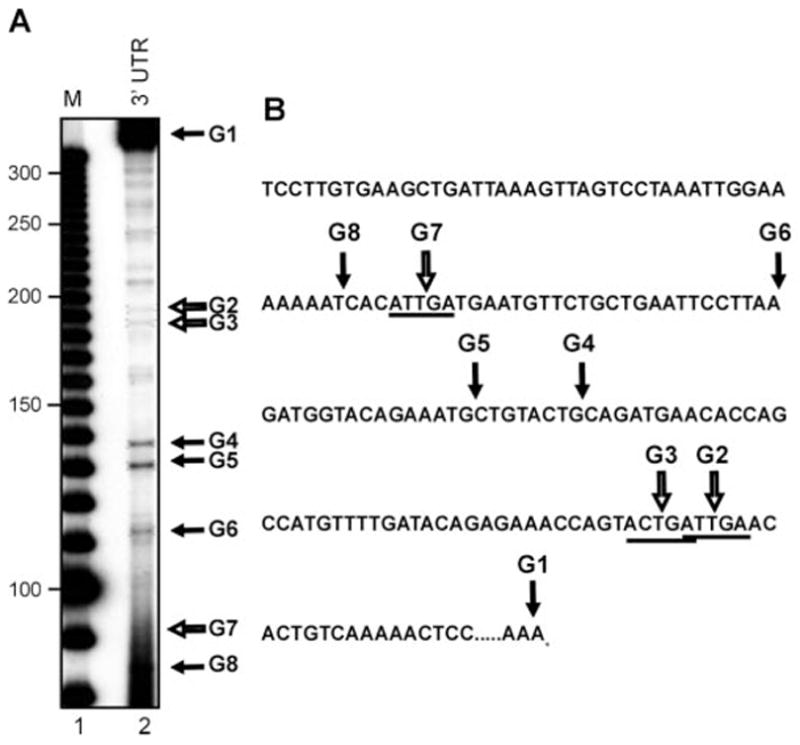
A, LM-PCR was performed with 2 μg of total liver RNA from a 24-h estrogen-treated frog using a primer that amplifies from position 1690 to the end of albumin mRNA. The PCR products were separated on a 6% polyacrylamide/urea gel and the bands of interest, shown by the arrows, were extracted from the gel and sequenced. A 10-bp molecular size ladder is shown in lane 1 (M). B, the sequence of the 3′-end of albumin mRNA corresponding to the region analyzed in A is shown with the in vivo degradation intermediates indicated with arrows. Consensus APyrUGA sites are underlined.
RNase T1 Digestion and RNA Structure Modeling
A 5′-32P-labeled transcript corresponding to nt 1690–2002 of albumin mRNA was added to 10 μl of hybridization III buffer from the Ambion RNase Protection Assay III kit (Ambion, Austin, TX). This was heated for 5 min at 50 °C and cooled slowly to room temperature. To this was added 150 μl of RNase digestion buffer III containing 5 units of RNase T1. Samples were incubated for 5–25 min at 37 °C, and the reaction was stopped by addition of 225 μl of RNase inactivation/precipitation III solution. Digested RNA was recovered by addition of 150 μl of ethanol, and 10 μg of yeast tRNA, followed by precipitation at −20 °C. The pellet was dissolved in 6 μl of gel loading buffer II, and products were separated on a 6% denaturing polyacrylamide/urea gel and visualized by autoradiography. The positions of single-stranded G residues identified by RNase T1 digestion were used to model the secondary structure of this portion of albumin mRNA using the MFOLD server (22).
Primer Extension
Primer extension analysis of albumin mRNA was performed as described previously (17). 10-μg samples of total liver RNA isolated 12 h after injection of estradiol were either kept on ice or digested as described above with 20 or 40 units of purified PMR-1. The mixtures were heated to inactivate PMR-1, and ethanol was precipitated with 1–2 × 10⁵ dpm of 5′-32P-labeled primer DAN25 (5′-CACT-CAGGAGTTTTGTCATTAA), which is complementary to nucleotides 280–301 of albumin mRNA. The precipitated RNA and primer were dissolved in 10 μl of annealing buffer (50 mm Tris-HCl, pH 8.7, 0.54 m KCl, 1 mm EDTA), heated at 65 °C for 10 min, and slowly cooled to 25 °C. To each tube was added a mixture of 0.9 mm dATP, dCTP, dGTP, TTP/50 mm Tris-HCl, pH 8.3/13 mm MgCl2/7 mm dithiothreitol and 200 units of Moloney murine leukemia virus reverse transcriptase to a total volume of 40 μl. The reaction mixture was incubated for 1.5 h at 42 °C and stopped by the addition of 260 μl of stop solution (0.3 m sodium acetate, 10 mm Tris-HCl, pH 8.0, 1 mm EDTA). Products were recovered by precipitation with 600 μl of cold ethanol. The final pellets were dissolved in 6 μl of formamide loading buffer and electrophoresed on a 6% acrylamide/urea gel. The position of primer extension stops and nuclease cleavage sites was determined relative to a sequencing ladder prepared from the cloned cDNA and the same primer.
RESULTS
A Sensitive LM-PCR Assay for Detecting in Vivo mRNA Degradation Intermediates
Earlier work found that degradation intermediates generated by in vitro PMR-1 cleavage of albumin mRNA contained free 3′-hydroxyls, making them susceptible to degradation by 3′- to 5′-exonucleases (23). We took advantage of this observation to develop a generally applicable approach to the identification of in vivo mRNA degradation intermediates. The method diagrammed in Fig. 1 involves ligation of a common primer to the 3′-ends of all RNA molecules followed by reverse transcription primed with a nested complementary primer to generate a population of cDNAs corresponding to all of the primer-tagged RNA fragments in the population. The cDNA is PCR-amplified using a 5′-32P-labeled sense-strand primer specific to the mRNA of interest and the nested primer used for reverse transcription, and the resulting products are separated on a denaturing polyacrylamide/urea gel. Bands identified by autoradiography are excised, re-amplified, and sequenced to identify the 3′-end of the mRNA degradation intermediate at the junction between the ligated primer and the target mRNA. Key to this process is the use of a ligation primer that has been modified by addition of a 5′-phosphate for the ligation to the 3′-hydroxyl termini, and a 3′-amino group to prevent further multimerization of the primer during ligation. This technique does not distinguish between decay intermediates generated by endonuclease cleavage versus those produced by pausing of a 3′- to 5′-exonuclease, but as noted under “Discussion,” the latter have not been detected in mRNAs bearing poly(G) tracts.
Fig. 1. The LM-PCR protocol for identification of mRNA decay intermediates.
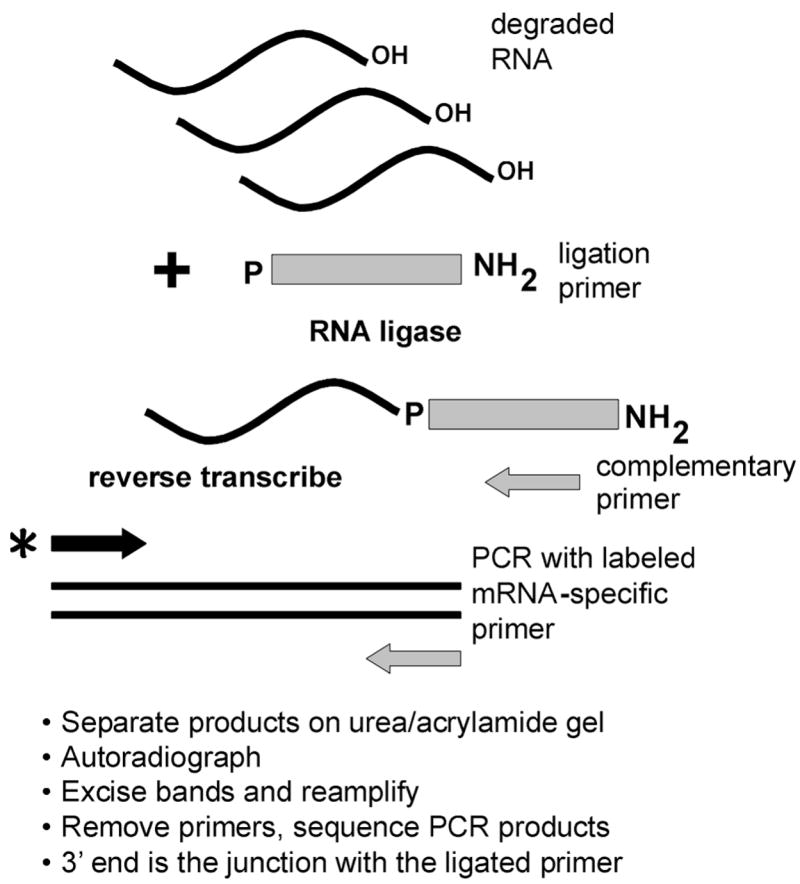
The LM-PCR protocol is based on the observation that PMR-1 decay intermediates have 3′-hydroxyls. A DNA ligation primer bearing a 5′-phosphate and a 3′-amino group are ligated to a preparation of total RNA using RNA ligase. Reverse transcription is primed with a complementary primer, and the resulting cDNA is amplified using the complementary primer and a 5′-end-labeled primer specific to the mRNA under study. Amplified products are separated on a denaturing polyacrylamide gel, identified by autoradiography, re-amplified by PCR, and sequenced to identify the 3′-end of the degradation intermediate at the junction with the ligated primer.
LM-PCR Identification of in Vivo Albumin mRNA Decay Intermediates
PMR-1 was identified and purified based on its ability to generate a unique product by cleaving within overlapping APyrUGA elements in the 5′-coding region of the molecule (14, 20). Although PMR-1 cleaves preferentially within APyrUGA elements, it is not a restriction endonuclease and also cleaves at numerous “nonconsensus” elements (15, 23). Fig. 2 shows a schematic representation of albumin mRNA with the positions of the 14 APyrUGA elements indicated in relation to the coding (gray) and noncoding (black) regions. All of these elements fall within the coding region, and there are three pairs of overlapping elements (identified with brackets). Because the in vitro cleavage properties of PMR-1 were characterized with the portion of the 5′-coding region, identified as A in Fig. 2, this sequence was evaluated for the appearance of in vivo degradation intermediates following estrogen administration. Male Xenopus were injected with 1 mg of estradiol, and total liver RNA isolated 12 or 24 h later was analyzed by LM-PCR using the A1 primer (indicated with a filled horizontal arrow in Fig. 2) beginning at position 40 of albumin mRNA. Lung RNA isolated at time 0 was used as a control. Fig. 3A shows the gel separation of RT-PCR products generated by amplification with 32P-labeled A1 primer. The bands numbered on the right side of the autoradiogram correspond to the cleavage sites mapped in Fig. 3C onto structure of the corresponding region of albumin mRNA. A nonspecific product distinct from albumin mRNA was seen to varying degrees in all samples (filled circle). Two major amplification products from time 0 liver RNA were seen in the lower third of the gel, one of which corresponded to position A14, and the other of which was too close to the sequencing primer to be identified (open circle). Of note was the time-dependent appearance of new products 12 and 24 h after estrogen administration (lanes 3 and 4).
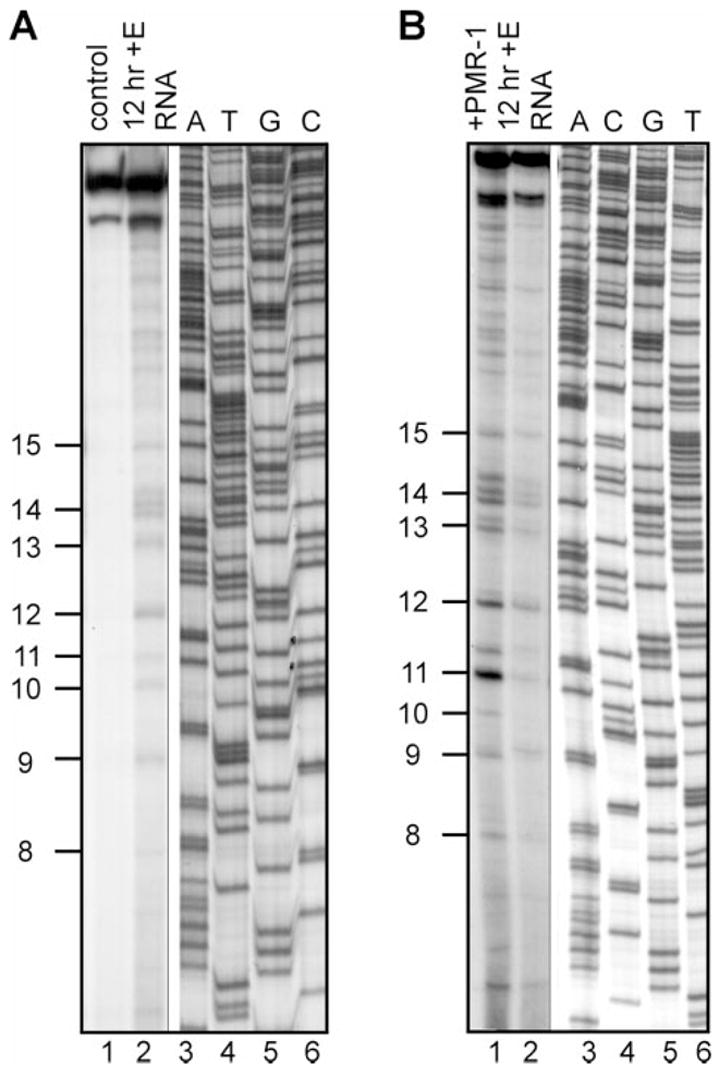
Fig. 3. LM-PCR identification of decay intermediates in the 5′-coding region of albumin mRNA.
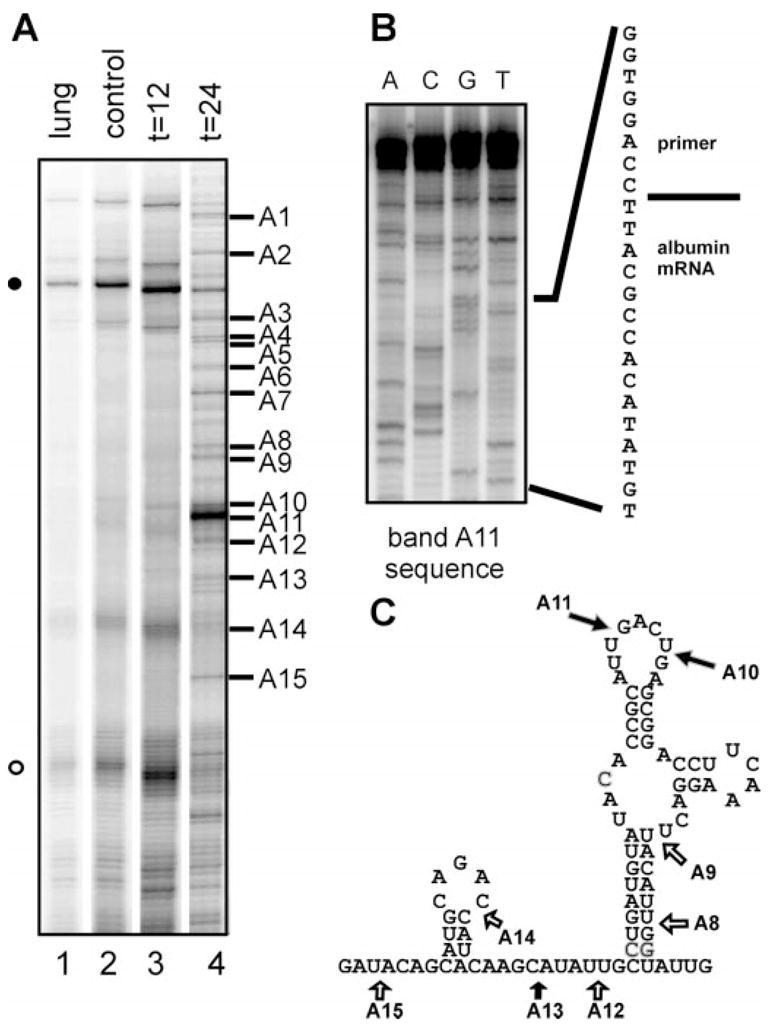
A, LM-PCR was performed with 10 μg of total lung RNA (lane 1) or 10 μg of total liver RNA prepared 0, 12, or 24 h after estrogen administration using a 5′-32P-labeled primer complimentary to a portion of the 5′-end of the mRNA. The PCR products were separated on a 6% polyacrylamide/urea gel and visualized by autoradiography. The numbers on the right side of the autoradiogram correspond to the sites shown in C. B, the prominent band A11 was excised, re-amplified, and sequenced to identify the junction between the ligated primer and the mRNA degradation intermediate. C, each of the numbered bands in A was re-amplified and sequenced as in B, and their position is shown on the mapped secondary structure of the 5′-coding region of albumin mRNA bearing the overlapping APyrUGA elements whose in vitro cleavage by PMR-1 was previously characterized (23). The open arrows correspond to in vivo degradation intermediates that were not observed by in vitro cleavage with purified PMR-1.
Each of the indicated bands was excised from the gel, amplified, and sequenced to identify the junction between the ligated primer and albumin mRNA degradation products. An example of this is shown in Fig. 3B for band A11. The sequence 5′-AUU-primer-3′, corresponded to cleavage 5′-AUU/GAACUGA-3′ within the first APyrUGA element in the stem-loop of this portion of albumin mRNA. The positions of the in vivo cleavage sites identified in region A are indicated in Fig. 3C with numbered arrows corresponding to the LM-PCR products in Fig. 3A. The filled arrows on this figure identify in vivo sites that correspond to the main sites of in vitro cleavage by purified PMR-1.
Previous work characterized PMR-1 as cleaving between the two pyrimidines in the APyrUGA consensus element (23). The absolute identification of cleavage sites afforded by the sequencing of LM-PCR products indicated that this was misplaced by a single nucleotide, a result that likely came from the use of DNA markers and sequencing ladders to size RNA degradation intermediates. The actual cleavage lies between the U and G residues, a result that is consistent with inactivation of cleavage upon mutating APyrUGA to APyrAGA (23). The corrected cleavage sites are indicated in all the figures presented here.
Primer Extension Confirms the LM-PCR Identification of in Vivo PMR-1 Cleavage Sites
In the experiments in Fig. 4 primer extension was used to both validate the LM-PCR identification of in vivo decay intermediates and to show that these resulted from cleavage by PMR-1. In the experiment in Fig. 4A total liver RNA was isolated from control frogs or frogs injected with estradiol 12 h prior to death, and primer extension was performed using a primer for region A indicated by the open arrow above the schematic for albumin mRNA in Fig. 2. The positions of the cleavage site were determined relative to a DNA sequencing ladder prepared from albumin cDNA using the same primer. Although the 12-h post-estrogen liver RNA had little intact full-length albumin mRNA, both this and control RNA display equal signal intensities for products that extend from the primer to the cap site. Because the primer extension will detect all mRNA decay intermediates upstream from the 5′-end of the primer at position 301, these results indicate that there is a substantial population of 5′ decay intermediates that are not detected as discrete products by Northern blot. In agreement with the results in Fig. 3, there was little evidence for decay intermediates within the 5′ 300 nt of albumin mRNA extracted from control animals, and RNA from 12-h estrogen-treated frogs displayed the same in vivo decay intermediates by primer extension (numbered on the side) as those identified in Fig. 3 by LM-PCR.
Fig. 4. Primer extension analysis of in vivo and in vitro decay intermediates from region A of albumin mRNA.
A, primer extension was performed on liver RNA isolated from control frogs (lane 1) or animals injected estradiol 12 h prior to death (lane 2) using a 5′-32P-labeled primer whose position is indicated by an open arrow above the schematic in Fig. 2. Lanes 3–6 are a DNA sequencing ladder prepared using the same primer and the corresponding albumin cDNA. The positions of the in vivo decay intermediates corresponding to those mapped onto the structure in Fig. 3C are indicated on the left side of the autoradiogram. B, the RNA from 12-h estrogen-treated frogs was incubated for 30 min at 22 °C with (lane 1) or without (lane 2) 40 units of purified PMR-1. One unit of PMR-1 activity equals the amount of enzyme that completely degrades 7 fmol of an albumin mRNA substrate transcript corresponding to region A in 30 min at 22 °C. The positions of the decay intermediates are indicated as in A.
To determine whether these products resulted from in vivo cleavage by PMR-1 we subjected the 12-h post-estrogen liver RNA to in vitro digestion with purified PMR-1. Because this preparation retained a significant amount of the first 300 nt of albumin mRNA, we reasoned that further in vitro digestion with purified PMR-1 should amplify the signal intensity of products generated by PMR-1 cleavage in vivo. Alternatively, if these decay intermediates were not generated by PMR-1, further in vitro digestion with the purified enzyme would generate a different set of primer extension products. The results of digestion with 40 units of purified PMR-1 are shown in lanes 1 and 2 of Fig. 4B. In vitro cleavage of RNA that was partially “precleaved” in vivo resulted in increased signal intensity for all of the products identified by both LM-PCR and primer extension. Because previous work showed that these decay products are unique to PMR-1 (23) these results indicate that the identified decay intermediates resulted from in vivo cleavage by PMR-1.
Application of LM-PCR to Identify Degradation Intermediates from the 3′-End of Albumin mRNA
Unlike region A in the 5′-coding portion of albumin mRNA, metastable degradation intermediates were never observed in the course of in vitro decay experiments using transcripts from the 3′-end of albumin mRNA (14). Region G (Fig. 2), spanning position 1690 to 2002 of albumin mRNA, contains 173 nt of the coding region and the 139-nt 3′-UTR, and has four APyrUGA elements. In vivo cleavage within this sequence was analyzed by LM-PCR in Fig. 5 using the RNA from 24-h estrogen-treated frogs evaluated in Fig. 3. It should be noted that the 6% polyacrylamide gels used here and in Fig. 6 are only capable of resolving cleavage at three of the four APyrUGA sites. Eight LM-PCR products were identified in the gel in Fig. 5A, and their positions in the sequence of region G are indicated in Fig. 5B. Site G1 corresponds to the 3′-end of albumin mRNA, and sequencing of this confirmed the presence of the <17-nt poly(A) tail seen in our previous work (24). Like the consensus sites A10 and A11 in the 5′-coding region, there are two overlapping APyrUGA elements in this portion of albumin mRNA (sites G2 and G3). However, neither of the LM-PCR products corresponding to cleavage at G2 and G3, nor the product for cleavage at the other APyrUGA element G7, were as prominent as that seen for A11 in Fig. 3A.
Fig. 6. In vitro cleavage of the 3′-end of albumin mRNA.
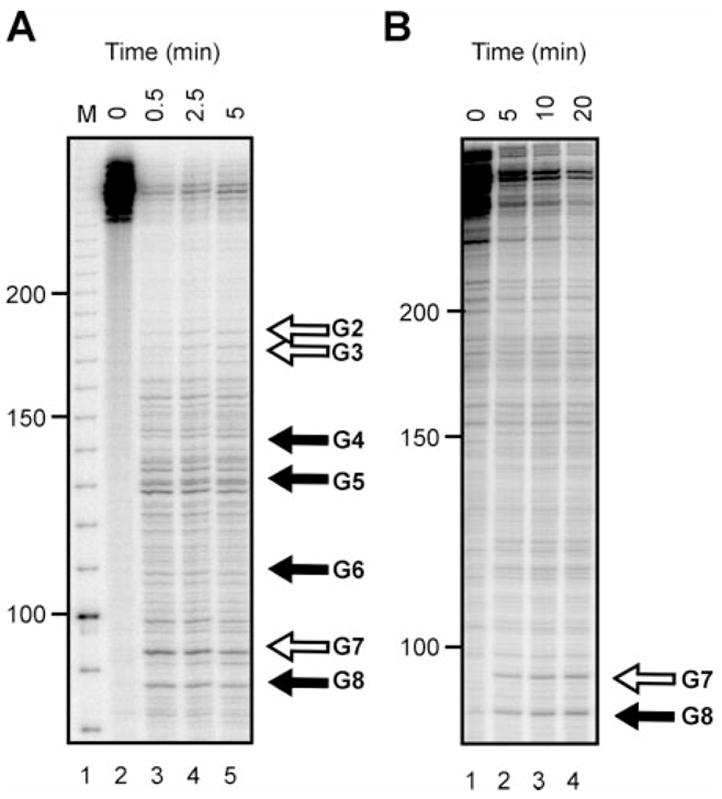
A, a 5′-end-labeled transcript, corresponding to the 3′ 310 nt of albumin mRNA analyzed in Fig. 4, was incubated at 23 °C for the indicated times with 10 μg of polysome extract from 24-h estrogen-treated frogs prepared as described previously (14). The products were separated on a 6% polyacrylamide/urea gel and visualized by autoradiography, and the degradation fragments corresponding to the in vivo cleavage products are indicated with arrows. As in Fig. 3 cleavage within the APyrUGA elements is identified by open arrows. B, the transcript used in A was incubated for the indicated times with 20 units of purified PMR-1. One unit of PMR-1 is the amount needed to completely cleave 7 fmol of albumin substrate transcript in 30 min at 23 °C. The products were separated as described in A and are labeled corresponding to the in vivo cleavage sites on the right.
In Vitro Cleavage of the 3′-End of Albumin mRNA
To determine why results with region G did not match those seen with region A, we determined the pattern of in vitro cleavage of region G of albumin mRNA using 5′-end-labeled transcript in a manner similar to that used earlier to study cleavage within region A (23). In the experiment in Fig. 6A, region G transcript was incubated with polysome extract from estrogen-treated frogs prepared as described previously (14). Degradation intermediates corresponding to the in vivo cleavage sites identified in Fig. 5 are labeled on the right. Although numerous bands were seen that are typical for in vitro assays, the main pattern was similar to that observed for in vivo decay by LM-PCR. This experiment was repeated in Fig. 6B using 20 units of purified PMR-1 instead of polysome extract. Here only two major cleavages were observed, one at site G7, which contains a consensus APyrUGA element, and one at the adjacent site G8. Based on results obtained in Figs. 3 and 4, we suspect that 1) the better correspondence between the cleavage pattern seen with polysome extract and in vivo decay intermediates either resulted from the presence of auxiliary proteins in the extract that potentiate the ability of PMR-1 to cleave this portion of albumin mRNA or 2) some of these bands are products of additional steps in mRNA decay.
Impact of Secondary Structure on PMR-1 Cleavage of the Albumin mRNA 3′-End
When APyrUGA is present in a single-stranded conformation, it is the predominant site for PMR-1 cleavage in both albumin (14) and vitellogenin mRNA (25); however, PMR-1 is unable to cleave within the element when present in double-stranded RNA (23). To test whether the lack of strong cleavages within APyrUGA sites in region G was due to RNA secondary structure, a 5′-end-labeled transcript was digested with limiting amounts of RNase T1, and the identified single-stranded G residues were used to model this sequence to secondary structure with the MFOLD program (22). The results of the T1 digestion are shown in Fig. 7A, and the derived secondary structure is shown in Fig. 7B. In this structure the sites cleaved by RNase T1 sites are identified as H, the APyrUGA elements are boxed, and the in vivo cleavage sites are indicated with arrows. Both the APyrUGA element at G7 and the adjacent nonconsensus site G8 are in a large single-stranded bulge. The overlapping APyrUGA sites at G2 and G3 are in a constrained hairpin structure that would prevent cleavage by PMR-1 in a manner similar to that observed previously (23). This accounts for the minimal cleavage observed here in Fig. 6. Although the fourth consensus site was present in this transcript, it was not resolved in Fig. 6; this element too was structurally constrained and unlikely to be cleaved in vitro by PMR-1. Taken together, these results indicate structural constraints within the 3′-end of albumin mRNA impact on its ability to be cleaved by PMR-1. Nevertheless, the in vitro decay pattern matches that observed in vivo by LM-PCR.
Fig. 7. Secondary structure of the 3′-end of albumin mRNA.
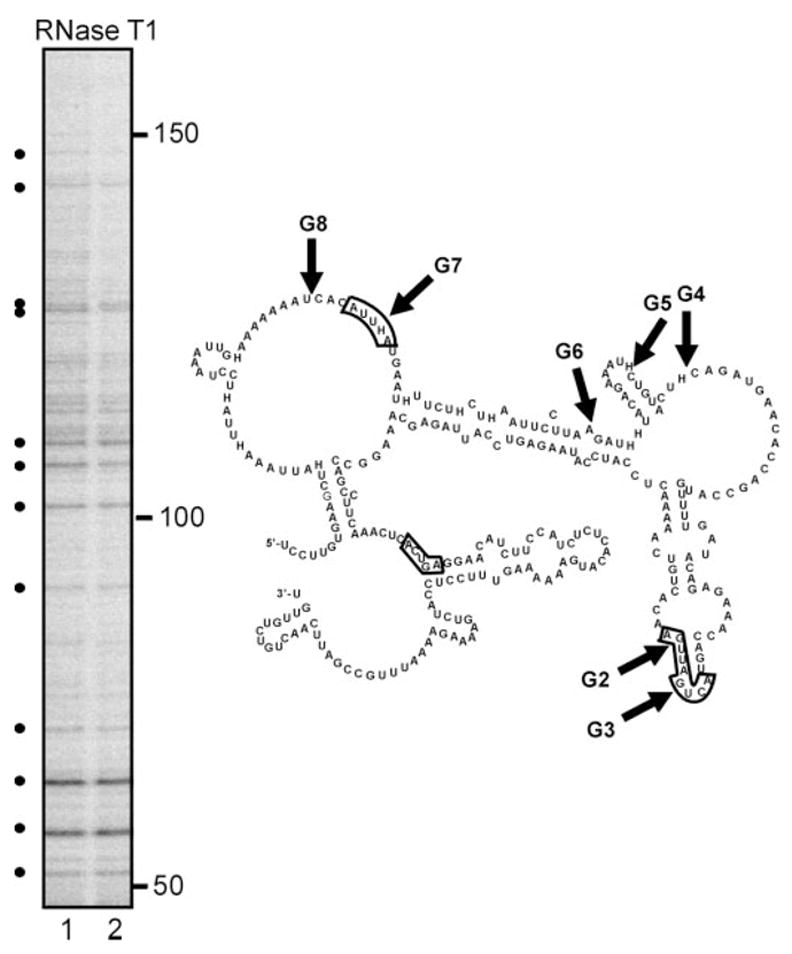
The 5′-32P-labeled transcript for the albumin mRNA 3′-end was incubated with 5 units of RNase T1, and the products were separated on a denaturing 6% polyacrylamide/urea gel. Lanes 1 and 2 correspond to 10 and 15 min of digestion. The positions of cleaved G residues (identified by dots on the autoradiogram) were determined by mobility relative to size standards. These were used to guide the generation of a predicted secondary structure using MFOLD. The RNase T1 cleavage sites appear as H in the structure, and the eight cleavage sites mapped in vivo and in vitro are labeled by the arrows. The four APyUGA sequences present are identified by the boxes. Note that the APyrUGA site in the bottom left portion of the structure was not resolved in the gels used in Figs. 5–7.
Identification of Decay Intermediates Consistent with in Vivo Endonuclease Cleavage within the c-myc CRD
Ross and coworkers identified an mRNA instability determinant within the coding region of c-myc mRNA (the coding region determinant (26)) that is both a site for in vitro cleavage by a polysome-associated endonuclease activity (8) and for binding by a KH-domain protein (18). Because little was known about the relationship between the CRD and the degradation of c-myc in vivo, we chose to examine cleavage within the CRD as a test of the ability of LM-PCR to detect labile in vivo decay intermediates from a rare and inherently unstable mRNA. In the experiment in Fig. 8 LM-PCR was performed on 2 μg of total RNA isolated from murine erythroleukemia (MEL) cells using a gene-specific primer complementary to nucleotides 1669–1687 of c-myc mRNA. A denaturing polyacrylamide gel of the 32P-labeled LM-PCR products is shown in Fig. 8A, and the sequence of this portion of c-myc mRNA showing the locations of the five identified in vivo mRNA degradation intermediates is shown in Fig. 8B. As with albumin mRNA, each of these sites was determined by the sequence of the junction between the ligated primer and the c-myc mRNA degradation intermediate. Band 4 is particularly noteworthy here, because this corresponds to a previously mapped site for in vitro cleavage of c-myc mRNA (8), thus supporting the notion that the in vivo degradation of c-myc mRNA involves endonucleolytic cleavage. In addition, these results demonstrate that the LM-PCR approach to mapping in vivo mRNA decay intermediates is generally applicable to both highly abundant mRNAs like albumin, and rare mRNAs like c-myc.
Fig. 8. LM-PCR mapping of in vivo degradation intermediates within the c-myc coding region determinant.
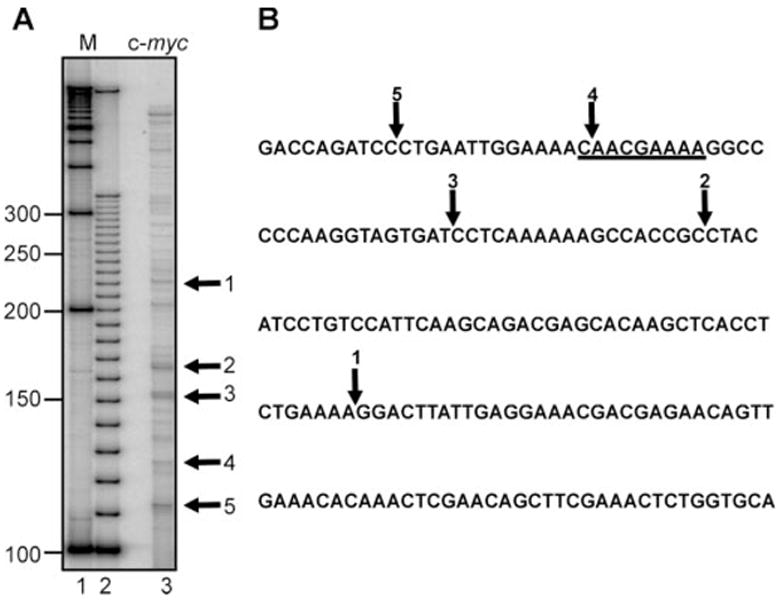
A, LM-PCR was performed as in Fig. 3 with 2 μg of total RNA isolated for MEL cells using a primer specific to a region upstream of the c-myc CRD. The PCR products were separated on a 6% acrylamide/urea gel, and the bands of interest, shown by the arrows, were excised out and sequenced. B, the region of c-myc mRNA containing the CRD is shown with the arrows indicating the locations of the in vivo degradation intermediates identified in A. The underlined region corresponds to the region previously shown to be cleaved in vivo by a polysome-associated endonuclease (8).
DISCUSSION
With few exceptions, mRNA degradation in vivo is not accompanied by the appearance of stable degradation intermediates. The most likely explanation for this is that in vivo these intermediates are subject to rapid exonucleolytic clearance. However, decay intermediates are observed using crude in vitro decay systems, and the similarity seen between in vivo and in vitro decay intermediates from the 3′-end of albumin mRNA in Figs. 5 and 6 underscores the usefulness of such systems in recapitulating steps in mRNA decay. Primer extension and S1 protection assays have been used successfully to identify in vivo endonuclease cleavage of apo-very low density lipoprotein II mRNA (7) and transferrin receptor mRNA (9), and we have used these approaches to demonstrate in vivo cleavage within the APyrUGA consensus PMR-1 cleavage sites in region A of albumin mRNA both here and in a previous report (17). However, these techniques work best with highly abundant mRNAs, and even with these its long exposure times may be necessary to visualize some decay intermediates. In this report we introduce ligation-mediated PCR for the rapid and precise mapping of in vivo mRNA decay intermediates. The advantages offered by LM-PCR include its ease of implementation, scalability, and ability to identify degradation intermediates from even rare mRNAs such as c-myc. Although LM-PCR and primer extension were used in this study to confirm the involvement of PMR-1 in the in vivo endonucleolytic degradation of albumin mRNA, by definition, LM-PCR cannot distinguish between the 3′-end of a decay product generated by endonuclease cleavage versus a pausing site for a 3′-5′-exonuclease. That being said, Shyu and coworkers3 (Department of Biochemistry and Molecular Biology, University of Texas Medical Center, Houston, TX) were unable to demonstrate in vivo exonuclease pausing at poly(G) tracts as has been observed by Parker and coworkers for yeast mRNA decay (27). This leads us to conclude that the decay intermediates identified here, particularly for c-myc mRNA, are the products of endonuclease cleavage.
Previous work from our laboratory identified PMR-1 as an estrogen-induced endonuclease whose activity appeared on polysomes coincident with the estrogen-induced destabilization of albumin and other serum protein mRNAs (14). Using antibodies to PMR-1 we recently found that this mRNA endonuclease resides on polysomes in a latent form that can be released with EDTA as part of a >670-kDa mRNP complex.2 Estrogen induces a 22-fold increase in unit activity of polysome-bound PMR-1, which is accompanied by the coordinate disappearance of both albumin mRNA and PMR-1 from polysomes.2 The identification of estrogen-induced in vivo decay intermediates in Figs. 3 and 4 corresponding to products of PMR-1 cleavage lends considerable support to a central role for PMR-1 in catalyzing the destabilization of albumin mRNA.
We recently demonstrated that vitellogenin mRNA, which is induced and stabilized by estrogen, contains two APyrUGA elements in the 3′-UTR that are cleaved by PMR-1. The vitellogenin mRNA 3′-UTR is bound by vigilin, a 155-kDa estrogen-induced multi-KH domain protein (28), and this binding inhibits in vitro cleavage by PMR-1 (25). High affinity binding by vigilin requires a relatively unstructured target sequence, and although albumin mRNA region A contains the same APyrUGA PMR-1 cleavage sites as the vitellogenin mRNA 3′-UTR, vigilin binds poorly to this highly structured sequence and is unable to protect it from PMR-1 cleavage. Results presented here show significantly greater in vitro and in vivo cleavage within the paired APyrUGA sites in the single-stranded loop of albumin mRNA region A than within the same paired element in a hairpin structure in region G. Together these data point to the interplay between primary sequence and secondary structure of an mRNA target both for determining susceptibility to cleavage by an mRNA endonuclease and for mRNA stabilization resulting from protein binding to these sites.
Finally, we examined the degradation of c-myc mRNA as a proof of principle for the applicability of the LM-PCR approach to the identification of in vivo mRNA decay intermediates. The experiment in Fig. 8 focused on the coding region determinant in c-myc mRNA that has been extensively characterized in vitro by Ross and coworkers as a site for ribosome pausing, endonuclease cleavage, and protection from cleavage by the binding of a KH-domain protein (8, 18, 29, 30), but whose cleavage in vivo had yet to be demonstrated. Our results identified degradation intermediates in this region, one of which (site 4) corresponds to the major site for in vitro cleavage by a polysome-associated endonuclease (8). These results lend further validity to the use of in vitro systems for analyzing the biochemistry of mRNA decay and underscore the general applicability of LM-PCR to the identification of in vivo decay intermediates.
Acknowledgments
We thank Elena Chernokalskaya for her help with the primer extension experiments in this study.
Footnotes
This work was supported by Grant GM38277 from NIGMS, National Institutes of Health.
The abbreviations used are: PMR-1, polysomal ribonuclease 1; RT-PCR, reverse transcription-polymerase chain reaction; LM-PCR, ligation-mediated PCR; MEL cells, murine erythroleukemia cells; DTT, dithiothreitol; BSA, bovine serum albumin; nt, nucleotide(s); UTR, untranslated repeat; DEPC, diethylpyrocarbonate; KH, hnRNPK homology; mRNP, messenger ribonucleoprotein.
Cunningham, K. S., Hanson, M. N., and Schoenberg, D. R. (2001) Nucleic Acids Res. 29, 1156–1162.
A.-B. Shyu, personal communication.
References
- 1.Jacobson A, Peltz SW. Annu Rev Biochem. 1996;65:693–739. doi: 10.1146/annurev.bi.65.070196.003401. [DOI] [PubMed] [Google Scholar]
- 2.Gingras AC, Raught B, Sonenberg N. Annu Rev Biochem. 1999;68:913–963. doi: 10.1146/annurev.biochem.68.1.913. [DOI] [PubMed] [Google Scholar]
- 3.Imataka H, Gradi A, Sonenberg N. EMBO J. 1998;17:7480–7489. doi: 10.1093/emboj/17.24.7480. [DOI] [PMC free article] [PubMed] [Google Scholar]
- 4.Ross J. Microbiol Rev. 1995;59:423–450. doi: 10.1128/mr.59.3.423-450.1995. [DOI] [PMC free article] [PubMed] [Google Scholar]
- 5.Schoenberg DR, Chernokalskaya E. In: mRNA Metabolism and Post-transcriptional Gene Regulation. Harford J, Morris DR, editors. Wiley; New York: 1997. pp. 217–240. [Google Scholar]
- 6.Tharun S, Parker R. In: mRNA Metabolism and Post-transcriptional Gene Regulation. Harford J, Morris DR, editors. Wiley; New York: 1997. pp. 181–200. [Google Scholar]
- 7.Binder R, Hwang SP, Ratnasabapathy R, Williams DL. J Biol Chem. 1989;264:16910–16918. [PubMed] [Google Scholar]
- 8.Lee CH, Leeds P, Ross J. J Biol Chem. 1998;273:25261–25271. doi: 10.1074/jbc.273.39.25261. [DOI] [PubMed] [Google Scholar]
- 9.Binder R, Horowitz JA, Basilion JP, Koeller DM, Klausner RD, Harford JB. EMBO J. 1994;13:1969–1980. doi: 10.1002/j.1460-2075.1994.tb06466.x. [DOI] [PMC free article] [PubMed] [Google Scholar]
- 10.van Dijk EL, Sussenbach JS, Holthuizen PE. RNA (N Y) 1998;4:1632–1635. doi: 10.1017/s1355838298981316. [DOI] [PMC free article] [PubMed] [Google Scholar]
- 11.Wang Z, Kiledjian M. EMBO J. 2000;19:295–305. doi: 10.1093/emboj/19.2.295. [DOI] [PMC free article] [PubMed] [Google Scholar]
- 12.Pastori RL, Moskaitis JE, Buzek SW, Schoenberg DR. Mol Endocrinol. 1991;5:461–468. doi: 10.1210/mend-5-4-461. [DOI] [PubMed] [Google Scholar]
- 13.Nielsen DA, Shapiro DJ. Mol Cell Biol. 1990;10:371–376. doi: 10.1128/mcb.10.1.371. [DOI] [PMC free article] [PubMed] [Google Scholar]
- 14.Pastori RL, Moskaitis JE, Schoenberg DR. Biochemistry. 1991;30:10490–10498. doi: 10.1021/bi00107a018. [DOI] [PubMed] [Google Scholar]
- 15.Chernokalskaya E, DuBell AN, Cunningham KS, Hanson MN, Dompenciel RE, Schoenberg DR. RNA (N Y) 1998;4:1537–1548. doi: 10.1017/s1355838298980451. [DOI] [PMC free article] [PubMed] [Google Scholar]
- 16.van Dijk EL, Sussenbach JS, Holthuizen PE. J Mol Biol. 2000;300:449–467. doi: 10.1006/jmbi.2000.3856. [DOI] [PubMed] [Google Scholar]
- 17.Schoenberg DR, Cunningham KS. Methods. 1999;17:60–73. doi: 10.1006/meth.1998.0708. [DOI] [PubMed] [Google Scholar]
- 18.Doyle GAR, Betz NA, Leeds PF, Fleisig AJ, Prokipcak RD, Ross J. Nucleic Acids Res. 1998;26:5036–5044. doi: 10.1093/nar/26.22.5036. [DOI] [PMC free article] [PubMed] [Google Scholar]
- 19.Jo H, Zhang H, Zhang R, Liang P. Methods. 1998;16:365–372. doi: 10.1006/meth.1998.0691. [DOI] [PubMed] [Google Scholar]
- 20.Dompenciel RE, Garnepudi VR, Schoenberg DR. J Biol Chem. 1995;270:6108–6118. doi: 10.1074/jbc.270.11.6108. [DOI] [PubMed] [Google Scholar]
- 21.Cunningham KS, Hanson MN, Schoenberg DR. In: Ribonuclease. Nicholson AW, editor. Academic Press; New York: 2001. in press. [Google Scholar]
- 22.Mathews DH, Sabina J, Zuker M, Turner DH. J Mol Biol. 1999;288:911–940. doi: 10.1006/jmbi.1999.2700. [DOI] [PubMed] [Google Scholar]
- 23.Chernokalskaya E, Dompenciel RE, Schoenberg DR. Nucleic Acids Res. 1997;25:735–742. doi: 10.1093/nar/25.4.735. [DOI] [PMC free article] [PubMed] [Google Scholar]
- 24.Rao MN, Chernokalskaya E, Schoenberg DR. Nucleic Acids Res. 1996;24:4078–4083. doi: 10.1093/nar/24.20.4078. [DOI] [PMC free article] [PubMed] [Google Scholar]
- 25.Cunningham KS, Dodson RE, Nagel MA, Shapiro DJ, Schoenberg DR. Proc Natl Acad Sci U S A. 2000;97:12498–12502. doi: 10.1073/pnas.220425497. [DOI] [PMC free article] [PubMed] [Google Scholar]
- 26.Bernstein PL, Herrick DJ, Prokipcak RD, Ross J. Genes Dev. 1992;6:642–654. doi: 10.1101/gad.6.4.642. [DOI] [PubMed] [Google Scholar]
- 27.Decker CJ, Parker R. Genes Dev. 1993;7:1632–1643. doi: 10.1101/gad.7.8.1632. [DOI] [PubMed] [Google Scholar]
- 28.Dodson RE, Shapiro DJ. J Biol Chem. 1997;272:12249–12252. doi: 10.1074/jbc.272.19.12249. [DOI] [PubMed] [Google Scholar]
- 29.Prokipcak RD, Herrick DJ, Ross J. J Biol Chem. 1994;269:9261–9269. [PubMed] [Google Scholar]
- 30.Leeds P, Kren BT, Boylan JM, Betz NA, Steer CJ, Gruppuso PA, Ross J. Oncogene. 1997;14:1279–1286. doi: 10.1038/sj.onc.1201093. [DOI] [PubMed] [Google Scholar]