

Abstract
Potentiometric sensors based on polymer membrane electrodes, if properly optimized, are useful for measurements at trace levels. The expected independence of the electrochemical signal of the sample size makes them extremely attractive for measurements in small volumes. Here, we report on electrodes for the potentiometric detection of cadmium ions that reach a detection limit of 6 nM and utilize a Na+-selective electrode as pseudoreference in order to facilitate measurements in 150-μL samples. A potentiometric immunoassay of mouse IgG is performed via CdSe quantum dot labels on a secondary antibody according to a sandwich immunoassay protocol in a microtiter plate format. The CdSe quantum dots are found to be easily dissolved/oxidized in a matter of minutes with hydrogen peroxide, allowing us to maintain the pH at a near-neutral value. The potentiometric protein immunoassay exhibits a log–linear response ranging from 0.15 to 4.0 pmol of IgG, with a detection limit of <10 fmol in 150-μL sample wells.
Nanoparticle-based electrochemical protein immunoassays typically employ stripping voltammetric techniques as the readout principle.1–6 Upon completion of the protein binding event with a secondary antibody labeled with gold nanoparticles or semiconductor quantum dots, the tracers are detected electrochemically. This may be achieved after an oxidation/dissolution step with reagents such as nitric acid7 or directly with solid-state chrono-potentiometry.8 Alternatively, enzyme labels, known as highly effective biological amplifiers, can be used, for example, in a magnetic collection on interdigitated electrodes.9 Recently, carbon nanotubes decorated with multiple enzymes were also used as labels for an even greater chemical amplification of the immunobinding event.10
Stripping voltammetric techniques exhibit extremely low lower detection limits in terms of concentration. The measurement of trace level concentrations in microliter or submicroliter volumes has been achieved with nanoband electrodes. In 500-nL sample droplets, the lowest detected concentrations were 0.5 ppb lead with high-amplitude square wave voltammetry,11 while the injection of 1.4-μL samples of tear fluid made it possible to measure 6.5 ppb cadmium with anodic stripping voltammetry,12 both with mercury film electrodes. In these two examples, the detected total amounts of material were on the order of 2.5 × 10⁻¹³ and 6.5 × 10⁻¹³ g of lead and cadmium, respectively. More recent efforts aimed at further reducing the detection volume down to 1 nL, but the lowest detected amount of material was somewhat inferior at 7.5 × 10⁻¹² g.13
Potentiometry with ion-selective electrodes (ISEs) is attractive for trace level analysis in confined samples. There exists a direct relationship between sample activity and observed electromotive force, independent of the volume of the sample or electrode surface. Indeed, ion-selective microelectrodes have been used for the detection of millimolar concentrations in single cells having volumes on the order of 1 pL.14 In recent years, polymer membrane potentiometric sensors have reached ultratrace level detection limits on the order of nanomolar or lower concentrations.15,16 This was achieved by understanding and minimizing undesired zero current ion fluxes from the membrane toward the sample, which have traditionally tainted the electrode response. With micropipet-based ISEs, it was recently found that the lower detection limit can be approximately maintained in confined sample volumes.17 The detection of 10−10 M Ag+, Pb2+, and Ca2+ was demonstrated in ultrasmall volumes of 3 μL, resulting in a detectability of 300 amol.17
Potentiometric immunoassays have been explored by only a limited number of researchers. Rechnitz and co-workers introduced gas-sensing probes in conjunction with NH3-producing deamination enzymes such as asparaginase as labels18 or with the CO2 production from β-ketoadipic acid by chloroperoxidase enzyme-labeled IgG antibody.19 Others used an I−-selective electrode to monitor the extent of oxidation of I− by H2O2 produced by a peroxidase label.20 More recently, Koncki and coworkers used a F−-selective electrode for monitoring the release of F− from the substrate monofluorophosphate, catalyzed by the alkaline phosphatase label.21 Meyerhoff’s group explored polycation-selective electrodes to monitor immunoreactions in a competitive homogeneous assay format.22
The recent progress with ISEs described above forms the basis for the application of potentiometric sensors in ultrasensitive bioanalysis using chemical amplification steps. Recently, we reported on the detection of proteins in a potentiometric immunoassay with gold nanoparticle labels that were chemically plated with silver.23 The chemically dissolved silver ions were subsequently detected by potentiometry. Here, we explore the detection of Cd2+ with a Cd2+-selective micropipet electrode in a more convenient format, utilizing commercially available CdSe semiconductor quantum dots as labels for protein immunoassays without any further chemical enhancement step, and using microtiter plates as a readout platform. The detection limit is lower by ~3 orders of magnitude than reported previously.23
EXPERIMENTAL SECTION
Reagents, Membranes, and Electrodes
See Supporting Information.
Emf Measurements
Potential measurements were performed with a 24-bit emf measuring interface (EMF-16, Lawson Labs, Malvern, PA) with 1 reference and 16 measuring channels in a Faraday cage. Measurements in conventional 100-mL samples were performed at ambient temperature using a commercial reference electrode (Metrohm, No. 6.0729.100, Metrohm, CH-9101 Herisau) with a 1 M NH4NO3 electrolyte. Sample pH values were determined with a pH glass electrode (No. 6.0133.100, Metrohm). The samples contained an ionic background of 10 μM NaNO3 and were magnetically stirred. At least three electrodes of the same membrane composition were used.
Measurements in microwells were performed with a Na+-selective micropipet electrode as pseudoreference electrode, again keeping a 10 μM NaNO3 background in the sample. Samples were stirred with a small stirring bar. Prior to measurement, each well was cleaned in the following order: 300 μL of 1 M HNO3 for 15min (on shaker), three washing steps with H2O, 300 μL of 1% BSA for 2 h (on shaker), three washing steps with H2O, 300 μL of 10−5 M Cd(NO3)2 + 10−5 M NaNO3, again followed by three washing steps with H2O.
Selectivity coefficients were determined with the modified separate solutions method24,25 with ISEs that had been conditioned in NaNO3 solutions. Emf measurements were carried out in separate solutions of 10−2, 10−3, and 10−4 M nitrate salts of the ions of interest following the order of the most discriminated to the most preferred ion.
Immunoassay
Sandwich immunoassays were performed according to standard protocols26 on commercial ELISA plates (Immuno Module F8 Maxisorp Loose, No. 469949, Nunc, Roskilde, Denmark), which were cleaned as described above. Each well was then coated with 100 μL of capture antibody (7 μg/mL) in blocking buffer (PBS at pH 7.4 with 1% BSA) for 12 h at 4 °C, followed by three washing steps with wash buffer (TRIS-HCl at pH 7.4 with 0.05% Tween 20). Then, 300 μL of blocking buffer was applied for 2 h on the shaker, again followed by three washing steps with wash buffer. Incubation with antigen was performed with 100 μL of antigen solution in blocking buffer for 2 h on the shaker, followed by three washing steps with wash buffer. Negative controls were done without antigen in the blocking buffer. Secondary antibodies were incubated by adding 100 μL of quantum dot conjugate (25 pmol/mL) in blocking buffer for 2 h on the shaker, followed by three washing steps with wash buffer and five washing steps with H2O. The final measuring step was performed after incubating 150 μL of a 3% H2O2 solution in 10−5 M NaNO3 for 15 min on the shaker. All steps were performed at room temperature. Washing solutions were incubated for 30 s and removed by gently tapping the inverted plate on clean tissue paper. Solutions of capture antibody, secondary antibody, and concentration standards of IgG were freshly prepared before measurements.
RESULTS AND DISCUSSION
We have developed micropipet-based Cd2+-selective electrodes suitable for trace measurements of Cd2+ concentrations in 150-μL microwells (see Figure 1). Detection limits of ~10−10 M Cd2+ were achieved with macroelectrodes and large sample volumes.27 The following potentiometric selectivity coefficients, log KCd,jpot, were determined for the relevant cations: −6.57 (Na+), −5.91 (H+), and −10.17 (Zn2+). High selectivity for Na+ is required because it is chosen here as the background ion in conjunction with a Na+-selective electrode as pseudoreference. Since H3O+ are present in every aqueous sample, they may also worsen the detection limit if selectivity is limited. Moreover, Zn2+ will be a byproduct of dissolving the CdSe nanocrystals because they contain a ZnS capping.
Figure 1.
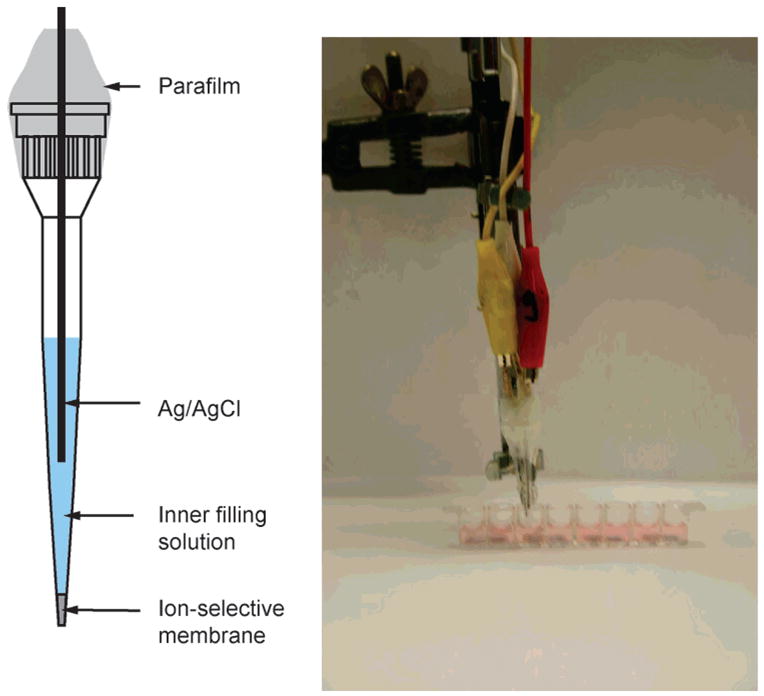
Left: Design of Cd2+-selective micropipet electrodes. Right: Experimental assembly for potentiometric microtiter plate measurement.
Initial calibration curves in untreated 150-μL microwells resulted in a much poorer lower detection limit than that observed in conventional 100-mL samples. A pretreatment protocol was developed (see Experimental Section), and as illustrated in Figure 2, the resulting calibration curves exhibited a detection limit of ~5.6 × 10⁻⁸ M Cd2+. This is still less than that with macroscopic samples, which must be due to working with microtiter plates, since much better detection limits have been obtained in samples of 3-μL volume with similar ISEs.17
Figure 2.
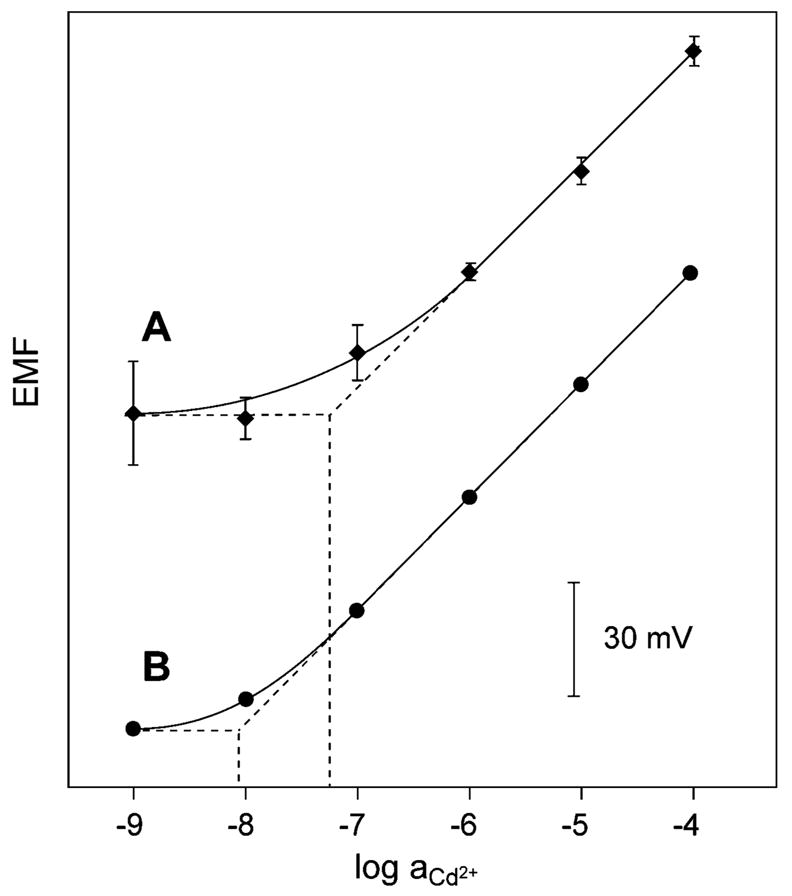
Calibration curves of Cd2+-selective micropipet electrodes in (A) in 150-μL microwells used in the final bioassay and (B) in large, 100-mL sample volumes. Horizontal dotted lines: lower detection limit according to IUPAC definition. Error bars are 90% confidence intervals in different microwells of the same composition, N = 8.
The basis for the immunoassay reported here is the potentiometric detection of Cd2+ released from the CdSe nanocrystal labels after completion of the sandwich assay. Conventionally, such quantum dots are effectively oxidized with HNO3 at pH ~0.7 The high concentration of H3O+ would, however, largely interfere with the potentiometric detection of Cd2+, leading to unacceptably high detection limits of >10−6 M Cd2+. Therefore, H2O2 was used for the oxidation of CdSe quantum dots. Figure 3 shows the potentiometric response of the Cd2+-selective electrode immersed in 150-μL wells containing different concentrations of H2O2. The emf gradually increases upon addition of CdSe quantum dots and gives final potential readings after ~20 min when 3% H2O2 is used. Note that increasing concentrations of H2O2 only accelerate the kinetics of dissolution. The potentials before adding the quantum dots and after reaching the dissolution equilibrium are independent of the concentration of the oxidant, suggesting that no direct chemical interference by H2O2 takes place. A calibration curve for Cd2+ in a 3% H2O2 background using 150-μL wells gave a detection limit just below 10−7 M. The dissolution experiments were also used to estimate the number of cadmium ions per quantum dot nanocrystal as ~500, which is in reasonable agreement with the stated molar mass of the CdSe core of 200 μg/nmol corresponding to ~1000 Cd2+/quantum dot.
Figure 3.
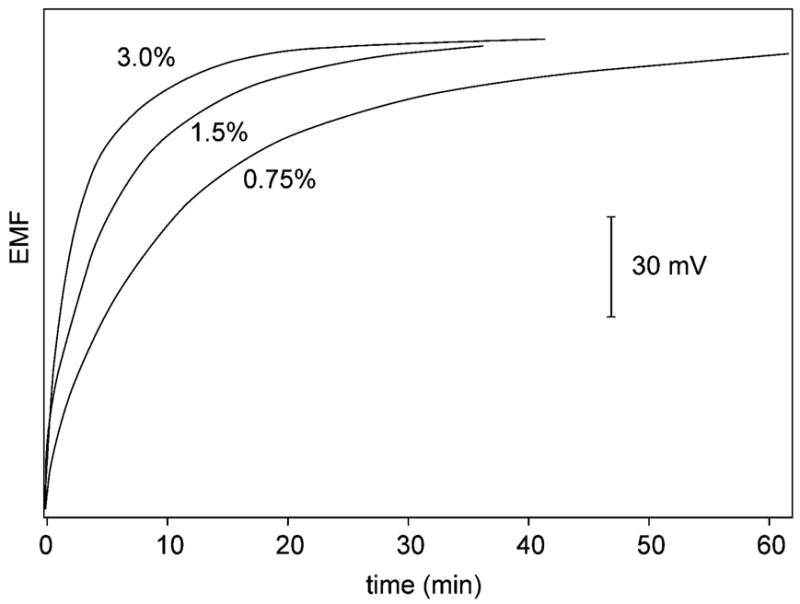
Time response for the Cd2+-ISE in a 150-μL sample well, containing the indicated H2O2 concentrations (v/v %), upon addition of 0.18 pmol of quantum dot conjugate.
A standard protocol26 was adapted for the potentiometric immunoassay (Figure 4). The capture antibody was immobilized on the microwell plate by incubation in a blocking buffer containing BSA. After another blocking step, anti-mouse IgG antigen was incubated, followed by binding with a secondary antibody having a CdSe nanoparticle label. The quantum dots were dissolved with H2O2, and the response of the Cd2+-selective electrode was recorded after 15 min. Experiments with a corresponding colorimetric enzymatic immunoassay showed a similar behavior of the two assays at higher concentrations, suggesting that the upper detection limit is determined by saturation of the captured antibody in the microwell.
Figure 4.
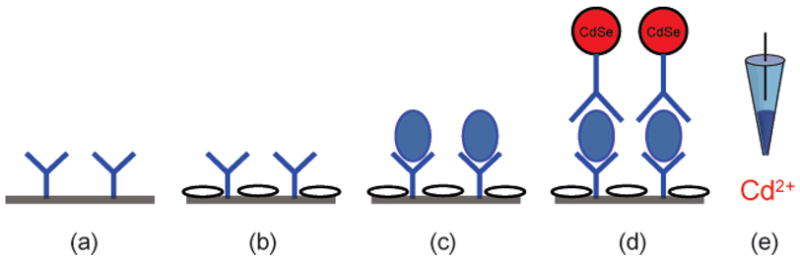
Immunoassay protocol used in this study. (a) Antibody is immobilized on a microwell plate, (b) the plate is blocked with BSA, (c) anti-mouse IgG antigen is incubated, (d) the secondary antibody with CdSe nanoparticle labels is bound, and (e) the label is dissolved with H2O2 and the released Cd2+ is detected with the Cd2+-ISE.
The potentiometric response in a typical series of immunoassays with varying concentrations of anti-mouse IgG antigen is shown in Figure 5. Based on the precision of potentiometric measurements in the applied microtiter plates (Figure 2), the error at log(IgG [μg mL−1] ) −1 (corresponding to ~10−6 M Cd2+) can be estimated as (0.15 logarithmic units. The dynamic range of the assay is somewhat larger than 2 orders of magnitude. The lower detection limit is better than 10−2 μg mL−1 or <10 fmol of anti-mouse IgG. A recently introduced potentiometric immunoassay based on Au nanoparticles and Ag labeling exhibited lower detection limits that were higher by ~3 orders of magnitude than the one presented here.23 An advantage of the semiconductor nanocrystal tags used here is that the label is not generated in situ as with silver-plated Au nanoparticles, and therefore, nonspecific labeling is less likely. Figure 5 shows that the control containing only BSA as nontarget protein gives a background signal that is lower by several orders of magnitude than with the previously reported protocol.
Figure 5.
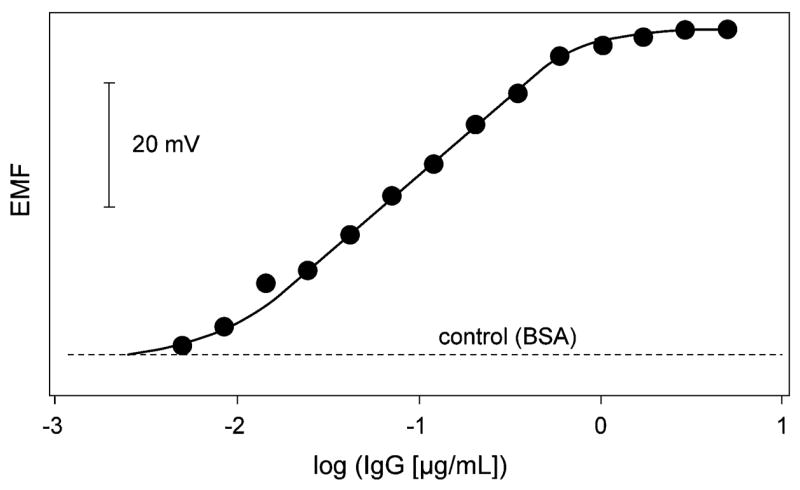
Potentiometric monitoring of IgG concentrations via CdSe quantum dot labels in 150-μL microvials with the sandwich immunoassay (cf. Figure 4). Dotted line: Signal obtained with BSA instead of target protein (shown as control).
Using stripping voltammery, a lower detection limit of 3.3 fmol of Cd2+ has been achieved with a related CdS quantum dot based assay.2 This indicates that the current bioassay is already quite close to the state of the art achieved with the best available electrochemical techniques. Further improvements of the lower detection limit are expected by using much smaller sample volumes (e.g., 3 μL instead of 150 μL),17 ISEs with even better lower detection limits (10−10 M instead of ~10−8 M is feasible),17 and/or larger quantum dots.
CONCLUSIONS
We demonstrated the potentiometric bioanalysis of proteins in a microtiter plate format with semiconductor nanocrystal labels and <10-fmol detection limits. This was achieved with Cd2+-selective micropipet electrodes that were optimized to exhibit attractive detection limits in confined sample volumes. The lower detection limit in terms of concentration appears to be dictated by the selectivity of the immunoassay, while the upper detection limit was found to be given by the available binding sites in each microvial. It is anticipated that further reduction of the final detection volume will improve the lower detection limit of such potentiometric bioassays in terms of total analyte mass to an even larger extent.
Acknowledgments
The authors are grateful for the National Institutes of Health (EB002189) and The Swiss National Science Foundation for financial support of this research. We thank Dr. D. Wegmann for careful reading of the manuscript.
Footnotes
SUPPORTING INFORMATION AVAILABLE
Additional information as noted in text. This material is available free of charge via the Internet at http://pubs.acs.org.
References
- 1.Deqaire M, Degrand C, Limoges B. Anal Chem. 2000;72:5521–5528. doi: 10.1021/ac000781m. [DOI] [PubMed] [Google Scholar]
- 2.Liu G, Wang J, Kim J, Jan MR. Anal Chem. 2004;76:7126–7130. doi: 10.1021/ac049107l. [DOI] [PubMed] [Google Scholar]
- 3.Liao KT, Huang HJ. Anal Chim Acta. 2005;538:159–164. [Google Scholar]
- 4.Chu X, Fu X, Chen K, Shen GL, Yu RQ. Biosens Bioelectron. 2005;20:1805–1812. doi: 10.1016/j.bios.2004.07.012. [DOI] [PubMed] [Google Scholar]
- 5.Wang J. Analyst. 2005;130:421–426. doi: 10.1039/b414248a. [DOI] [PubMed] [Google Scholar]
- 6.Wang J. Stripping Analysis. VCH; New York: 1985. [Google Scholar]
- 7.Authier L, Grossiord C, Brossier P, Limoges B. Anal Chem. 2001;73:4450–4456. doi: 10.1021/ac0103221. [DOI] [PubMed] [Google Scholar]
- 8.Wang J, Xu D, Polsky R. J Am Chem Soc. 2002;124:4208–4209. doi: 10.1021/ja0255709. [DOI] [PubMed] [Google Scholar]
- 9.Thomas JH, Kim SK, Hesketh PJ, Halsall HB, Heineman WR. Anal Chem. 2004;76:2700–2707. doi: 10.1021/ac035503c. [DOI] [PubMed] [Google Scholar]
- 10.Wang J, Liu G, Jan MR. J Am Chem Soc. 2004;126:3010–3011. doi: 10.1021/ja031723w. [DOI] [PubMed] [Google Scholar]
- 11.Wang J, Rongrong X, Baomin T, Wang J, Renschler CL, White CA. Anal Chim Acta. 1994;293:43–48. [Google Scholar]
- 12.Matysik FM, Werner G. Analyst. 1993;118:1523–1526. doi: 10.1039/an9931801523. [DOI] [PubMed] [Google Scholar]
- 13.Vandaveer WR, Fritsch I. Anal Chem. 2002;74:3575–3578. doi: 10.1021/ac011036s. [DOI] [PubMed] [Google Scholar]
- 14.Ammann D. Ion-Selective Microelectrodes. Springer-Verlag; Berlin: 1986. [Google Scholar]
- 15.Bakker E, Pretsch E. Anal Chem. 2002;74:420A–426A. doi: 10.1016/j.trac.2006.10.006. [DOI] [PMC free article] [PubMed] [Google Scholar]
- 16.Bakker E, Pretsch E. Trends Anal Chem. 2005;24:199–207. doi: 10.1016/j.trac.2005.01.003. [DOI] [PMC free article] [PubMed] [Google Scholar]
- 17.Malon A, Vigassy T, Bakker E, Pretsch E. J Am Chem Soc. 2006;128:8154–8155. doi: 10.1021/ja0625780. [DOI] [PMC free article] [PubMed] [Google Scholar]
- 18.Gebauer CR, Rechnitz GA. Anal Biochem. 1982;124:338–348. doi: 10.1016/0003-2697(82)90049-5. [DOI] [PubMed] [Google Scholar]
- 19.Fonong T, Rechnitz GA. Anal Chem. 1984;56:2586–2590. doi: 10.1021/ac00277a070. [DOI] [PubMed] [Google Scholar]
- 20.Boitieux JL, Lemay C, Desmet G, Thomas D. Clin Chim Acta. 1981;113:175–182. doi: 10.1016/0009-8981(81)90151-0. [DOI] [PubMed] [Google Scholar]
- 21.Konicki R, Rudnicka K, Tymecki L. Anal Chim Acta. 2006;577:134–139. doi: 10.1016/j.aca.2006.05.100. [DOI] [PubMed] [Google Scholar]
- 22.Sheng D, Meyerhoff ME. Electroanalysis. 2001;13:276–283. [Google Scholar]
- 23.Chumbimuni-Torres KY, Zong D, Rubinova N, Xiang Y, Pretsch E, Wang J, Bakker E. J Am Chem Soc. 2006;128:13673–13677. doi: 10.1021/ja065899k. [DOI] [PMC free article] [PubMed] [Google Scholar]
- 24.Bakker E. Anal Chem. 1997;69:1061–1069. [Google Scholar]
- 25.Bakker E, Pretsch E, Bühlmann P. Anal Chem. 2000;72:1127–1133. doi: 10.1021/ac991146n. [DOI] [PubMed] [Google Scholar]
- 26.Wild DJ. The Immunoassay Handbook. Elsevier; Amsterdam: 2005. [Google Scholar]
- 27.Ion AC, Bakker E, Pretsch E. Anal Chim Acta. 2001;440:71–79. [Google Scholar]; 2002;452:329. [Google Scholar]