

Abstract
We have shown that Wnt5A increases the motility of melanoma cells. To explore cellular pathways involving Wnt5A, we compared gain-of-function (WNT5A stable transfectants) versus loss-of-function (siRNA knockdown) of WNT5A by microarray analysis. Increasing WNT5A suppressed the expression of several genes, which were re-expressed after small interference RNA-mediated knockdown of WNT5A. Genes affected by WNT5A include KISS-1, a metastasis suppressor, and CD44, involved in tumor cell homing during metastasis. This could be validated at the protein level using both small interference RNA and recombinant Wnt5A (rWnt5A). Among the genes up-regulated by WNT5A was the gene vimentin, associated with an epithelial to mesenchymal transition (EMT), which involves decreases in E-cadherin, due to up-regulation of the transcriptional repressor, Snail. rWnt5A treatment increases Snail and vimentin expression, and decreases E-cadherin, even in the presence of dominant-negativeTCF4, suggesting that this activation is independent of Wnt/β-catenin signaling. Because Wnt5A can signal via protein kinase C (PKC), the role of PKC in Wnt5A-mediated motility and EMT was also assessed using PKC inhibition and activation studies. Treating cells expressing low levels of Wnt5A with phorbol ester increased Snail expression inhibiting PKC in cells expressing high levels of Wnt5A decreased Snail. Furthermore, inhibition of PKC before Wnt5A treatment blocked Snail expression, implying that Wnt5A can potentiate melanoma metastasis via the induction of EMT in a PKC-dependent manner.
The molecular mechanisms that govern the motility and metastasis of melanoma cells are not well understood. The prognosis for patients with recurrent melanoma has shown no improvement over the past 50 years. Many of these tumors are histopathologically quite similar but can be subclassified based upon their gene expression profiles (1, 2). In a study by Bittner et al. (1), the gene that best separated highly aggressive tumors from less aggressive tumors was WNT5A, which was consistently underexpressed in the less motile tumors. Wnt5A is a member of the Wnt family of proteins, which were first identified during studies of development in Drosophila (3) and in studies of the mouse mammary tumor virus (4). Unlike its family members Wnt1 and Wnt3A, which signal via the canonical Wnt pathway, resulting in the nuclear translocation of β-catenin, Wnt5A acts via G-protein-coupled receptors to activate protein kinase C (PKC)6 and intracellular calcium (5, 6). The interplay between these two pathways is not well understood, but it does appear that the non-canonical Wnt pathway can inhibit β-catenin stabilization both in vitro in human HEK293 cells and in vivo in zebrafish (7, 8).
In melanoma cells with low motility and low expression of WNT5A, overexpressing WNT5A resulted in an increase in both the activation of PKC and an increase in motility (9). High expression of WNT5A in melanoma patients also correlated to poor outcome in this study. In addition, many studies have highlighted the importance of G-protein-mediated signaling and the resultant activation of PKC and increases in intracellular calcium, in melanoma progression (10-12). Serial analysis of gene expression in melanoma samples has also confirmed this observation, and specifically, genes involved in the Wnt signaling pathway are also expressed in these libraries, including WNT10A, FRIZZLED7, and junction plakoglobin (13).
To further explore our previous results concerning the effects of Wnt5A and PKC on melanoma cells, as well as to better dissect the mechanisms by which Wnt5A might be affecting motility in melanoma, we used siRNA technology to knock down WNT5A expression, and then assayed gene expression changes using microarray analysis. We subsequently validated these results using a combination of recombinant Wnt5A and WNT5A siRNA treatments, as well as PKC activation and inhibition studies. This approach allows us to identify a subset of genes specifically affected by Wnt5A signaling and provides us with insights as to how Wnt5A is mediating motility in melanoma cells.
EXPERIMENTAL PROCEDURES
Cell Lines
The human melanoma cell line UACC1273, and its subclones UACC-1273EV, UACC1273-4-3, and UACC12734-7, as well the cell lines UACC647, M93-047, and UACC-903, were cultured in RPMI 1640 medium, and G361 cells were cultured in McCoy’s 5A medium. All media was supplemented with 10% fetal bovine serum (HyClone, Logan, UT), 100 units/ml penicillin G, and 100 units of streptomycin. All cell cultures were incubated at 37 °C in 5% CO2/95% air, and the medium was replaced every second day.
Transfections and Treatments
siRNA was designed using Qiagen online design tools, which designs 21-nucleotide siRNA according to the Tuschl rules of siRNA design. Three siRNAs were designed as described in the text and purchased from Qiagen in both rhodamine-tagged and untagged forms. Rhodamine-tagged and untagged control siRNAs were also purchased from Qiagen. These siRNAs were transfected into cells (60–70% confluency) using Lipofectamine Plus (Invitrogen). Cells were allowed to reach 60–70% confluency within 48 h of seeding. After 6 h of transfection, the medium was replaced with fresh serum-containing medium. Transfection efficiencies are usually upwards of 90% for siRNA oligonucleotides as gauged by transfection with rhodamine-tagged siRNAs. For confocal microscopy the rhodamine-tagged siRNAs were diluted 1:3 with untagged siRNAs so that the fluorescence would not be overwhelming. For the dominant negative TCF4 vector (a generous gift from Dr. Bert Vogelstein, Sidney Kimmel Comprehensive Cancer Center, Johns Hopkins Medical Institutes, Baltimore, MD), transfection efficiencies are usually around 75%, as gauged by simultaneous GFP transfection. Interestingly, transfection efficiency is highly dependent on melanoma cell confluency, and cell densities higher than 80% result in inefficient transfection. These data are available from the authors upon request. For recombinant Wnt5A treatments, recombinant Wnt5A was obtained from R&D systems, and reconstituted in sterile phosphate-buffered saline containing 0.1% bovine serum albumin to a stock concentration of 10 μg/ml. After testing a range of concentrations, and time points, a concentration of 0.1–0.2 μg/ml for 12–16 h in serum-free medium was decided upon, because by 24 h the recombinant protein starts to lose activity in the media. According to the R&D Systems measurements, which assess Wnt5A activity by its ability to inhibit Wnt3A activity, Wnt3A activity is 5 times higher than that of Wnt5A, thus cells were treated at a concentration 0.04 μg/ml for the same time points. For PKC inhibition studies, a range of times, concentrations, and inhibitors was tested, and ultimately, Gö6983 (a specific inhibitor of PKC α, β, γ, δ, and ζ, but not μ) and GF 109203X (inhibitor of PKC α, β, δ, and ϵ) were used in an attempt to use two different inhibitors of the conventional PKC pathway, at concentrations of 1 μm each. Cells were either pre-treated with the inhibitor for 1 h for Western analysis, or 12 h for wound healing assays, then treated with recombinant Wnt5A as described above, in the continuing presence of inhibitor, or treated with inhibitor alone for the indicated times. For PKC activation studies, phorbol ester, specifically, 4β-phorbol-12-myristate-13-acetate (PMA) was used at 200 nm. For vehicle controls, cells were treated with equivalent amounts of Me2SO.
Wound Healing Assays
Wound healing assays were performed by plating cells in plates coated with fibronectin or collagen IV. After cells were allowed to attach and reach confluency, a scratch was made through the confluent monolayer using a sterile pipette tip. Photographs of cells invading the scratch were taken at the indicated time points. All cell lines were assayed in triplicate, in each experiment, and each experiment was repeated three times.
Microarray Analysis
RNA was extracted from cells in culture and concentrated to 3.6 μg/μl using a Micron-100, and a total of 50 μg was used for array analysis. RNA was bound to anchored oligonucleotide-deoxythymidine for 5 min at 75 °C, and cooled to 42 °C. Oligonucleotides and Cy dyes were added, as well as reverse transcriptase, and the reaction was carried out for 1 h. Samples were hydrolyzed with 0.5 m EDTA and 1 m NaOH for 15 min at 65 °C. NaOH was neutralized using an equal volume of 1 m HCl, and then the probe was purified by running it through the Qiagen PCR purification kit, according to the manufacturer’s protocol, with the exception of the addition of a 35% guanidium-HCl wash prior to the PE buffer wash step. Cy-3 probes and Cy-5 probes were combined at this point and dried in a lyophilizer. Dried probes were resuspended in Agilent hybridization buffer according to the manufacturer’s protocol and applied to the microarray slides overnight. The slides used were customized Agilent cDNA arrays. After hybridization, slides were washed for 2 min in 0.1× SSC, 0.1% SDS at room temperature with a final rinse in 0.05× SSC at room temperature. Fluorescence images were obtained using an Agilent DNA microarray scanner, and images were analyzed using IPLAB microarray suite. Gene intensities were background subtracted (taking the mean of channel intensities and median of background). After normalization, ratios of red to green intensity were used to generate a multidimensional scaling diagram and perform gene selection among classes, based on linear discriminant analysis, as previously described (1). To evaluate the probability of a given gene achieving a significant weight by chance, a random permutation test using 1000 permutations was used to generate an empirical significance threshold for comparison with the calculated p value for each gene. These analyses were performed using the NHGRI, NIH in-house suite of web-based array analysis tools.
Western Blotting
Sources of antibody and concentrations used are as follows: Phospho-Pan-PKC antibody (1:1,000), Phospho-CaMKII antibody (1:500), CaMKII antibody (1:500), and β-catenin antibody (1:1,000) were obtained from Cell Signaling Technology (Danvers, MA). Wnt5A antibody (1:100) was obtained from R&D Biosystems (Minneapolis, MN). KISS1 antibody (1:100), Snail antibody (1:100), and Tubulin antibody (1:2,000) were obtained from Abcam Inc. (Cambridge, MA). E-Cadherin antibody (1:1,000) and antibodies to non-phosphorylated PKC isoforms were obtained from BD Biosciences (San Jose, CA). Cells were grown to 80% confluency and then harvested on ice using cell lysis buffer (20 mm Tris, pH 7.5, 150 mm NaCl, 1 mm EDTA, 1% Triton X-100, 1× protease inhibitor mixture (Roche Applied Science), and 1 mm sodium orthovana-date). Cells were Dounce-homogenized and centrifuged at 10,000 × g for 10 min. The supernatant was quantitated using the Pierce BCA protein quantitation assay. 50 μg of each lysate was run out on SDS-PAGE 10% Tris-glycine NuPAGE gels and transferred onto 0.2-μm nitrocellulose. The membranes were probed with antibodies and then visualized using the ECL system (Amersham Biosciences).
Phosphatase Assays
Protein lysates were subjected to SDS-PAGE electrophoresis as described above, and transferred on to polyvinylidene difluoride membrane. Samples were run in duplicate sets on a single gel, and the polyvinylidene difluoride membrane was cut into two. One-half of the membrane (one set of samples) was incubated in buffer (0.1 mm Tris·Cl, pH 8.5, 0.2 mm EDTA) containing alkaline phosphatase (20 units/ml), according to the protocol described by Maya et al. (16), and both membranes were blocked and probed with antibody against PKC α, β, or γ or CAMKII as described above.
Gelatin Zymography
The activity of MMP-2 in the culture medium of cells was assessed using gelatin zymography. Cells were plated at equal density in 10-centimeter tissue culture dishes and allowed to grow to ~60% confluency, at which point they were either treated with PMA or PKC inhibitor (Gö6983 or GF 109203X) in serum-free, phenol red-free medium. Medium was concentrated using Centriplus YM-10 columns (Millipore, Billerica, MA), and the protein concentration was determined using the BCA protein assay kit (Pierce). 30 μg of protein was separated in non-reducing conditions on a 10% zymogram gel containing 0.1% gelatin (Invitrogen). After electrophoresis, gels were incubated in zymogram-renaturing buffer at room temperature for 30 min to remove the SDS followed by a 24- to 48-h incubation at 37 °C in the zymogram developing buffer (Invitrogen). Gels were then stained for 2 h in 30% methanol, 10% glacial acetic acid, and 0.25% Coomassie Blue and destained for 4 h in 10% methanol/10% glacial acetic acid. Clear bands appear on the Coomassie-stained blue background in the areas of gelatinolytic activity. Experiments were repeated with at least four independent sets of culture medium.
Real-time PCR Analysis
Primers were designed for use with the PerkinElmer Life Sciences 5700 system. Primers were designed to generate products of less than 200 bp, for efficient analysis and are listed as follows: vimentin, forward 5′-ATTCCACTTTGCGTTCAAGG-3′; reverse 5′-CTTCAGAGAGAGGAAGCCGA-3′; SNAIL, forward 5′-AGGTTGGAGCGGTCAGC-3′, reverse 5′-CCTTCTCTAGGCCCTGGCT-3′. cDNA was transcribed from 1 μg of total RNA, according to the manufacturer’s protocol (Applied Biosystems, Foster City, CA), and 200 ng of this cDNA was used in the real-time reverse transcription-PCR reaction. Samples were normalized against the 18 S gene, using universal 18 S primers (Ambion, Austin, TX) and the ratio of signal to 18 S, and the -fold increase as compared with melanocyte controls was calculated using the calculation 2−ΔΔCT according to the manufacturer’s protocol (PerkinElmer Life Sciences).
Immunofluorescence
Cells were grown on glass slides and allowed to reach 80% confluency (note that transfections were performed at 60% confluency, as mentioned before). They were then fixed using 95% methanol and washed in phosphate-buffered saline. Nuclei were permeabilized by incubating the cells in 0.1% Triton X-100 in phosphate-buffered saline (pH 7.4, calcium and magnesium free) for 10 min. Slides were washed and then blocked with immunofluorescence blocking buffer (0.2% Triton X-100, 3% bovine serum albumin, 0.2% casein, 0.2% gelatin, 0.02% sodium azide) for 1 h, followed by an overnight at 4 °C incubation. Primary antibodies used include: vimentin (1:50, Abcam Inc.), Snail (1:100, Abcam Inc.), E-cadherin (1:50, BD Biosciences), and CD44 and MMP-2 (1:50, R&D Systems). The cells were washed again with phosphate-buffered saline for 30 min. They were then probed with Alexafluor 488 and 594 secondary antibodies (Molecular Probes, Eugene, OR), washed, mounted in Prolong gold anti-fade (Molecular Probes), and examined under fluorescence and imaged using a Zeiss LSM 510 Meta confocal microscope (Thornwood, NY). CD44 experiments were imaged using a light microscope (Zeiss Axiovert 200).
RESULTS
siRNA sequences were analyzed using the BLAST data base to ensure that they would specifically target Wnt5A, and sequences from three different regions of the gene were synthesized (Fig. 1A). The efficacy of each of these siRNA sequences was first tested using Western analysis for Wnt5A in an endogenously high Wnt5A melanoma line, M93-047 (Fig. 1B). The most efficient sequence, A2, was also used to decrease Wnt5A in a melanoma cell line that had been stably transfected with WNT5A (UACC1273-4-7), and both M93-047 cells, and the UACC1273-4-7 cells were stained for expression of the Wnt5A protein, using immunofluorescent detection (Fig. 1c). Finally, cells were transfected with Wnt5A-A2 siRNA for 24 and 48 h and then subjected to a wound healing assay. Both M93-047 and UACC903 melanoma cells (with endogenously high Wnt5A levels), whether untreated, or transfected with a control siRNA were able to close a wound by 12 and 24 h, respectively. However, cells treated with Wnt5A-A2 siRNA had not yet closed a scratch wound in this time, confirming that WNT5A knockdown resulted in a decrease in melanoma cell motility (Fig. 1D).
FIGURE 1. Suppression of Wnt5A by siRNA.
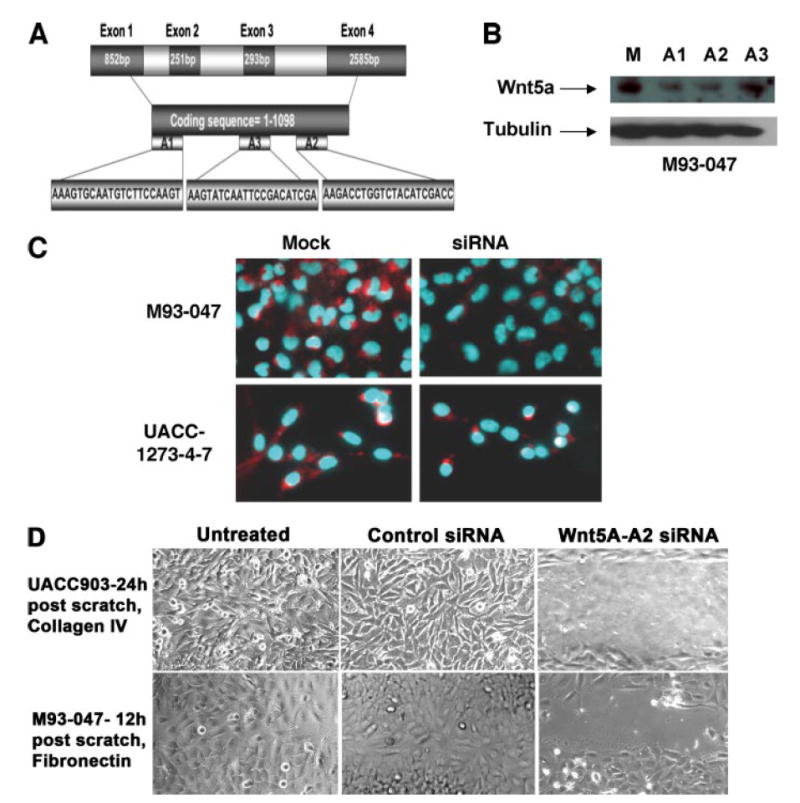
A, siRNA was designed from three different regions of the coding sequence: The 5′-end (A1) and the 3′-end (A2) and the middle (A3). B, efficacy of knockdown of Wnt5A was analyzed by immunoblotting for Wnt5A in M93-047 cells that endogenously express high levels of Wnt5A. Cells were either mock-treated (M) or treated with 150 nm of the indicated siRNA sequences for 48 h. Sequences A1 and A2 result in the most significant knockdown of Wnt5A. C, immunofluorescence indicates that the sequence A2 is able to knock down Wnt5A in the M93-047 cells, as well as in UACC-1273-4-7 cells, which are stably transfected with a Wnt5A plasmid under the control of a cytomegalovirus promoter. D, inhibition of Wnt5A with siRNA reduces motility of UACC903 and M93-047 cells in a wound healing assay.
Because Wnt5A has been shown to increase the phosphorylation of PKC (9), all three sequences were tested for their ability to inhibit PKC phosphorylation. We have previously shown that the PKC isoforms affected by Wnt5A are predominantly PKCα, -β, and -γ (9), and their phosphorylation status can be assessed using a Pan-PO4-PKC antibody (Cell Signaling). All three siRNAs were independently transfected into either empty vector-transfected melanoma cells (UACC1273EV), endogenously low in Wnt5A (Wnt5Alow) or into the same parental cells stably transfected with WNT5A (UACC1273-4-7). The A2 sequence was the most efficient at inhibiting PKC phosphorylation in the WNT5A transfectants (Wnt5Atfx), without affecting the Wnt5Alow cells dramatically (Fig. 2A). M93-047 cells (Wnt5Ahigh) also showed significant decreases in the amount of phosphorylated PKC when treated with WNT5A siRNA-A2 (Fig. 2A). To further ascertain deactivation of PKC, we investigated whether PKC translocated from its active site at the membrane of the cell, upon inhibition of Wnt5A. To perform this experiment, we examined the conventional PKC, PKCβII. Cells were transiently transfected with a GFP-tagged PKCβII vector and rhodamine-tagged control siRNA and examined using confocal microscopy. M93-047 cells with endogenously high Wnt5A (Wnt5Ahigh) showed PKCβII expression predominantly at the membrane (Fig. 2B). Some cells did exhibit cytoplasmic staining, but this accounted for only ~20% of the transfected cells. When cells were transfected with GFP-PKCβII and rhodamine-tagged siRNA-A2 (Wnt5A-A2Rh) against Wnt5A (Fig. 2c), GFP-PKCβII moved from the membrane into the cytoplasm. Although the vast majority of cells had cytoplasmic staining, again a small percentage (in this case around 10%) of cells had both cytoplasmic and membrane staining. Levels of total PKC (Fig. 2D, PKC all) were unaffected by WNT5A siRNA, when using a mixture of PKC isoform antibodies (BD Biosciences). However, when using a mix of antibodies against only the isoforms affected by Wnt5A, α, β, and γ, we observed that levels of these isoforms increased dramatically (Fig. 2D, PKCα, -β, and -γ), whereas levels of the phosphorylated protein decreased. The same observation was made when we examined the expression and phosphorylation status of calmodulin-dependent kinase II (CAMKII), a kinase known to be activated due to Ca2+ release upon Wnt5A binding (14). Activation of CAMKII is dependent upon phosphorylation at the Thr286 residue (15). Levels of phospho-Thr286 CAMKII were significantly decreased by the Wnt5A-A2 siRNA, whereas levels of non-phosphorylated CAMKII increased (Fig. 2E). As with the PKC antibodies, it was unclear whether this was due to an inability of the antibody to recognize both the phosphorylated and non-phosphorylated form, or if this result truly represented an increase in the total pool of PKC and CAMKII. To determine this, we employed a protocol described by Maya et al. (16), to dephosphorylate proteins that have already been transferred to polyvinylidene difluoride membrane. Upon treatment with phosphatase, bands of equal intensity could be detected in all lanes by the antibodies against PKCα, -β, and -γ, contrary to what we had observed in un-phosphatased samples (Fig. 2D, PKCα,β,γ+PPase). For CAMKII, incubation in phosphatase buffer appeared to significantly affect the background on the blot, making it harder to definitively determine, but it also appeared that this antibody could possibly be sensitive, as we observed an increase in CAMKII in the untreated samples, something we had previously not observed (Fig. 2E, CAMKII+PPase). This indicates that these antibodies, at least PKC antibodies, recognize phosphorylation-sensitive epitopes. Regardless, Wnt5A inhibition corresponds to a decrease in PKC activity as demonstrated both by antibodies against the phosphorylated proteins and by confocal microscopy.
FIGURE 2. PKC is deactivated by Wnt5A inhibition.
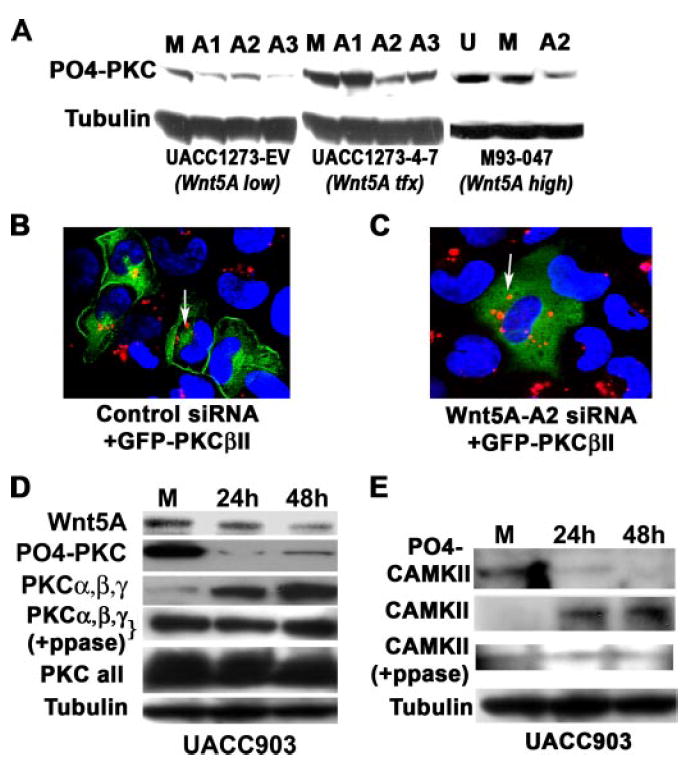
A, the knockdown of WNT5A also results in the dephosphorylation of PKC, indicating a loss of activity. The sequence A2 was the most effective at decreasing PO4-PKC in the Wnt5A stably transfected cells (UACC1273 4-) and is also extremely effective the M93-047 endogenous Wnt5A-expressing cells, without significantly affecting PO4-PKC in the empty vector control cells (UACC1273-EV). B, siRNA against WNT5A deactivates PKC, causing a translocation from the membrane to the cytoplasm. Melanoma cells with high Wnt5A were transfected with GFP-tagged PKC and a control rhodamine-tagged siRNA. In these cells, the PKC is largely membrane-bound as indicated by confocal microscopy (left panel). C, when these cells are co-transfected with GFP-PKC and rhodamine-tagged WNT5A siRNA, the PKC moves away from the membrane and into the cytoplasm (right panel), indicating its de-activation, presumably as a result the observed de-phosphorylation of PKC. D, WNT5A siRNA decreases phospho-PKC (PO4-PKC), but increases non-phosphorylated PKCα, -β, and -γ overtime (PKCα,β,γ). Phosphatase treatment unmasks epitopes that antibodies against total PKC PKCα, -β, and -γ, cannot otherwise recognize, indicating Wnt5A does not have significant effects on the total pool of PKCα, -β, and -γ (PKCα,β,γ +PPase). When using antibodies to all the isoforms of PKC, levels appear to be equal, because Wnt5A does not affect all isoforms, and many migrate at the same size on a gel. E, knockdown of WNT5A using siRNA also results in a decrease in PO4-CAMKII (active), with an increase in non-phosphorylated CAMKII (inactive). Although not as definitive as the PKCα, -β, and -γ data, due to high background on the Westerns, post-phosphatase treatment, the same may also be true of antibody against CAMKII (CAMKII +PPase).
We have previously demonstrated the ability of Wnt5A to increase PKC activation, and melanoma cell motility, and have also shown that inhibition of Wnt signaling results in a decrease in melanoma cell migration (9). Recently we have also demonstrated that manipulating PKC levels in melanoma cells can affect the levels of other proteins, namely claudin-1 and MMP-2 (17), which in turn can also affect the migratory capacity of melanoma cells. Here we provide additional pieces of data to demonstrate that PKC itself can act to increase the migratory capacity of melanoma cells. To demonstrate this, we inhibited PKC in Wnt5Ahigh cells, as measured by the decrease in PO4-PKC (Fig. 3A). Unlike the situation with WNT5A knockdown, where there was an inversely correlated increase in non-phosphorylated PKC along with decreases in PO4-PKC, both PO4-PKC and non-phosphorylated PKC were decreased when treating with the inhibitors, implying that the inhibitors were working to affect the expression levels of PKC. We (17), and others (18), have previously demonstrated that MMP-2 is critical for the migration of melanoma cells and show here that inhibition of PKC in these cells also inhibited the secretion of MMP-2, as determined by gelatin zymography (Fig. 3A, white bands on dark background). Additionally, inhibiting PKC prior to inflicting a scratch wound on Wnt5Ahigh cells resulted in a marked decrease in the ability of these cells to close a scratch wound (Fig. 3B).
FIGURE 3. PKC signaling is involved in melanoma cell motility.
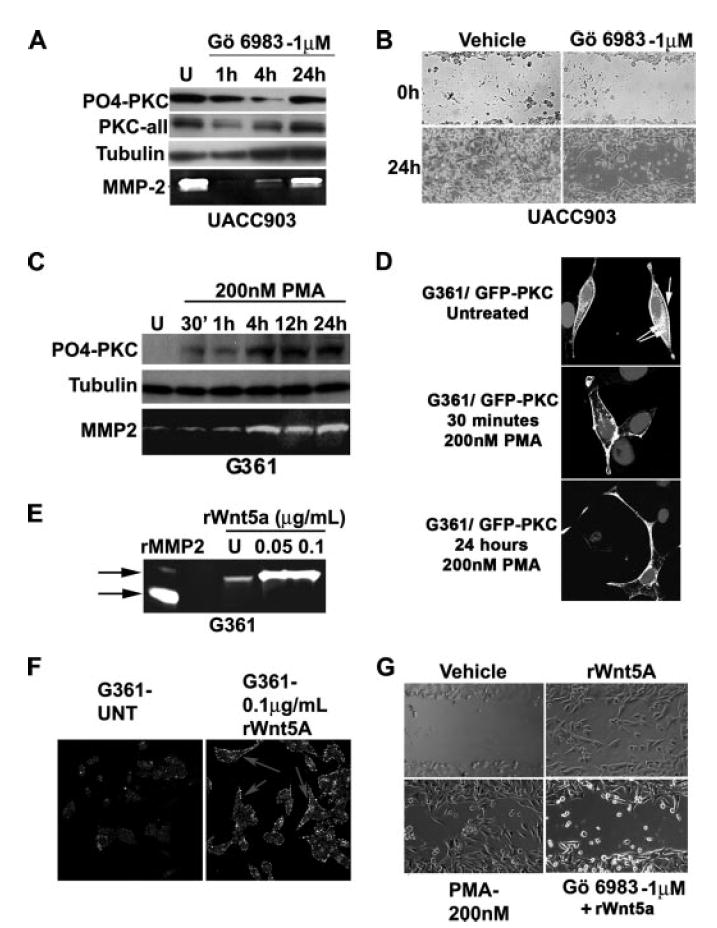
A, highly invasive UACC903 cells were treated with GÖ6983, an inhibitor of PKC. Decreases in both phospho-PKC and total PKC occur by 4 h, corresponding to a decrease in MMP-2 secretion, a marker of melanoma metastasis. B, pre-treatment of UACC903 cells with GÖ6983 results in a decrease in the ability of cells to close a wound in a wound healing assay. C, prolonged treatment of G361 (low invasion and low Wnt5A) with 200 nm PMA (phorbol ester) results in a sustained increase in phosphorylated PKC, even as long as 24 h. MMP-2 secretion is also increase upon PMA treatment. D, this can be confirmed using confocal microscopy. A GFP-tagged PKCβII vector was transfected into G361 cells, and cells were treated with PMA for 30 min or 24 h. Cytoplasmic (double arrow) and membrane (single arrow) PKCs are visible in the untreated cells, but PKC is predominantly membrane-bound at both the early and late time points post-PMA treatment. E, treatment of cells with recombinant Wnt5A also increases the levels of MMP-2 as determined both by gelatin zymography, and in F immunofluorescent analysis of cell associated MMP-2. G, both PMA and rWnt5A increased motility of melanoma cells, but pretreatment of cells with GÖ6983 prohibited rWnt5A from affecting motility of these cells.
Next, we looked at the effects of PKC activation in our Wnt5Alow cells. An interesting point should be addressed here: Many studies have indicated that long term activation of PKC can result in a depletion of PKC. It has been our experience that, upon treatment with low concentrations of PMA (200 nm), levels of PO4-PKC fluctuate dramatically for the first 30 min to 1 h, first increasing, then decreasing, and finally stabilizing by 4–12 h, where they can remain elevated for up to 24 h depending on the cell line (Fig. 3C), at which point the PMA requires replenishment in the medium. When looking at total PKC, as well as PO4-PKC in our melanoma cells, we found that this too increased steadily up to 24 h (see Fig. 5C). This implies that, like the inhibitors, PMA acts on the expression levels of PKC as well as its activation, and that contrary to some studies, at least in our cells, long term PKC activation does not result in PKC depletion. To assess this in another manner and to visually determine the effects of phorbol ester on PKC activation, we also transfected our Wnt5Alow cells with the PKC-GFPβII vector and then subjected them to PMA treatment (200 nm) at different time points, fixed the slides, and imaged the results using confocal microscopy (Fig. 3D). PMA caused translocation of GFP-PKCβII to the membrane at early time points such as 30 min, but at time points as late as 24 h, much of the protein still remained at the membrane. In untreated cells, the protein was present both in the cytoplasm and at the membrane.
FIGURE 5. Wnt5A regulates Kiss-1 and CD44.
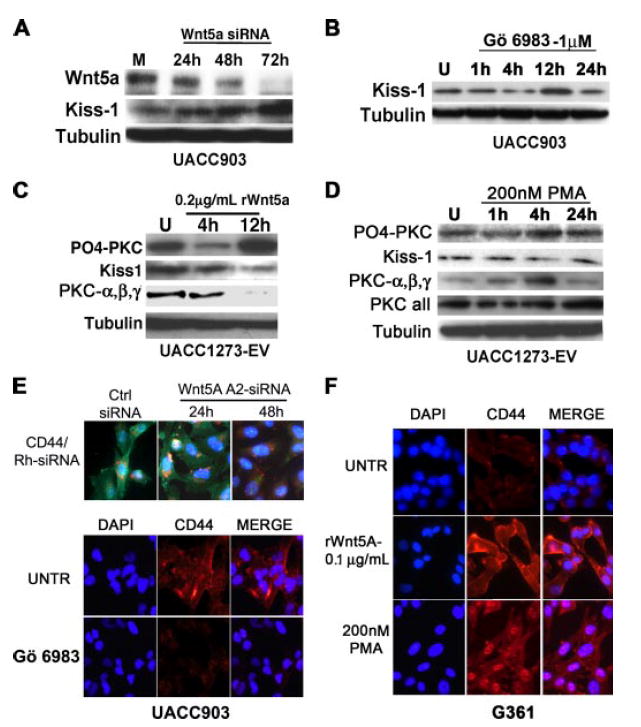
A, UACC903 cells were treated with 150 nm siRNA against Wnt5A for the indicated amounts of time. Wnt5A knockdown commenced as early as 24 h, and was maximal by 72 h. There is a corresponding increase in Kiss-1 protein, as Wnt5A is knocked down. B, this can be mimicked by inhibiting PKC, such that Kiss-1 is reconstituted after 12 h of PKC inhibition. C, conversely, treatment of UACC1273EVcells with recombinant Wnt5A (rWnt5A) results in an increase in PO4-PKC, indicating that Wnt5A signaling is taking place, and this corresponds to a decrease in Kiss-1 expression. As with WNT5A siRNA experiments, there is an anti-correlation between the levels of PO4-PKC and the non-phosphorylated PKCα, -β, and -γ. D, treatment with PMA also results in a decrease in Kiss-1 expression by 4h. E, WNT5A siRNA (rhodamine-tagged, red flecks) treatment of UACC903 cells causes a decrease in CD44 expression (green staining) by 48 h (upper panels), but there is no appreciable decrease at 24 h. Treatment with PKC inhibitors also decreases CD44 expression (lower panels, red staining). F, treatment of Wnt5A-low G361 cells with rWnt5A results in a dramatic increase in CD44 expression, as does treatment with 200 nm PMA.
Increases in PKC activation correlated to an increase in MMP-2 secretion (Fig. 3C), which can again be mimicked by treatment with recombinant Wnt5A both by zymography (Fig. 3E) and by imaging of the cell-associated MMP-2, which was increased upon rWnt5A treatment (Fig. 3F). Accordingly, when we treated Wnt5Alow cells with rWnt5A, there was a dramatic increase in the ability of these cells to invade into a scratch wound (Fig. 3G, rWnt5A). When Wnt5Alow cells were treated for 24 h with PMA, there was a similar increase in the ability of these cells to invade into a scratch wound (Fig. 3G, PMA). Inhibiting PKC in Wnt5Alow cells prior to adding rWnt5A prohibited the ability of rWnt5A to increase melanoma cell motility, indicating that Wnt5A-mediated effects on motility are dependent upon PKC signaling (Fig. 3G, GÖ6983). These data, in tandem with the data from the previous figure, support our previous observations that Wnt5A is an important mediator of PKC activation in melanoma cells, which in turn is an important mediator of metastasis.
To determine a time point at which WNT5A siRNA knockdown was maximal, and was also having continued effects on the expression of downstream targets such as PKC, we treated cells with siRNA against WNT5A for 24, 48, and 72 h. We found that, upon siRNA treatment, Wnt5A expression and PKC activity were decreased as early as 24 h (Figs. 1 and 2). We chose 24 h as our optimal treatment time for our subsequent microarray analysis, because it was the least amount of time necessary for inhibition of the downstream signaling, even though the loss of Wnt5A was maximal at 48 h. The experiment was set up using melanoma cell lines stably transfected with Wnt5A. For this experiment we used two different subcloned lines, UACC1273-4-3, and UACC1273-4-7, which overexpressed WNT5A, as well as an empty vector control, UACC1273-EV. These lines had been established in the melanoma cell line UACC1273, a line with no Wnt5A, and low motility, and have been previously described (9). These cell lines were treated in three different ways: either cotransfected with WNT5A-A2-Rh siRNA, transfected with mock conditions for 24 h, or left untreated. RNA was extracted, and array analysis was performed on customized cDNA array chips from Agilent Technologies using the Cy3/Cy5 direct labeling method (see “Experimental Procedures” for details). All samples were hybridized against the parental UACC1273 cell line as a reference. Images were analyzed using the IPLab array suite, and data were extracted. The overall relationship between the samples was visualized using multidimensional scaling analysis as previously described (1) (Fig. 4A), and we found that the global gene expression profiles of the two WNT5A-overexpressing clones, whether mock treated, or untreated, were remarkably similar to each other, but not to the empty vector control. Similarly, these WNT5A overexpressers, when treated with the WNT5A-A2 siRNA, clustered tightly together, but away from the other groups in the data set, indicating that WNT5A knockdown had some very specific effects, which were consistent in the two WNT5A transfectants. We then performed distance-based gene selection to determine which genes best distinguished the siRNA-treated WNT5A overexpressers from their control or mock treated counterparts, and also from empty vector controls, and generated a weighted gene list (Fig. 4B, and detailed list in supplementary Fig. S1). At the very top of this weighted gene list, i.e. the gene which was the best discriminator between the data sets, was the gene WNT5A, and it is clear that this gene is highly expressed in the WNT5A transfectants, and is knocked down by siRNA, as expected. Remarkably, the majority of the top 200 significant genes were down-regulated in response to increased WNT5A expression, and this down-regulation, for the most part, could be reversed by siRNA knockdown of WNT5A. These down-regulated genes included genes such as metastasis suppressors (e.g. KISS-1 and NM23), genes involved in pigmentation (e.g. HPS4 and DCT), and genes involved in chromatin regulation. The few genes up-regulated by WNT5A include genes such as CD44, a tumor-homing and metastasis antigen, integrins, and the intermediate filament protein vimentin. Interestingly, although the expression of genes suppressed by WNT5A could be reconstituted by WNT5A knockdown, many of the genes up-regulated by WNT5A overexpression, such as vimentin (but not CD44), could not be returned to lower baseline levels.
FIGURE 4. Microarray analysis of WNT5A-transfected and WNT5A siRNA-treated cells.
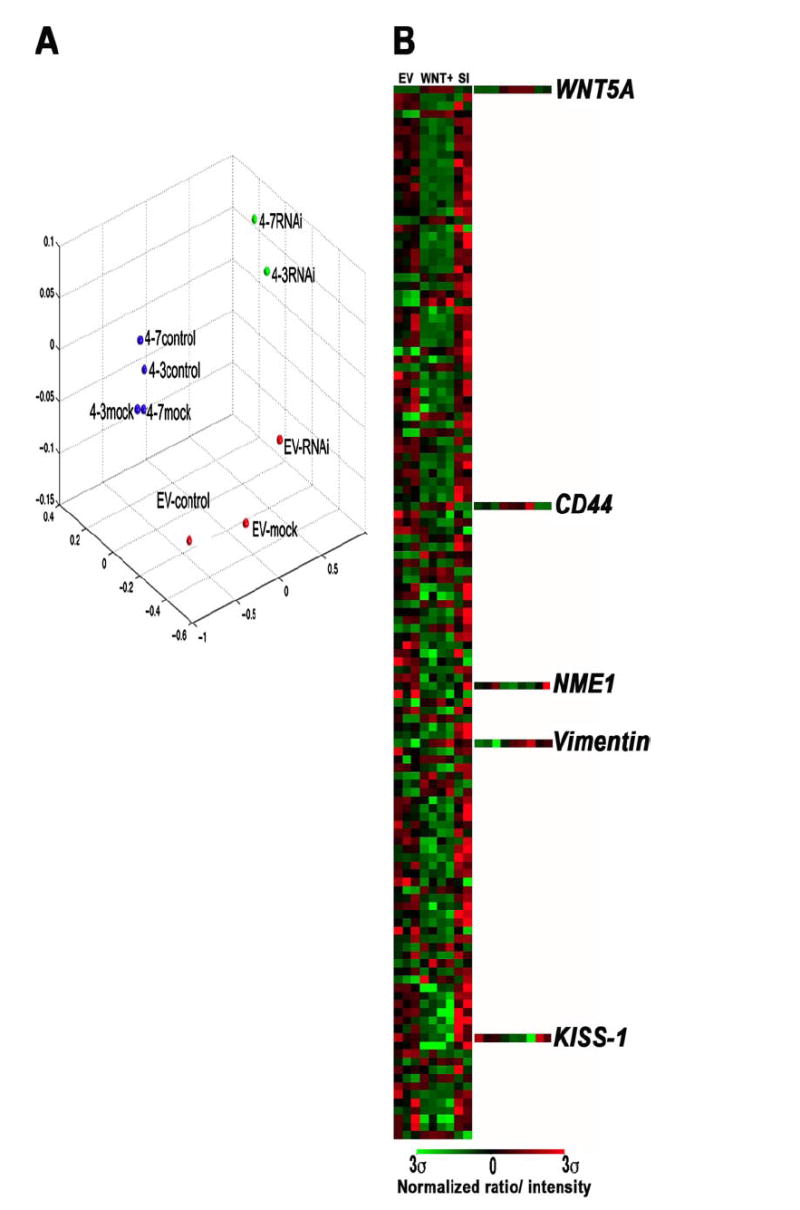
A, cells were stably transfected with WNT5A (4-3 and 4-7) or empty vector control (EV) as previously described. These stable lines were then either left untreated (control), or treated with mock siRNA (mock), or siRNA against WNT5A (siRNA). Microarray analysis was performed on these lines, and multidimensional scaling analysis revealed that mock or untreated cells clustered together, and siRNA treatment significantly changed the profiles of these cells. B, gene selection analysis shows that in the WNT5A transfectants that are either mock or untreated (Wnt+), many genes are down-regulated, and this down-regulation can be reversed by siRNA knockdown of WNT5A (SI). Of the up-regulated genes, WNT5A is at the top of the list (most significant), and CD44, a metastasis activator, and vimentin, involved in the epithelial to mesenchymal transition that often precedes metastasis are also on the list of the top 100 discriminating genes. Furthermore, high levels of WNT5A correlate to the loss of key metastasis suppressors such as KISS-1 and NME1.
The loss of expression of the metastasis suppressor KISS-1 has been implicated in the progression to a metastatic phenotype in melanoma (19) as well as other cancers (20-22). Array analysis indicated that the overexpression of WNT5A repressed the expression of KISS-1, and that this could be reconstituted by WNT5A knockdown (Fig. 4B, highlights). To validate and expand the array observations we performed Western analysis of the expression pattern of these proteins, using a time course of siRNA treatment from 24 to 72 h, on Wnt5A high UACC903 melanoma cells. Kiss-1 expression was significantly up-regulated upon inhibition of Wnt5A (Fig. 5A). To assess the correlation to PKC activity, PKC was inhibited using GÖ6983. PO4-PKC was maximally decreased at 4 h, and by 12 h Kiss-1 expression was restored (Fig. 5B). To approach this experiment from a different angle, we also used recombinant Wnt5A protein (rWnt5A). Our cells have previously been tested for their cohorts of Frizzled (Fzd) receptors, and Wnt proteins. UACC1273EV cells, as well G361 cells, are Wnt5Alow cells that express the receptors Fzd2 and Fzd5, which allow for binding and subsequent signaling by the Wnt5A protein. Recombinant Wnt5A protein was tested for efficacy of dose over a range of doses (between 0.05 and 1.0 μg/ml), over several time points (data not shown). The lowest dose that was able to induce PKC activity in UACC1273-EV cells, 0.2 μg/ml, was selected, and cells were consistently treated with this dose throughout our ensuing experiments. For G361 cells, the lowest dose able to activate PKC signaling was 0.1 μg/ml. Fig. 5C demonstrates the up-regulation of PO4-PKC by 12 h. As with siRNA treatment there is an inverse correlation between PO4-PKC and PKCα, -β, and -γ upon treatment with recombinant Wnt5A. It can also be observed that there is a decrease in PO4-PKC at 4 h, and when trying to optimize our Wnt5A treatment (concentrations and times), we consistently observed that, upon Wnt5A treatment, levels of PO4-PKC decreased at 4 h at several different concentrations of Wnt5A (data not shown). We believe that this could be due to the cells attempting to regulate their PKC levels after an initial spike in calcium and PKC and may be due to receptor internalization. These receptors are then likely recycled and made available again for signaling upon continued Wnt5A treatment. Having established that treatment with Wnt5A could activate the PKC signaling pathway, we then performed Western analysis for Kiss-1 expression, upon treatment with rWnt5A. UACC1273EV cells demonstrated a clear decrease in Kiss-1 after 12 h of rWnt5A treatment (Fig. 5C). These effects could be mimicked by treatment of the cells with phorbol ester where Kiss-1 decreased after 4 h of treatment with PMA (Fig. 5D). Of the few genes up-regulated, one of the most significant was the tumor-homing and metastasis antigen, CD44 (Fig. 4B, highlights). When Wnt5Ahigh UACC903 cells were treated with Wnt5A-A2 siRNA (Fig. 5E, Wnt5A-A2 siRNA), CD44 expression decreased significantly by 48 h. CD44 expression can also be decreased by PKC inhibition (Fig. 5E). In Wnt5Alow G361 cells, treatment with rWnt5A resulted in an increase in CD44 expression, as did treatment with 200 nm PMA (Fig. 5F). This is of great significance, considering the volumes of data implicating CD44 overexpression in melanoma metastasis (23-25).
In addition to up-regulating CD44, array analysis indicated that Wnt5A might also up-regulate vimentin expression, an intermediate filament protein involved, among other things, in the epithelial to mesenchymal transition (EMT) (26). The EMT is a key step in metastasis, accompanied by several changes in protein expression, including the up-regulation of vimentin, the up-regulation of the transcriptional repressor Snail, and the loss of E-cadherin (27), a key step toward metastasis in melanoma cells (28). Our previous data have shown that transfection of Wnt5A resulted in a change in morphology from a cuboidal (UACC1273EV) to a longer, spindle-like morphology, accompanied by changes in the actin cytoskeleton (9). The array data performed in the current investigation indicated that vimentin was up-regulated upon Wnt5A transfection (Fig. 4B). To confirm this observation, we treated G361 cells, and UACC1273EV cells (low invasion and low Wnt5A) with recombinant Wnt5A, and indeed observed a dramatic change from a more elliptical cell shape (G361) or a more cuboidal shape (UACC1273EV) to a longer spindle-like cell shape (Fig. 6A) similar to the WNT5A transfectants previously described (9). Analysis of a panel of melanoma metastases by real-time PCR indicated that vimentin as well as the transcriptional repressor Snail, are highly up-regulated in malignant melanoma as compared with melanocytes (Fig. 6B). We have previously demonstrated (9, 17) and show in Fig. 3 that, of the cell lines we have used in this report, two are less metastatic: they have low Wnt5A, take 48- 72 h to heal a scratch wound, and do not have high levels of secreted MMP-2, or any discernible active MMP-2 (UACC1273EV and G361). Two of the other cell lines we have used in this study (UACC903 and M93-047) can heal a wound in 12–24 h, have high levels of MMP-2, both secreted and active, and high Wnt5A, and are generally much more invasive. We compared the levels of Snail and vimentin in these cells using real-time PCR and compared the levels of all lines to that of the least metastatic line, UACC1273EV. The results demonstrate that both Snail (Fig. 6C) and vimentin (Fig. 6D) are up-regulated in the more metastatic lines UACC903 and M93-047. siRNA knockdown of Wnt5A in UACC903 Wnt5Ahigh cells resulted in a loss of expression of Snail (Fig. 6E). Although E-cadherin expression was also examined in this experiment, UACC903 cells exhibit a complete and irreversible loss of E-cadherin, which cannot be restored by Snail inhibition. However, treatment of Wnt5Alow UACC1273EV melanoma cells with the recombinant Wnt5A protein resulted not only in the dramatic increase of Snail expression by 12 h but was also accompanied by a loss of E-cadherin (Fig. 6F). These observations can also be confirmed by confocal immunofluorescent microscopy. G361 cells were treated with recombinant Wnt5A. Compared with untreated cells (Fig. 7A), Wnt5A-treated cells (Fig. 7B) had less E-cadherin (green staining), and more vimentin (red staining). Furthermore, staining of untreated G361 cells with E-cadherin (green) and Snail (red) showed abundant E-cadherin, and very little Snail (Fig. 7C). Twelve hours of treatment with Wnt5A caused a dramatic up-regulation of Snail and loss of E-cadherin (Fig. 7D). Cells were also stained with secondary antibody only as a negative control for nonspecific signal (Fig. 7E). These data strongly implicate Wnt5A as an effector of the epithelial to mesenchymal transition in melanoma cells via the up-regulation of Snail and down-regulation of E-cadherin.
FIGURE 6. Wnt5A mediates the epithelial to mesenchymal transition.

A, G361 and UACC1273EV cells that endogenously express low Wnt5A undergo elongation upon treatment with rWnt5A, indicative of an EMT. B, a panel of metastatic melanoma samples representing early passage lines, late passage lines, and tumor biopsies were analyzed for expression of vimentin and Snail. Both genes are up-regulated in the majority of samples as compared with normal human melanocytes (HEMN). C and D, when comparing melanoma cell lines with low metastatic ability to those with high metastatic ability, both Snail and vimentin are increased in more metastatic lines. E, treatment of Wnt5Ahigh UACC903 cells with siRNA against Wnt5A results in a decrease in Snail protein; conversely, F, there is an increase in Snail protein, and a decrease in E-cadherin upon treatment of Wnt5Alow UACC1273EV cells with recombinant Wnt5A protein for 12 h.
FIGURE 7. Wnt5A regulates Snail and E-cadherin.
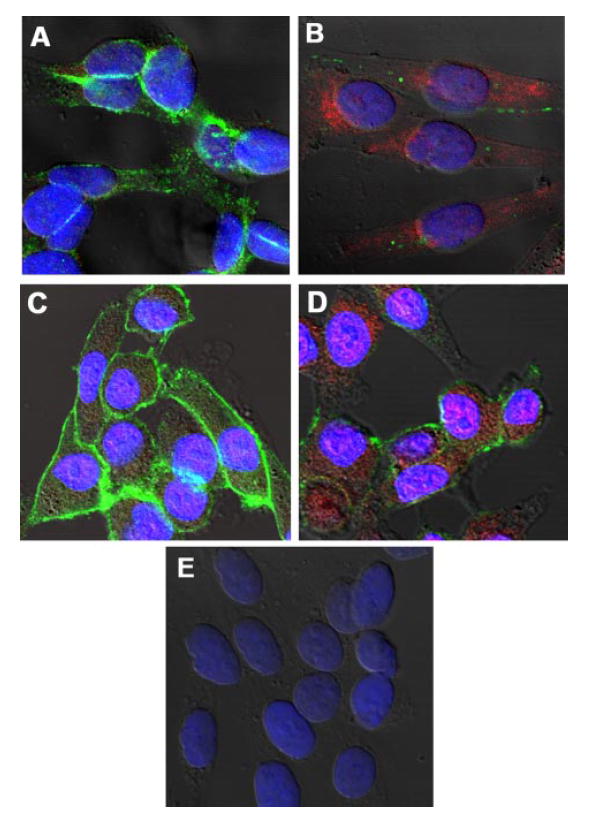
A, immunofluorescence shows that untreated G361 Wnt5Alow cells stain strongly for E-cadherin (green staining) but have no vimentin expression (red staining). B, by 12 h of rWnt5A (0.1 μg/ml) treatment, E-cadherin (green staining) is lost from the membrane and cytoplasm in the untreated cells, and vimentin is significantly up-regulated. C, E-cadherin (green staining) is abundant and Snail (red staining) is minimal in untreated G361 cells. D, treatment with rWnt5A for 12 h results in an increase in Snail expression and a decrease in E-cadherin. E, negative control cells incubated with secondary antibodies only.
Wnt5A has been shown to inhibit β-catenin, and we have previously shown that transfection of Wnt5A into UACC1273 cells does not increase β-catenin expression or nuclear translocation (9). We show here that treatment of melanoma cells with recombinant Wnt5A also does not affect expression levels of β-catenin, whereas Wnt3A, a classic canonical Wnt family member, significantly increases β-catenin as expected (Fig. 8A). In turn, Wnt3A did not increase levels of PO4-PKC, whereas Wnt5A did. The canonical Wnt pathway has been shown to increase Snail expression and mediate the EMT (29), so to determine if Wnt5A mediated up-regulation of Snail involved the β-catenin/TCF/LEF pathway, we used a dominant negative TCF4 plasmid that has previously been shown to inhibit canonical Wnt signaling (30). Treatment of our Wnt5Alow melanoma cells with both Wnt3A and Wnt5A resulted in an increase of Snail and a decrease in E-cadherin (Fig. 8B). In the presence of the dominant negative TCF4 plasmid, Wnt3A was unable to up-regulate Snail or suppress E-cadherin. Wnt5A on the other hand, was still able to up-regulate Snail, and suppress E-cadherin, even in the presence of dominant negative TCF4. Interestingly, dnTCF4 knockdown itself raised Snail levels slightly. We then examined the morphology of these cells using phase-contrast microscopy, and, consistent with the Western data, morphology of the Wnt5A-treated cells, regardless of whether dnTCF was present or not, changed dramatically to a longer spindle-like shape (Fig. 8C). These data suggest that Wnt5A up-regulation of Snail in melanoma cells does not involve canonical Wnt signaling.
FIGURE 8. Wnt5A requires PKC activity, but not β-catenin, to regulate Snail and E-cadherin.
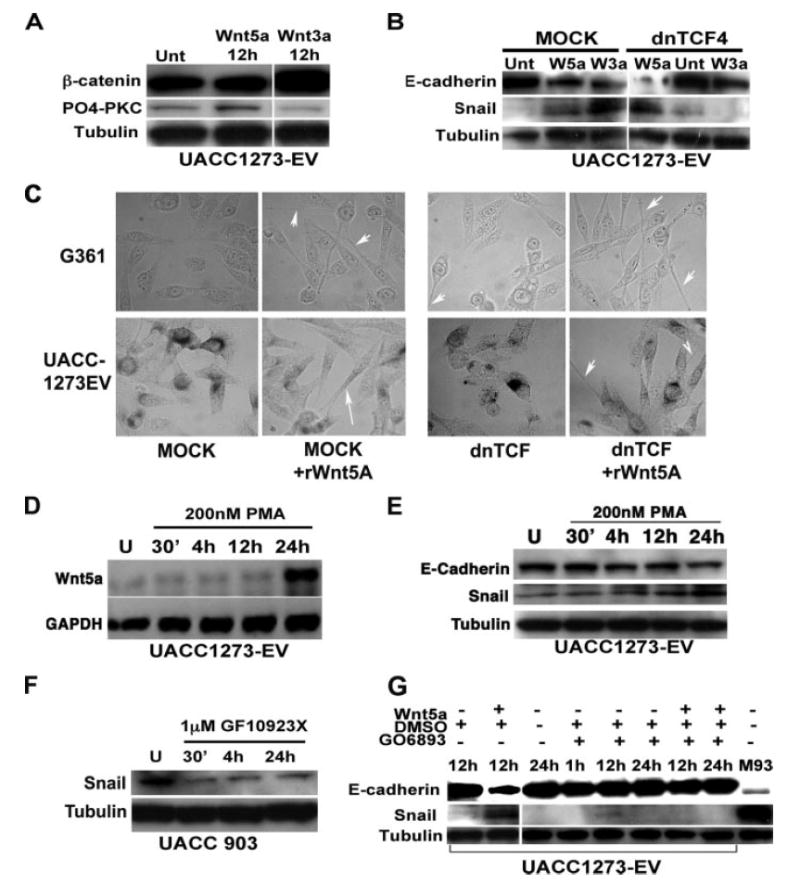
A, Wnt5A treatment does not affect β-catenin expression, whereas the canonical Wnt, Wnt3A, increases β-catenin expression, but not PO4-PKC. B, transfection of a dominant negative TCF4 into melanoma cells inhibits the ability of Wnt3A to increase Snail and decrease E-cadherin but does not affect the ability of Wnt5A to do the same. C, morphology changes induced by rWnt5a are unaffected by transfection with dnTCF. D, PMA treatment results in an increase in Wnt5A transcription by 24 h as determined by PCR in UACC1273EV Wnt5Alow cells. E, PMA treatment also results in an increase in Snail, and a decrease in E-cadherin protein in these cells. F, conversely, treatment of Wnt5Ahigh UACC903 cells with a PKC inhibitor results in a dramatic decrease in Snail expression in as early as 30 min, and this can be sustained up to 24 h. G, pre-treatment of Wnt5Alow UACC1273-EV cells with a PKC inhibitor results in an inability of Wnt5A to up-regulate Snail expression.
The non-canonical pathway by which Wnt5A has been widely shown to signal involves PKC activation, and we have demonstrated here the importance of PKC signaling in mela-noma metastasis (Fig. 3). Not only can Wnt5A activate PKC, but PKC activation has been shown to activate Wnt5A in a positive feedback loop in breast cancer cells (31). We found this to be true also for our melanoma cells after 24 h of continued phorbol ester treatment (Fig. 8D). To determine if Wnt5A effects on Snail and E-cadherin were mediated via PKC, several sets of experiments were performed using PMA, and the conventional PKC inhibitors GÖ6983, and GF109203X. Previous data from our laboratory, as well as the data included in the present study, have indicated the efficacy of both PMA and these inhibitors on our melanoma cells (17). First, Wnt5Alow UACC1273EV cells were treated with 200 nm phorbol ester (PMA), and this treatment resulted in increases in Wnt5A by 24 h as mentioned above (Fig. 8D). There were concomitant increases in the levels of Snail and decreases in E-cadherin (Fig. 8E). Next, Wnt5Ahigh UACC903 cells were treated with the conventional PKC inhibitor GF109203X, and Western analysis demonstrated corresponding decreases in Snail expression (Fig. 8F). E-cadherin expression, however, is so low in these cells that its expression cannot be restored, as observed in the preceding siRNA experiments. These two experiments demonstrate that Snail is sensitive to PKC regulation. To demonstrate that PKC is actually required for Wnt5A activation of Snail, Wnt5Alow UACC1273EV cells were pretreated with the conventional PKC inhibitors GÖ6983 or GF109203X, and then recombinant Wnt5A was added into the treated cells for up to 24 h (note that PKC inhibitor treatment continued for the 24 h duration, and both Wnt5A and inhibitor-containing media were refreshed after 12 h). Cells were examined for Snail and E-cadherin expression. Recombinant Wnt5A was unable to increase Snail expression, or decrease E-cadherin expression in the presence of a PKC inhibitor (Fig. 8G), but was unaffected by vehicle controls. Shown here are the effects of GÖ6983, but the results were identical for GF109203X (data not shown). These experiments demonstrate that Wnt5A requires PKC signaling for the activation of Snail, and concomitant down-regulation of E-cadherin.
Finally, to assess the importance of Snail as a mediator of melanoma metastasis we used an siRNA against Snail. Snail siRNA effectively decreased levels of Snail protein in Wnt5Ahigh UACC903 cells 48 h after transfection (Fig. 9A). After 48 h of exposure to Snail siRNA, UACC903 cells were subjected to a wound healing assay and indeed exhibited a modest decrease in their ability to move in and close a scratch wound (Fig. 9B). This inhibition was not as dramatic as that of PKC inhibition, which is not surprising given the plethora of effects that PKC has upon a cell. Taken together, these data show that Wnt5a can mediate the EMT via PKC activation, a process that increases the migratory capacity of melanoma cells.
FIGURE 9. Snail contributes to melanoma motility.
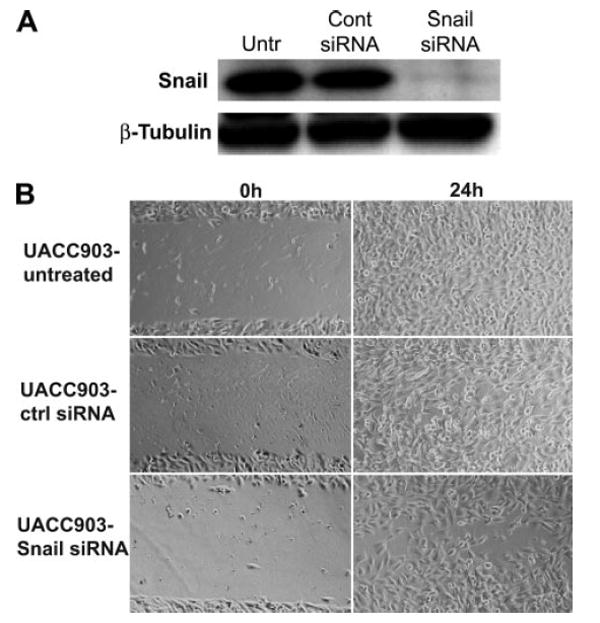
A, transfection of Snail siRNA causes an ablation of Snail expression in UACC903 cells by 48 h. B, pretreatment of UACC903 cells with Snail siRNA causes a slight decrease in melanoma cell motility.
DISCUSSION
Our previous data have indicated that Wnt5A is important for mediating melanoma motility. Here, we have attempted to further analyze the mechanisms of this process, commencing with a broad survey of the gene expression patterns affected by WNT5A expression. It is of great interest to note that the majority of the genes affected by WNT5A overexpression are down-regulated, and that this can be reversed by knockdown of WNT5A, suggesting that WNT5A plays some role in the silencing of gene expression. In summary, our analysis shows that WNT5A overexpression has multiple effects on melanoma cells, from the loss of metastasis suppressors, effectively releasing the blocks on motility, to changes leading to the switch from an epithelial to mesenchymal phenotype. These changes appear to be mediated via PKC activation, which we, and others, have demonstrated to be an important player in melanoma cell motility (32-35). We show in this study that inhibiting PKC can inhibit melanoma cell motility, and PKC activation can increase motility. We also show that, at least in our cells, prolonged activation of PKC with phorbol ester did not result in PKC depletion, but rather in a sustained increase both in the levels of PKC, and its activation as determined both by phospho-antibodies, and confocal microscopy. Importantly, we show that antibodies marketed as antibodies against “total” PKC (and possibly CAMKII), are in fact phosphorylation-sensitive and as such do not accurately assess the levels of total protein. Thus, Wnt5A appears to be increasing simply the activation of PKC, and not affecting the levels of expression of this protein, as determined by the shifts in the ratio of non-phosphorylated to phosphorylated PKC isoforms. This explains why we did not observe increases in any of these PKC isoforms by microarray. These data should also strongly caution researchers regarding the use of antibodies to total PKC and other proteins and suggest that both phospho-antibodies and antibodies to the specific PKC isoforms in question be examined in tandem before any conclusion regarding PKC activation or depletion be drawn. It is clear from our results that, although marketed as antibodies to total PKC, in fact these antibodies recognize simply non-phosphorylated PKC, as phosphatase treatment unmasks these epitopes for recognition. This could result in a misinterpretation of data. For example, even when comparing membrane extracts to cytosolic extracts, antibodies against PKC isoforms may provide misleading results, indicating a depletion, where there may in fact be an increase in membrane-bound phosphorylated PKC, that would be detected by the phospho-antibody but not the antibody against total PKC. It appears that chemical inhibitors and activators affect the total pool of PKC so there is less of a danger of misinterpretation of data using these agents, but signaling molecules that may merely affect the shift of PKC from one state to the other (such as Wnt5A) should be thoroughly and closely examined by multiple methods as we have done here.
One of the many genes down-regulated by Wnt5A is the metastasis suppressor KISS-1. This gene was identified as a metastasis suppressor of melanoma by micro-cell-mediated chromosomal transfer (19). Kiss-1, like Wnt5A, also signals via a G-protein receptor, GRP54. The effects of Kiss-1/GRP54 signaling directly oppose those of Wnt5A, resulting in the inhibition of PKC (36). Interestingly, our current data show that inhibiting PKC directly can increase levels of Kiss-1, pointing to a regulatory feedback loop that may exist between these PKC and Kiss-1. It has also been shown that Kiss-1 can inhibit calcium-regulated genes such as calcineurin (37). Calcineurin plays a role in tumor cell signaling via the dephosphorylation of nuclear factor of activating T-cells (NFAT) causing nuclear localization of NFAT (38) and promoting the transactivation of molecules involved in tumor progression (39). NFAT activity has also been associated with integrin-mediated invasion in colon carcinoma cells (40). Wnt5A control of NFAT may be mediated by Kiss-1 through a complex mechanism. Glycogen synthase kinase 3β is able to phosphorylate NFAT, causing its cytoplasmic translocation, and its entry into and out of the nucleus is regulated by the balance between calcineurin and glycogen synthase kinase 3β (41). Inhibition of calcineurin also results in decreased immunogenic response, and drugs such as cyclosporine A and FK506 are used to inhibit calcineurin during organ transplant, to prevent host versus graft disease. It has been shown that endothelial cells produce Wnt5A, and that Wnt5A in these cells can overcome cyclosporine A-mediated inhibition of NFAT translocation (42). It is thought that this occurs through the inhibition of glycogen synthase kinase 3β signaling, resulting in the constitutive nuclear localization of NFAT. However, our current data indicate that the role of Wnt5A may be more intricate, and that Wnt5A-mediated inhibition of Kiss-1, which in turn inhibits calcineurin, could also contribute to the sustained nuclear localization of NFAT. Indeed, we have observed that treatment of cells with recombinant Wnt5A results in the activation and nuclear translocation of NFAT (data not shown).
One of the few genes up-regulated by Wnt5A is the gene CD44, a tumor homing and metastasis antigen. CD44 is an important mediator of tumor cell invasion (24, 25), and its activity has been show to be dependent upon both Ca2+/calmodulin signaling and PKC activity (43). In a very elegant study by Legg et al. (44), it was shown that the directional motility of invading tumor cells could be controlled by PKC phosphorylation of CD44. This was not a simple phosphorylation, but actually involved a phosphorylation switch from a serine 325, to a serine 291, and the serine 291 phosphorylation was critical for directional cell motility. Recently another serine residue on the CD44 molecule, serine 316 has also been shown to require PKC activity for phosphorylation (indirectly) and subsequent directional cell migration along a phorbol ester gradient (45). We show here that, in addition to these observations, phorbol ester treatment of melanoma cells with low levels of CD44 dramatically increased CD44 expression, as did treatment with recombinant Wnt5A. The opposite is also true, where CD44 high cells can lose CD44 expression when either PKC or Wnt5A signaling is inhibited. Taken together these data implicate Wnt5A/PKC signaling in the up-regulation of CD44, an important mediator of cancer cell metastasis.
Finally, we investigated in greater depth the association of one more Wnt5A-induced gene, vimentin, which codes for an intermediate filament protein. Up-regulation of vimentin has been associated with the EMT (26), a hallmark of tumor cell metastasis. This change in morphology is accompanied most often by the up-regulation of the transcriptional repressor Snail, which in turn suppresses E-cadherin. In melanoma specifically, it appears that Snail overexpression regulates several changes leading to the acquisition of the metastatic phenotype (46), including the up-regulation of genes such as MMP-2 and NOTCH4. We show that Snail expression is increased in our more aggressive melanoma lines, and a reduction in Snail expression results in a decrease in motility. Although the canonical Wnt signaling pathway has been shown to activate the EMT in cancer cells (29), this is the first demonstration of the ability of the non-canonical pathway member Wnt5A to directly regulate the EMT in melanoma, although expression of Wnt5A has been associated with markers of this process (47). Our data demonstrate that treatment of melanoma cells with recombinant Wnt5A will increase vimentin levels, up-regulate Snail, and, subsequently, decrease E-cadherin expression in a PKC-, but not β-catenin-, dependent manner. It has been previously shown that transfecting a vector overexpressing Snail into squamous carcinoma cells will up-regulate Wnt5A expression (48), suggesting that, like PKC and Wnt5A, Wnt5A and Snail may engage in some sort of a positive feedback loop.
Taken together our data show multiple mechanisms by which Wnt5A can mediate melanoma metastasis. The majority of these are dependent upon PKC activation, explaining the pleiotropic nature of Wnt5A-induced effects. However, Wnt5A and its cognate receptors, Fzd2 and Fzd5, represent more specific targets with which to target tumor cells, than the ubiquitous PKC pathway. Furthermore, all of the present experiments using recombinant Wnt5A and siRNA against WNT5A indicate that the effects of Wnt5A are easily reversible, making members of the Wnt5A signaling pathway attractive targets for molecular therapy. Our previous and current data indicate that the reversal of Wnt5A signaling can inhibit melanoma cell metastasis and hold promise for the targeted delivery of inhibitors of this pathway to stem the invasion of melanoma cells.
Supplementary Material
Supplemental Material can be found at: http://www.jbc.org/cgi/content/full/M700075200/DC1
Acknowledgments
We thank Drs. Andy Chien, Pat Morin, Dan Longo, Myriam Gorospe, Michel Bernier, and Arya Biragyn for their helpful comments on the manuscript. We thank Dr. Bert Vogelstein for providing the dominant negative TCF4 vector. We gratefully acknowledge the excellent NHGRI in-house suite of array analysis tools.
Footnotes
This work was supported by the Intramural Research Program of NIA, National Institutes of Health (NIH).
The on-line version of this article (available at http://www.jbc.org) contains supplemental Fig. S1.
The abbreviations used are: PKC, protein kinase C; siRNA, small interference RNA; GFP, green fluorescent protein; PMA, 4β-phorbol-12-myristate-13-acetate; CAMKII, calmodulin-dependent kinase II; r, recombinant; EMT, epithelial to mesenchymal transition; NFAT, nuclear factor of activating T-cells; dn, dominant negative; MMP-2, matrix-metalloproteinase-2.
References
- 1.Bittner M, Meltzer P, Chen Y, Jiang Y, Seftor E, Hendrix M, Radmacher M, Simon R, Yakhini Z, Ben-Dor A, Sampas N, Dougherty E, Wang E, Marincola F, Gooden C, Lueders J, Glatfelter A, Pollock P, Carpten J, Gillanders E, Leja D, Dietrich K, Beaudry C, Berens M, Alberts D, Sondak V. Nature. 2000;406:536–540. doi: 10.1038/35020115. [DOI] [PubMed] [Google Scholar]
- 2.Clark EA, Golub TR, Lander ES, Hynes RO. Nature. 2000;406:532–535. doi: 10.1038/35020106. [DOI] [PubMed] [Google Scholar]
- 3.McMahon AP, Moon RT. Development. 1989;107(Suppl):161–167. doi: 10.1242/dev.107.Supplement.161. [DOI] [PubMed] [Google Scholar]
- 4.Nusse R, van Ooyen A, Rijsewijk F, van Lohuizen M, Schuuring E, van’t Veer L. Proc R Soc Lond B Biol Sci. 1985;226:3–13. doi: 10.1098/rspb.1985.0075. [DOI] [PubMed] [Google Scholar]
- 5.Sheldahl LC, Park M, Malbon CC, Moon RT. Curr Biol. 1999;9:695–698. doi: 10.1016/s0960-9822(99)80310-8. [DOI] [PubMed] [Google Scholar]
- 6.Sheldahl LC, Slusarski DC, Pandur P, Miller JR, Kuhl M, Moon RT. J Cell Biol. 2003;161:769–777. doi: 10.1083/jcb.200211094. [DOI] [PMC free article] [PubMed] [Google Scholar]
- 7.Westfall TA, Brimeyer R, Twedt J, Gladon J, Olberding A, Furutani-Seiki M, Slusarski DC. J Cell Biol. 2003;162:889–898. doi: 10.1083/jcb.200303107. [DOI] [PMC free article] [PubMed] [Google Scholar]
- 8.Topol L, Jiang X, Choi H, Garrett-Beal L, Carolan PJ, Yang Y. J Cell Biol. 2003;162:899–908. doi: 10.1083/jcb.200303158. [DOI] [PMC free article] [PubMed] [Google Scholar]
- 9.Weeraratna AT, Jiang Y, Hostetter G, Rosenblatt K, Duray P, Bittner M, Trent JM. Cancer Cell. 2002;1:279–288. doi: 10.1016/s1535-6108(02)00045-4. [DOI] [PubMed] [Google Scholar]
- 10.Parker C, Sherbet GV. Melanoma Res. 1992;2:337–343. doi: 10.1097/00008390-199212000-00007. [DOI] [PubMed] [Google Scholar]
- 11.Li S, Huang S, Peng SB. Int J Oncol. 2005;27:1329–1339. [PubMed] [Google Scholar]
- 12.Fink-Puches R, Helige C, Kerl H, Smolle J, Tritthart HA. Exp Dermatol. 1993;2:17–24. doi: 10.1111/j.1600-0625.1993.tb00194.x. [DOI] [PubMed] [Google Scholar]
- 13.Weeraratna AT, Becker D, Carr KM, Duray PH, Rosenblatt KP, Yang S, Chen Y, Bittner M, Strausberg RL, Riggins GJ, Wagner U, Kallioniemi OP, Trent JM, Morin PJ, Meltzer PS. Oncogene. 2004;23:2264–2274. doi: 10.1038/sj.onc.1207337. [DOI] [PubMed] [Google Scholar]
- 14.Kuhl M, Sheldahl LC, Malbon CC, Moon RT. J Biol Chem. 2000;275:12701–12711. doi: 10.1074/jbc.275.17.12701. [DOI] [PubMed] [Google Scholar]
- 15.Chin D, Means AR. Biochemistry. 2002;41:14001–14009. doi: 10.1021/bi025640o. [DOI] [PubMed] [Google Scholar]
- 16.Maya R, Oren M. Oncogene. 2000;19:3213–3215. doi: 10.1038/sj.onc.1203658. [DOI] [PubMed] [Google Scholar]
- 17.Leotlela PD, Wade MS, Duray PH, Rhode MJ, Brown HF, Rosenthal DT, Dissanayake SK, Earley R, Indig FE, Nickoloff BJ, Taub DD, Kallioniemi OP, Meltzer P, Morin PJ, Weeraratna AT. Oncogene. 2006 doi: 10.1038/sj.onc.1210155. in press. [DOI] [PubMed] [Google Scholar]
- 18.Bartolome RA, Molina-Ortiz I, Samaniego R, Sanchez-Mateos P, Bustelo XR, Teixido J. Cancer Res. 2006;66:248–258. doi: 10.1158/0008-5472.CAN-05-2489. [DOI] [PMC free article] [PubMed] [Google Scholar]
- 19.Lee JH, Miele ME, Hicks DJ, Phillips KK, Trent JM, Weissman BE, Welch DR. J Natl Cancer Inst. 1996;88:1731–1737. doi: 10.1093/jnci/88.23.1731. [DOI] [PubMed] [Google Scholar]
- 20.Dhar DK, Naora H, Kubota H, Maruyama R, Yoshimura H, Tono-moto Y, Tachibana M, Ono T, Otani H, Nagasue N. Int J Cancer. 2004;111:868–872. doi: 10.1002/ijc.20357. [DOI] [PubMed] [Google Scholar]
- 21.Ikeguchi M, Yamaguchi K, Kaibara N. Clin Cancer Res. 2004;10:1379–1383. doi: 10.1158/1078-0432.ccr-1519-02. [DOI] [PubMed] [Google Scholar]
- 22.Sanchez-Carbayo M, Capodieci P, Cordon-Cardo C. Am J Pathol. 2003;162:609–617. doi: 10.1016/S0002-9440(10)63854-0. [DOI] [PMC free article] [PubMed] [Google Scholar]
- 23.De Wit PE, Van Muijen GN, De Waal RM, Ruiter DJ. Curr Opin Oncol. 1996;8:143–151. doi: 10.1097/00001622-199603000-00012. [DOI] [PubMed] [Google Scholar]
- 24.Faassen AE, Mooradian DL, Tranquillo RT, Dickinson RB, Letourneau PC, Oegema TR, McCarthy JB. J Cell Sci. 1993;105:501–511. doi: 10.1242/jcs.105.2.501. [DOI] [PubMed] [Google Scholar]
- 25.Dietrich A, Tanczos E, Vanscheidt W, Schopf E, Simon JC. Eur J Cancer. 1997;33:926–930. doi: 10.1016/s0959-8049(96)00512-6. [DOI] [PubMed] [Google Scholar]
- 26.Boyer B, Tucker GC, Valles AM, Franke WW, Thiery JP. J Cell Biol. 1989;109:1495–1509. doi: 10.1083/jcb.109.4.1495. [DOI] [PMC free article] [PubMed] [Google Scholar]
- 27.Thiery JP, Sleeman JP. Nat Rev Mol Cell Biol. 2006;7:131–142. doi: 10.1038/nrm1835. [DOI] [PubMed] [Google Scholar]
- 28.Hsu MY, Meier F, Herlyn M. Differentiation. 2002;70:522–536. doi: 10.1046/j.1432-0436.2002.700906.x. [DOI] [PubMed] [Google Scholar]
- 29.Kim K, Lu Z, Hay ED. Cell Biol Int. 2002;26:463–476. doi: 10.1006/cbir.2002.0901. [DOI] [PubMed] [Google Scholar]
- 30.He TC, Sparks AB, Rago C, Hermeking H, Zawel L, da Costa LT, Morin PJ, Vogelstein B, Kinzler KW. Science. 1998;281:1509–1512. doi: 10.1126/science.281.5382.1509. [DOI] [PubMed] [Google Scholar]
- 31.Jonsson M, Smith K, Harris AL. Br J Cancer. 1998;78:430–438. doi: 10.1038/bjc.1998.511. [DOI] [PMC free article] [PubMed] [Google Scholar]
- 32.Mapelli E, Banfi P, Sala E, Sensi M, Supino R, Zunino F, Gambetta RA. Int J Cancer. 1994;57:281–286. doi: 10.1002/ijc.2910570225. [DOI] [PubMed] [Google Scholar]
- 33.Oka M, Kikkawa U. Cancer Metastasis Rev. 2005;24:287–300. doi: 10.1007/s10555-005-1578-8. [DOI] [PubMed] [Google Scholar]
- 34.Yoshikawa N, Nakamura K, Yamaguchi Y, Kagota S, Shinozuka K, Kunitomo M. Life Sci. 2003;72:1377–1387. doi: 10.1016/s0024-3205(02)02407-4. [DOI] [PubMed] [Google Scholar]
- 35.Lahn MM, Sundell KL. Melanoma Res. 2004;14:85–89. doi: 10.1097/00008390-200404000-00002. [DOI] [PubMed] [Google Scholar]
- 36.Jiang J, Struhl G. Nature. 1998;391:493–496. doi: 10.1038/35154. [DOI] [PubMed] [Google Scholar]
- 37.Stathatos N, Bourdeau I, Espinosa AV, Saji M, Vasko VV, Burman KD, Stratakis CA, Ringel MD. J Clin Endocrinol Metab. 2005;90:5432–5440. doi: 10.1210/jc.2005-0963. [DOI] [PubMed] [Google Scholar]
- 38.Park J, Yaseen NR, Hogan PG, Rao A, Sharma S. J Biol Chem. 1995;270:20653–20659. doi: 10.1074/jbc.270.35.20653. [DOI] [PubMed] [Google Scholar]
- 39.Hogan PG, Chen L, Nardone J, Rao A. Genes Dev. 2003;17:2205–2232. doi: 10.1101/gad.1102703. [DOI] [PubMed] [Google Scholar]
- 40.Jauliac S, Lopez-Rodriguez C, Shaw LM, Brown LF, Rao A, Toker A. Nat Cell Biol. 2002;4:540–544. doi: 10.1038/ncb816. [DOI] [PubMed] [Google Scholar]
- 41.Neal JW, Clipstone NA. J Biol Chem. 2001;276:3666–3673. doi: 10.1074/jbc.M004888200. [DOI] [PubMed] [Google Scholar]
- 42.Murphy LL, Hughes CC. J Immunol. 2002;169:3717–3725. doi: 10.4049/jimmunol.169.7.3717. [DOI] [PubMed] [Google Scholar]
- 43.Sionov RV, Naor D. Cell Adhes Commun. 1998;6:503–523. doi: 10.3109/15419069809010798. [DOI] [PubMed] [Google Scholar]
- 44.Legg JW, Lewis CA, Parsons M, Ng T, Isacke CM. Nat Cell Biol. 2002;4:399–407. doi: 10.1038/ncb797. [DOI] [PubMed] [Google Scholar]
- 45.Tzircotis G, Thorne RF, Isacke CM. Oncogene. 2006;25:7401–7410. doi: 10.1038/sj.onc.1209724. [DOI] [PubMed] [Google Scholar]
- 46.Kuphal S, Palm HG, Poser I, Bosserhoff AK. Melanoma Res. 2005;15:305–313. doi: 10.1097/00008390-200508000-00012. [DOI] [PubMed] [Google Scholar]
- 47.Lewis TB, Robison JE, Bastien R, Milash B, Boucher K, Samlowski WE, Leachman SA, Dirk Noyes R, Wittwer CT, Perreard L, Bernard PS. Cancer. 2005;104:1678–1686. doi: 10.1002/cncr.21372. [DOI] [PubMed] [Google Scholar]
- 48.Taki M, Kamata N, Yokoyama K, Fujimoto R, Tsutsumi S, Nagayama M. Cancer Sci. 2003;94:593–597. doi: 10.1111/j.1349-7006.2003.tb01488.x. [DOI] [PMC free article] [PubMed] [Google Scholar]
Associated Data
This section collects any data citations, data availability statements, or supplementary materials included in this article.
Supplementary Materials
Supplemental Material can be found at: http://www.jbc.org/cgi/content/full/M700075200/DC1