Abstract
Many cellular events depend on a tightly compartmentalized distribution of H+ ions across membrane-bound organelles. However, measurements of organelle pH in living cells have been scarce. Several mutants of the Aequorea victoria green fluorescent protein (GFP) displayed a pH-dependent absorbance and fluorescent emission, with apparent pKa values ranging from 6.15 (mutations F64L/S65T/H231L) and 6.4 (K26R/F64L/S65T/Y66W/N146I/M153T/V163A/N164H/H231L) to a remarkable 7.1 (S65G/S72A/T203Y/H231L). We have targeted these GFPs to the cytosol plus nucleus, the medial/trans-Golgi by fusion with galactosyltransferase, and the mitochondrial matrix by using the targeting signal from subunit IV of cytochrome c oxidase. Cells in culture transfected with these cDNAs displayed the expected subcellular localization by light and electron microscopy and reported local pH that was calibrated in situ with ionophores. We monitored cytosolic and nuclear pH of HeLa cells, and mitochondrial matrix pH in HeLa cells and in rat neonatal cardiomyocytes. The pH of the medial/trans-Golgi was measured at steady-state (calibrated to be 6.58 in HeLa cells) and after various manipulations. These demonstrated that the Golgi membrane in intact cells is relatively permeable to H+, and that Cl− serves as a counter-ion for H+ transport and likely helps to maintain electroneutrality. The amenability to engineer GFPs to specific subcellular locations or tissue targets using gene fusion and transfer techniques should allow us to examine pH at sites previously inaccessible.
The prevalent pH within the various cellular compartments is regulated to provide optimal activity of many cellular processes. In the secretory pathway, posttranslational processing of secretory proteins and cleavage of prohormones is pH-dependent (1), as is the retrieval of escaped luminal endoplasmic reticulum proteins (2). In mitochondria, the proton-motive potential across the inner membrane drives ATP synthesis and ion and metabolite uptake into the matrix.
It would be advantageous to be able to measure H+ concentrations in defined organelles in intact cells. Traditional synthetic pH indicators can be localized to the cytosol and nucleus, but not selectively to organelles other than the endocytic pathway (3, 4). In addition, some cells are resistant to loading with cell-permeant dyes because of physical barriers such as the cell wall (in bacteria, yeast, and plants) or the thickness of a tissue preparation such as brain slices.
Mitochondrial matrix pH (pHm) has been elusive to study. The pH indicator BCECF has been used in intact cells (5), where confocal microscopy was used to separate the mitochondrial signal from its surrounding cytoplasm. Obviously it would be preferable to target the pH probe specifically to mitochondria without interference from staining of cytosol or other organelles. With regard to the analysis of Golgi or trans-Golgi network (TGN) pH in living cells, several methods have been reported (6–8) but are either technically demanding or affected by artifactual signal from adjacent organelles in the secretory pathway.
To overcome the above limitations we have constructed pH indicators encoded by cDNA, based on mutants of the Aequorea victoria green fluorescent protein (GFP). The in vitro pH dependency of various GFP mutants has been reported recently (9, 10). Here we extend these observations to other GFP mutants with improved properties as pH probes. We target these GFPs to the cytosol plus nucleus, trans-Golgi cisternae, and mitochondrial matrix to study pH regulatory mechanisms in these organelles in living cells.
MATERIALS AND METHODS
Gene Construction for Expression in E. coli and Compartment-Specific Expression in Mammalian Cells.
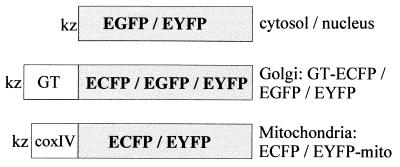
Enhanced GFP (EGFP) mutants ECFP (enhanced cyan fluorescent protein) and EYFP (enhanced yellow fluorescent protein) were made from EGFP (F64L/S65T/H231L, CLONTECH) by introducing the amino acid substitutions: ECFP, K26R/Y66W/N146I/M153T/V163A/N164H; and EYFP, L64F/S65G/S72A/T203Y (11, 12). The recombinant proteins were produced in E. coli (BL21 DE3) and purified as described previously (11). A HindIII site followed by a Kozak consensus sequence (GCCACC-ATG) was introduced at the 5′ end, and a EcoRI site was introduced at the 3′ end of the gene of each indicator. The restricted PCR products were ligated into the HindIII/EcoRI sites of the mammalian expression vector pcDNA3 (Invitrogen). EGFP and EYFP with no targeting signals were used as cytosolic/nuclear indicators. The type II membrane-anchored protein galactosyltransferase (GT; UDP-galactose:β-d-N-acetylglucosaminide β-1,4-galactosyltransferase, EC 2.4.1.22) has been used as a marker of the trans cisternae of the Golgi apparatus (13). The N-terminal 81 aa of human GT (a gift of Michiko Fukuda, The Burnham Institute, La Jolla, CA) were fused to EGFP, ECFP, or EYFP to make the Golgi indicators GT-EGFP, GT-ECFP, or GT-EYFP, respectively (see Fig. 2). The N-terminal 12 aa of the presequence of subunit IV of cytochrome c oxidase (14) were fused through Arg-Ser-Gly-Ile to ECFP or EYFP to make the mitochondrial matrix pH indicators ECFP-mito or EYFP-mito.
Figure 2.
Constructs for compartment-specific expression in mammalian cells. Kz, Kozak consensus sequence; coxIV, cytochrome c oxidase subunit IV targeting signal.
Spectroscopy and pH Titration in Vitro.
Absorbance spectra were obtained in a Cary 3E spectrophotometer (Varian). For pH titrations a monochromator-equipped fluorometer (Spex Industries, Edison, NJ) (11) and a 96-well microplate fluorometer (Cambridge Technology) were used. In the latter case the filters used for excitation were 482 ± 10 (460 ± 18 for ECFP) and for emission, were 532 ± 14. Filters are named as the center wavelength ± the half-bandwidth, both in nm. The solutions for cuvette and live cell pH titration contained 125 mM KCl, 20 mM NaCl, 0.5 mM CaCl2, 0.5 mM MgCl2, and 25 mM of one of the buffers—acetate, Mes, Mops, Hepes, bicine, and Tris.
Double-Labeling Fluorescence and Confocal Microscopy.
Double-labeling fluorescence was performed as described (15). Rabbit polyclonal α-mannosidase II (α-manII) antibody was prepared as described (16). A Bio-Rad MRC-1000 confocal microscope was used for analysis of mitochondria-targeted EYFP-mito.
Electron Microscopy.
Immunogold labeling of ultra-thin sections was performed as described (15). The rabbit polyclonal anti-GFP antibody was a gift from Charles Zuker (University of California at San Diego, La Jolla). The monoclonal anti-TGN38 was a gift of George Banting (University of Bristol, Bristol, U.K.).
Gene Transfection.
HeLa cells and AtT-20 cells grown on glass coverslips were transiently transfected with lipofectin (Gibco). A HeLa cell line stably expressing EYFP-mito was obtained by selection with the antibiotic G418 (Gibco). Neonatal rat myocardial cells in primary culture were transfected by the Ca2+ phosphate method.
Live Cell Imaging and Physiology.
Between 2 and 4 days after transfection, cells were imaged at 22°C with a cooled charge-coupled device camera (Photometrics, Tucson, AZ) as described (17). The interference filters (Omega Optical and Chroma Technology, Brattleboro, VT) used for excitation and emission were 440 ± 10 and 480 ± 15 for ECFP; 480 ± 15 and 535 ± 22.5 for EGFP or EYFP. The dichroic mirrors were 455 DCLP for ECFP, and 505 DCLP for EGFP or EYFP. Regions of interest were selected manually, and pixel intensities were spatially averaged after background subtraction. A binning of 2 was used to improve signal/noise and minimize photodamage and photoisomerization of EYFP. In the Cl−-free bath solution, Na-d-gluconate and K-d-gluconate substituted for NaCl and KCl in Hanks’ balanced salt solution. High KCl buffer plus 5 μM each of the ionophores nigericin (Fluka) and monensin (Calbiochem) was used for in situ titrations in living cells (7). Cells were loaded with cytosolic pH indicators by incubation with 3 μM carboxy-SNARF/AM or BCECF/AM (Molecular Probes) for 45 min, then washed for 30 min, all at 22°C.
RESULTS
pH Titration of Recombinant GFPs in Vitro.
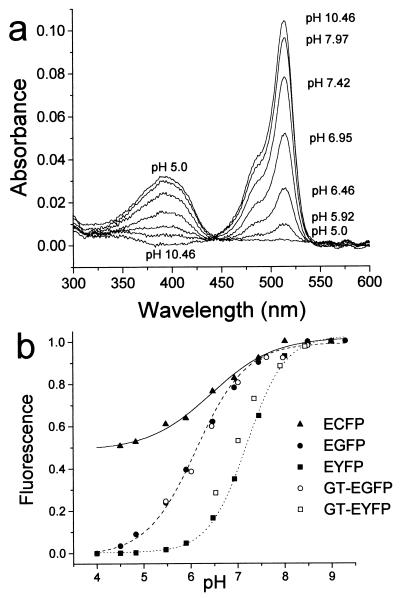
Wild-type GFP fluorescence was reported to be stable between pH 6 and 10 (18). However, we observed that several GFP mutants are pH-sensitive. EYFP showed an acidification-dependent decrease in the absorbance peak at 514 nm and a concomitant increase in the absorbance at 390 nm (Fig. 1a). The fluorescence emission (527-nm peak) and excitation spectra (514-nm peak) decreased with decreasing pH, but the fluorescence excitation spectrum showed no compensating increase at 390 nm. Therefore, the species absorbing at 390 nm was nonfluorescent. The apparent pKa (pK′a) of EYFP was 7.1 with a Hill coefficient (n) of 1.1 (Fig. 1b). EGFP fluorescence also was quenched with decreasing pH, as reported (10). The pK′a was 6.15 and n was 0.7. The change in fluorescence of ECFP (Tyr66 → Trp in chromophore) with pH was smaller than that of EGFP or EYFP (pK′a, 6.4; n, 0.6) (Fig. 1b). The fluorescence change was reversible in the pH range 5–8.5 for all three proteins. Because this covers the pH range of most subcellular compartments, we reasoned that these GFP mutants could be used as physiological pH indicators.
Figure 1.
(a) pH-dependent absorbance of EYFP. (b) pH dependency of fluorescence of various GFP mutants in vitro and in cells. The fluorescence intensity of purified recombinant GFP mutant protein (solid symbols) as a function of pH was measured in a microplate fluorometer as indicated in Materials and Methods. The fluorescence of the Golgi region of HeLa cells expressing either GT-EYFP or GT-EGFP (open symbols) was determined during pH titration with the ionophores monensin/nigericin in high KCl solutions.
Expression and pH Measurements in Mammalian Cytosol and Nucleus.
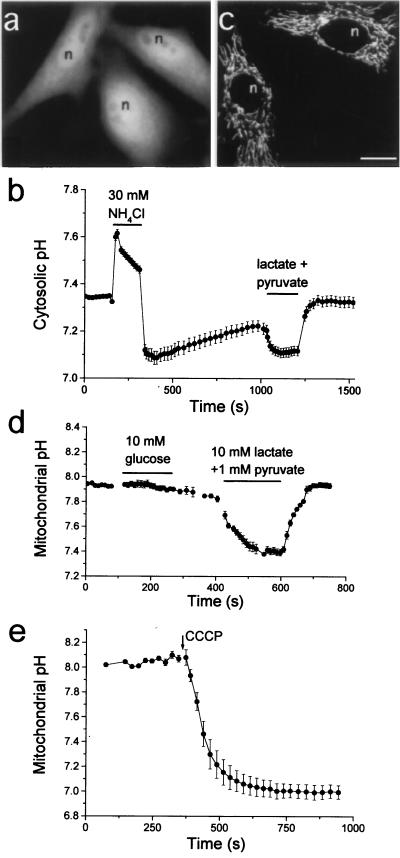
Fluorescence of HeLa cells transfected with the gene encoding EYFP (Fig. 2) was diffusely distributed in the cytosol and nucleus (Fig. 3a), as expected for a protein of 27 kDa, which can pass through nuclear pores. EYFP expressed in cells was sensitive to pH changes because perfusion with the permeant base NH4Cl (19) caused an increase in fluorescence (rise in pH), which reversed on wash-out, overshoot to a lower pH, and gradually rose to control levels (Fig. 3b). Perfusion of lactate induced a decrease in fluorescence (acidification), also reversible on wash-out. Calibration of fluorescence intensity with pH in situ was accomplished with a mix of the alkali cation/H+ ionophores nigericin and monensin in bath solutions of defined pH and high K+ (not shown). Fluorescence equilibrated within 1–4 min after each exchange of solution. Therefore, EYFP in the cytosol and nucleus can report pH in the physiological range. One crucial advantage of indicators encoded by cDNA over synthetic indicators is the amenability of fusion with targeting signals to direct their expression to restricted cell locations (17). To demonstrate the feasibility of this approach we targeted pH-sensitive GFPs to the mitochondrial matrix and to the Golgi, where pH is known to be critical for the organelle functions.
Figure 3.
(a) Fluorescence image of living HeLa cells transfected with EYFP shows cytosolic plus nuclear localization. (Bar = 10 μm in all fluorescence images.) (b) pH measurements in cytosol and nucleus of HeLa cells (mean ± SE of n cells). Perfusion of permeant base and acid changes cytosolic pH (n = 7). (c) Confocal microscopy image of living HeLa cells transfected with EYFP-mito shows mitochondrial staining. (d) Effect of glucose and lactate/pyruvate perfusion on mitochondrial pH (n = 3). (e) The uncoupler CCCP collapses mitochondrial pH (n = 3).
Mitochondrial Matrix.
In contrast to the large body of knowledge obtained in isolated mitochondria, less is known about integration of mitochondrial function within living cells, where their cytosolic environment and interplay with other organelles is preserved. The electron transport chain generates a proton-motive force across the mitochondrial inner membrane, which consists of a membrane potential (Δψ, negative inside) and a pH gradient (ΔpH, alkaline inside). We targeted EYFP to the mitochondrial matrix (EYFP-mito) by using the 12 N-terminal residues of the presequence of cytochrome c oxidase subunit IV (Fig. 2) (14). We chose EYFP because it showed the highest pK′a of the GFP mutants examined (Fig. 1b).
HeLa cells and neonatal rat cardiomyocytes in primary culture transfected with the gene of EYFP-mito showed a pattern typical of mitochondria under the fluorescence microscope (Fig. 3c for HeLa cells), indistinguishable from that of the conventional mitochondrial dye rhodamine 123 (not shown). The normal beating of cardiomyocytes expressing EYFP-mito suggests the noninvasive nature of these indicators. In situ pH titration was performed as above with nigericin/monensin, which effectively collapsed ΔpH, because the protonophore carbonylcyanide m-chlorophenylhydrazone (CCCP) added subsequently did not change the fluorescence intensity. The estimated resting pHm was 7.98 ± 0.07 in HeLa cells (n = 17 cells from six experiments) and 7.91 ± 0.16 in cardiomyocytes (n = 13 cells from six experiments). Similar pH values were obtained in a HeLa cell line stably expressing EYFP-mito. Resting pH did not change by superfusion of cells with medium containing 10 mM glucose, which would provide cells with an oxidizable substrate, but 10 mM lactate plus 1 mM pyruvate caused an acidification (Fig. 3d), which reversed on wash-out. This can be accounted for by diffusion of protonated acid or by cotransport of pyruvate−/H+ through the inner mitochondrial membrane. The protonophore CCCP rapidly induced an acidification of mitochondria (Fig. 3e) to about pH 7.
Medial/Trans-Golgi.
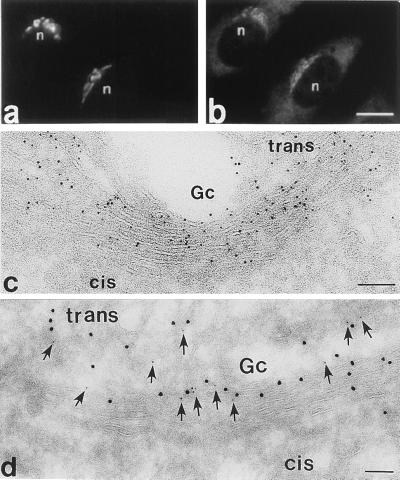
We have made indicators of Golgi pH by fusing the N-terminal 81 aa residues of the trans-Golgi integral membrane protein GT (13) with ECFP, EGFP, or EYFP (Fig. 2). The GFP moiety in these chimeras is expected to reside in the Golgi lumen. When HeLa cells or AtT-20 cells were transfected with the cDNAs, a pattern of bright juxtanuclear fluorescence was observed (Fig. 4a), with little increase in diffuse staining above autofluorescence in most cells. In double-labeling experiments in HeLa cells the staining of the medial/trans-Golgi marker α-manII overlapped with GT-EYFP fluorescence (Fig. 4 a and b). We also fused α-manII with ECFP, and the pattern of fluorescence obtained upon transfection of the gene was indistinguishable from that of GT-EYFP by light microscopy (not shown). To identify the subcellular location of GT-EYFP at higher resolution, immunogold electron microscopy was performed on ultra-thin cryosections by using antibodies against GFP. Although endogenous GT is present in trans Golgi membranes, we found GT-EYFP also in the medial Golgi, perhaps as a result of overexpression (Fig. 4c). The protein TGN38 (20) was used as a TGN marker in double-labeling immunogold experiments (Fig. 4d). Gold particles colocalized to medial/trans-Golgi membranes. Thus, we will refer to pHG as the pH of the compartment labeled by GT-EYFP, i.e., medial- and trans-Golgi.
Figure 4.
Fluorescence and electron microscopy of Golgi-targeted EYFP. (a and b) Double-staining fluorescence image of fixed HeLa cells transfected with GT-EYFP shows the overlap of the endogenous fluorescence of EYFP (a) and the fluorescence of the Golgi marker α-manII [detected with Texas red goat anti-rabbit F(ab′)2 conjugate]. (c) Immunogold localization of GT-EYFP (polyclonal antibodies to GFP) to the Golgi apparatus in ultra-thin cryosections of transfected HeLa cells. Note that GT-EYFP is distributed broadly across the Golgi stack, but is more concentrated toward the trans side. (d) Double-immunogold localization showing overlap between GT-EYFP (10 nm gold) and the trans-Golgi network protein TGN38 (arrows, 5 nm gold).
The pH titration of GT-EYFP fluorescence in the Golgi region of cells with nigericin/monensin was in good agreement with that of EYFP in vitro (Fig. 1b). This shows that neither fusion with GT nor the composition of the Golgi lumen affects the pH sensitivity of EYFP, and validates the use of Golgi-targeted EYFP as a local pH indicator. Resting pHG in HeLa cells was on average 6.58 (range 6.4–6.81, n = 30 cells, 9 experiments).
Pioneering in vitro work demonstrated that the pH gradient across the Golgi membrane is maintained by the activity of an electrogenic ATP-dependent H+ pump (V-ATPase) (21). The V-ATPase generates a ΔpH (acidic inside) and a Δψ (positive inside), which oppose further H+ transport. The movement of counter-ions, Cl− in (or K+ out), with H+ uptake would shunt the Δψ allowing a larger ΔpH to be generated. We have investigated these and other mechanisms in intact single HeLa cells transfected with GT-EYFP.
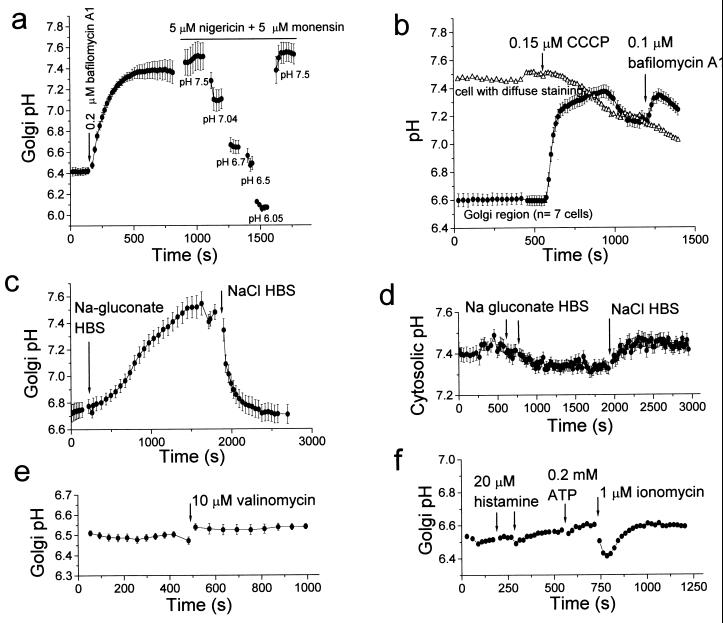
The macrolide antibiotic bafilomycin A1 has been shown to be a potent inhibitor of vacuolar type H+ ATPases (V type) (22). In HeLa cells expressing GT-EYFP, bafilomycin A1 (0.2 μ M) increased pHG by about 0.6 pH units, to pH 7.16 (range 7.02–7.37, n = 12 cells) (Fig. 5a). This suggests that the H+ pump compensates for a passive H+ efflux or leak (6, 7). The initial rate of Golgi alkalinization by bafilomycin A1 was 0.52 pH units per minute (range 0.3–0.77, n = 12 cells), faster than that reported for other acidic compartments, such as macrophage phagosomes (0.09 pH/min) (4). Similar results regarding resting pHG and alkalinization by bafilomycin A1 were obtained when HeLa cells were transfected with GT-EGFP (not shown). Calibration of GT-EGFP in situ also mirrored its in vitro titration (Fig. 1b). Thus, both EGFP and EYFP are suitable Golgi pH indicators.
Figure 5.
pH measurements in the medial/trans-Golgi of HeLa cells expressing GT-EYFP (mean ± SE of n cells). (a) Inhibition of V-type H+ ATPase by bafilomycin A1 (0.2 μM) raises pHG (n = 3). Calibration of fluorescence as pH was performed with nigericin/monensin in high K+ buffers. (b) The protonophore CCCP increases the endogenous H+ leakage of Golgi membranes raising pHG (n = 7). One control cell with diffuse cellular staining was selected in the same field. (c) Cl− is a counter-ion for H+ transport in the Golgi. Effect of substitution of gluconate medium (Cl−-free) for Hanks’ buffered saline (n = 4). (d) Cytosolic pH decreases slightly by Cl− removal in control HeLa cells loaded with the pH indicator carboxy-SNARF (n = 13). (e) Increasing K+ conductance with the ionophore valinomycin does not change steady-state Golgi pH (n = 10). (f) Effect of Ca2+ mobilization by agonists and ionomycin on pHG (n = 3).
In cells expressing GT-EYFP, the protonophore CCCP (0.15 μM) raised pHG to 7.1 (Fig. 5b), even in the presence of active H+ pumping. Bafilomycin A1 added next alkalinized the Golgi only slightly. In the experiment of Fig. 5b, one cell in the field was chosen as negative control because it showed a diffuse fluorescence staining (five times dimmer than that of Golgi area in neighboring cells). This staining likely corresponds to endoplasmic reticulum, because all GT-EYFP is synthesized there before export to the Golgi. This compartment had a resting pH of about 7.45 and, in contrast with pHG, it acidified slightly on CCCP addition (Fig. 5b). The rapid alkalinization of pHG induced by bafilomycin A1 or CCCP suggests that in the Golgi membrane counter-ion permeability does not limit H+ movement.
We investigated the contribution of Cl− conductance to H+ fluxes in the Golgi of HeLa cells. Replacement of extracellular Cl− by isoosmotic gluconate (to deplete intracellular Cl− ) increased the pHG to above 7.2 in about 20 min (Fig. 5c). In the absence of cytosolic Cl− as counter-ion for H+ transport, the V-ATPase would be expected to develop a Δψ across the Golgi membrane, which would oppose H+ movement, thus raising pHG. Washing with Cl−-containing saline resulted in a reacidification to pH 6.8. In Cl−-depleted cells, bafilomycin A1 added together with Cl− buffer prevented this reacidification of the Golgi (not shown). In control experiments, wash with Na gluconate either did not change cytosolic pH (34 cells, 2 experiments) or lowered cytosolic pH by about 0.4 pH units (36 cells, 2 experiments) as measured with the pH indicators BCECF and carboxy-SNARF (Fig. 5d). This finding suggests low basal activity of the HCO3−/Cl− exchanger in the plasma membrane of HeLa cells, which, if present, would be expected to raise cytosolic pH on removal of extracellular Cl−.
In liver Golgi membrane fractions valinomycin, an alkali cation ionophore, has been reported to increase both the rate and extent of the ΔpH generated by the V-ATPase (21). This has been interpreted to mean that the Cl− conductance was able to shunt only in part the Δψ, which would be completely collapsed upon increase of K+ permeability with valinomycin. Decreasing the Δψ component of the proton-motive force would increase the ΔpH, lowering pHG. We find that, in contrast to the effect reported in isolated liver Golgi membranes, valinomycin either did not change or slightly raised pHG (Fig. 5e) in HeLa cells. This suggests that the Golgi Δψ in living HeLa cells with normal Cl− is small or null. This difference may arise from the cell type (liver cells vs. HeLa cells) or from changes that may occur during preparation of Golgi membrane fractions. Unfortunately, a technique to measure Golgi Δψ in living cells is not available, so this hypothesis cannot be tested directly. Controls with BCECF showed that valinomycin did not change cytosolic pH (not shown).
Other organelles have been reported to have additional mechanisms modulating luminal pH in addition to the V-ATPase. Early endosomes possess an electrogenic Na+,K+-ATPase, which generates an interior-positive Δψ that opposes H+ translocation by the V-ATPase. Thus, inhibition of the Na+,K+-ATPase by ouabain enhanced acidification of early endosomes in cells (23). In HeLa cells the cell-permeant inhibitor of the Na+,K+-ATPase acetylstrophanthidin did not affect Golgi pH (not shown), thus suggesting that this mechanism does not play a role in the regulation of pHG.
We studied the effects of the second messengers Ca2+ and cAMP on Golgi steady-state pH. pHG did not change in response to the Ca2+-mobilizing agonists histamine or ATP (used as a P2U purinergic agonist) at concentrations that cause release of Ca2+ from internal stores and Ca2+ influx in HeLa cells (17). However, the Ca2+ ionophore ionomycin caused a transient decrease of pHG of about 0.2 pH units (Fig. 5f). Two mechanisms may account for this acidification. First, ionomycin may transport Ca2+ out of the Golgi lumen into the cytosol in exchange for H+; the Golgi complex has been found to be an important store of Ca2+ (24) and total Ca (25). A second mechanism would be acidification of the Golgi secondary to cytosolic acidification, because a large Ca2+ rise such as that caused by ionomycin induces cytosolic acidification owing to the displacement of H+ from Ca2+-binding sites (26) (not shown). However, pHG has been found to remain constant despite acidification of the cytosol by reversal of the plasma membrane Na+/H+ antiport (7). Because this maneuver imposes a change in cytosolic pH that develops over 20 or more min, it is possible that a faster change in cytosolic pH could transiently affect pHG (Fig. 5f). pHG did not change when HeLa cells were stimulated with forskolin (25 μM, not shown) to elevate cAMP, in contrast with previous findings in the trans-Golgi of fibroblasts and epithelial cells (6).
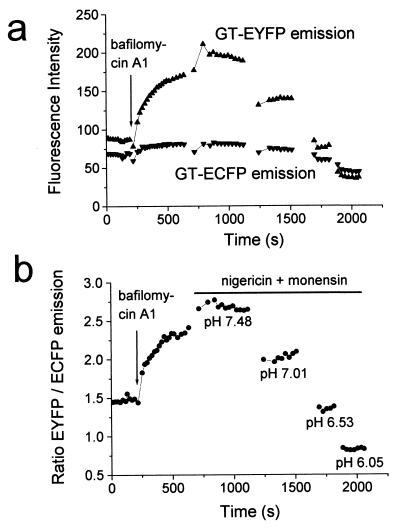
Quantitative measurements of fluorescence with nonratiometric indicators can suffer from artifacts as a result of cell movement or focusing. We attempted to correct for those by introducing a reference GFP. The cyan-emitting mutant ECFP has distinct excitation and emission peaks that can be separated from those of EYFP by appropriate filters (11, 12, 17), and ECFP is less pH-sensitive than EYFP (Fig. 1b). Therefore, we cotransfected HeLa cells with GT-EYFP and GT-ECFP to obtain a ratiometric measurement of pHG. Fig. 6a shows that the fluorescence of ECFP changed less than that of EYFP during the course of the experiment. Although the ratio of EYFP to ECFP emission varied between cells, probably reflecting a different concentration of mature GT-EYFP and GT-ECFP in the Golgi lumen, it changed with pH as expected (Fig. 6b). Bafilomycin A1 raised the GT-EYFP/GT-ECFP emission ratio (raised pHG).
Figure 6.
Ratiometric measurement of pHG by cotransfecting HeLa cells with GT-ECFP and GT-EYFP. (a) Single wavelength fluorescence intensities of GT-EYFP and GT-ECFP in the Golgi region of a HeLa cell. (b) Ratio of GT-EYFP/GT-ECFP fluorescence emission of the same cell.
DISCUSSION
The present results demonstrate that three GFP mutants show different pH dependency of fluorescence. The mutant EYFP is suitable for cytosolic, Golgi, and mitochondrial matrix pH measurements. We show that EGFP can be used as cytosolic and Golgi pH indicator. For organelles yet more acidic than the Golgi, EGFP (pK′a 6.15) would be advantageous, because EYFP (pK′a 7.1) would be almost nonfluorescent. Conversely, EGFP would not be a good mitochondrial matrix indicator, because it would hardly be able to detect pH changes close to pH 8, almost 2 pH units away from its pK′a. While this paper was in review, a report was published describing the pH dependency of four GFP mutants (27). Cytoplasmic and organellar pH measurements were demonstrated but were hindered by the low pK′a (6.1) of the mutant used in cells.
Three other techniques have been reported to study pHG or pHTGN in living cells. The first uses microinjection of fluorescent indicators enclosed in liposomes that fuse with the trans-Golgi (6). This laborious procedure allows measurements to be done within a narrow time frame limited by fusion at 37°C for labeling, and decline in fluorescence owing to secretory traffic and dye leakage (6). Fibroblasts and epithelial cells were found to have a pHG of 6.17–6.36. We report here that HeLa cells pHG (medial/trans) is 6.58. The second approach makes use of the retrograde transport of fluorescein-labeled verotoxin 1B (7), which stains the entire Golgi complex en route to the endoplasmic reticulum; in Vero cells the Golgi pH averaged 6.45. This elegant method, however, can be used only in cells bearing the receptor globotriaosyl ceramide on the plasma membrane and may be limited by the residence time of verotoxin in transit through the Golgi apparatus. In a recent report pHTGN is measured by using a chimeric protein CD25-TGN38, which cycles between the TGN and the plasma membrane, where CD25 binds extracellular anti-CD25 antibodies conjugated with a pH-sensitive fluorophore (8). In agreement with the notion that pH decreases down the secretory pathway, the pHTGN was found to be 5.91 in HeLa cells, about 0.5 pH units more acidic than pHG (see above).
Our results also raise the more general point that when using GFPs in quantitative microfluorometric studies one has to bear in mind their pH sensitivity. Likewise, quantum yield information of GFP mutants should be standardized to defined pH values.
The advantages of GFPs as pH indicators compared with small-molecule dyes are as follows. (i) GFPs have a broader applicability to cells and organisms amenable to gene transfer, because ester permeation and hydrolysis of small dyes is not needed. No leakage occurs over the course of typical experiments even at 37°C. (ii) GFPs can be targeted to tissues, cell types (using specific promoters), and organelles (this work), or particular cellular domains by fusion to protein targets. (iii) Mutagenesis can improve the current properties like pK′a and/or dynamic range. In particular, more pH-resistant GFPs could be used as partners for ratiometric pH measurements. To this end it would be better to obtain a single GFP with pH-dependent excitation or emission shifts. In some cell types the mitochondrial pH may be higher than one pH unit above EYFP’s pK′a, and thus almost saturate the probe. Mutant GFPs with yet higher pK′a would be preferred in such cases. (iv) GFPs are more resistant to photobleaching than fluorescein-based dyes. EYFP was found to suffer reversible photoisomerization when illuminated strongly (ref. 28; J.L. and A.M., unpublished results) but judicious use of exposure time and binning avoided this problem in the present results. (v) Finally, few detrimental effects have been found in cells where GFPs are expressed, and our results agree with that general conclusion.
Acknowledgments
We thank Dr. Andrew Cubitt, Dr. Javier Garcia-Sancho, and Dr. Terry Machen for helpful advice and discussion, and Dr. Pilar Ruiz-Lozano for providing cardiomyocytes. This work was supported by the Howard Hughes Medical Institute (R.Y.T.) and National Institutes of Health Grants NS 27177 (R.Y.T.) and CA 58689 (M.G.F.).
ABBREVIATIONS
- TGN
trans-Golgi network
- GFP
green fluorescent protein from Aequorea victoria
- ECFP
enhanced cyan fluorescent protein
- EGFP
enhanced green fluorescent protein
- EYFP
enhanced yellow fluorescent protein
- GT
UDP-galactose:β-d-N-acetylglucosaminide β-1,4-galactosyltransferase
- pHm
mitochondrial matrix pH
- pHG
medial- and trans-Golgi pH
- pHTGN
trans-Golgi network pH
- CCCP
carbonylcyanide m-chlorophenylhydrazone
- ΔpH
pH gradient
- Δψ
membrane potential gradient
References
- 1.Schmidt W K, Moore H P. Mol Biol Cell. 1995;10:1271–1285. doi: 10.1091/mbc.6.10.1271. [DOI] [PMC free article] [PubMed] [Google Scholar]
- 2.Wilson D W, Lewis M J, Pelham H R. J Biol Chem. 1993;268:7465–7468. [PubMed] [Google Scholar]
- 3.Ohkuma S, Poole B. Proc Natl Acad Sci USA. 1978;75:3327–3331. doi: 10.1073/pnas.75.7.3327. [DOI] [PMC free article] [PubMed] [Google Scholar]
- 4.Lukacs G L, Rotstein O D, Grinstein S. J Biol Chem. 1991;266:24540–24548. [PubMed] [Google Scholar]
- 5.Chacon E, Reece J M, Nieminen A L, Zahrebelski G, Herman B, Lemasters J J. Biophys J. 1994;66:942–952. doi: 10.1016/S0006-3495(94)80904-X. [DOI] [PMC free article] [PubMed] [Google Scholar]
- 6.Seksek O, Biwersi J, Verkman A S. J Biol Chem. 1995;270:4967–4970. doi: 10.1074/jbc.270.10.4967. [DOI] [PubMed] [Google Scholar]
- 7.Kim J H, Lingwood C A, Williams D B, Furuya W, Manolson M F, Grinstein S. J Cell Biol. 1996;134:1387–1399. doi: 10.1083/jcb.134.6.1387. [DOI] [PMC free article] [PubMed] [Google Scholar]
- 8.Demaurex N, Furuya W, D’Souza S, Bonifacino J S, Grinstein S. J Biol Chem. 1998;273:2044–2051. doi: 10.1074/jbc.273.4.2044. [DOI] [PubMed] [Google Scholar]
- 9.Wachter R M, King B A, Heim R, Kallio K, Tsien R Y, Boxer S G, Remington S J. Biochemistry. 1997;36:9759–9765. doi: 10.1021/bi970563w. [DOI] [PubMed] [Google Scholar]
- 10.Patterson G H, Knobel S M, Sharif W D, Kain S R, Piston D W. Biophys J. 1997;73:2782–2790. doi: 10.1016/S0006-3495(97)78307-3. [DOI] [PMC free article] [PubMed] [Google Scholar]
- 11.Heim R, Tsien R Y. Curr Biol. 1996;6:178–182. doi: 10.1016/s0960-9822(02)00450-5. [DOI] [PubMed] [Google Scholar]
- 12.Ormö M, Cubitt A B, Kallio K, Gross L A, Tsien R Y, Remington S J. Science. 1996;273:1392–1395. doi: 10.1126/science.273.5280.1392. [DOI] [PubMed] [Google Scholar]
- 13.Roth J, Berger E G. J Cell Biol. 1982;93:223–229. doi: 10.1083/jcb.93.1.223. [DOI] [PMC free article] [PubMed] [Google Scholar]
- 14.Hurt E C, Pesold-Hurt B, Suda K, Oppliger W, Schatz G. EMBO J. 1985;4:2061–2068. doi: 10.1002/j.1460-2075.1985.tb03892.x. [DOI] [PMC free article] [PubMed] [Google Scholar]
- 15.McCaffery J M, Farquhar M G. Methods Enzymol. 1995;257:259–279. doi: 10.1016/s0076-6879(95)57031-4. [DOI] [PubMed] [Google Scholar]
- 16.Velasco A, Hendricks L, Moremen K W, Tulsiani D R P, Touster O, Farquhar M G. J Cell Biol. 1993;122:39–51. doi: 10.1083/jcb.122.1.39. [DOI] [PMC free article] [PubMed] [Google Scholar]
- 17.Miyawaki A, Llopis J, Heim R, McCaffery J M, Adams J A, Ikura M, Tsien R Y. Nature (London) 1997;388:882–887. doi: 10.1038/42264. [DOI] [PubMed] [Google Scholar]
- 18.Ward W W, Prentice H J, Roth A F, Cody C W, Reeves S C. Photochem Photobiol. 1982;35:803–808. [Google Scholar]
- 19.Boron W F, De Weer P. J Gen Physiol. 1976;67:91–112. doi: 10.1085/jgp.67.1.91. [DOI] [PMC free article] [PubMed] [Google Scholar]
- 20.Girotti M, Banting G. J Cell Sci. 1996;109:2915–2926. doi: 10.1242/jcs.109.12.2915. [DOI] [PubMed] [Google Scholar]
- 21.Glickman J, Croen K, Kelly S, Al-Awqati Q. J Cell Biol. 1983;97:1303–1308. doi: 10.1083/jcb.97.4.1303. [DOI] [PMC free article] [PubMed] [Google Scholar]
- 22.Bowman E J, Siebers A, Altendorf K. Proc Natl Acad Sci USA. 1988;85:7972–7976. doi: 10.1073/pnas.85.21.7972. [DOI] [PMC free article] [PubMed] [Google Scholar]
- 23.Cain C C, Sipe D M, Murphy R F. Proc Natl Acad Sci USA. 1989;86:544–548. doi: 10.1073/pnas.86.2.544. [DOI] [PMC free article] [PubMed] [Google Scholar]
- 24.Zha X, Chandra S, Ridsdale A J, Morrison G H. Am J Physiol. 1995;268:C1133–C1140. doi: 10.1152/ajpcell.1995.268.5.C1133. [DOI] [PubMed] [Google Scholar]
- 25.Pezzati R, Bossi M, Podini P, Meldolesi J, Grohovaz F. Mol Biol Cell. 1997;8:1501–1512. doi: 10.1091/mbc.8.8.1501. [DOI] [PMC free article] [PubMed] [Google Scholar]
- 26.Morris S J, Wiegmann T B, Welling L W, Chronwall B M. Methods Cell Biol. 1994;40:183–220. doi: 10.1016/s0091-679x(08)61115-2. [DOI] [PubMed] [Google Scholar]
- 27.Kneen M, Farinas J, Li Y, Verkman A S. Biophys J. 1998;74:1591–1599. doi: 10.1016/S0006-3495(98)77870-1. [DOI] [PMC free article] [PubMed] [Google Scholar]
- 28.Dickson R M, Cubitt A B, Tsien R Y, Moerner W E. Nature (London) 1997;388:355–358. doi: 10.1038/41048. [DOI] [PubMed] [Google Scholar]


