

Abstract
We have assessed the role of activity in the adult frog visual system in modulating two aspects of neuronal plasticity: neurotransmitter expression and topographic map maintenance. Chronic treatment of one tectal lobe with the non-NMDA receptor antagonist, 6-cyano-7-nitroquinoxaline-2,3-dione decreased the percentage of substance P-like immunoreactive (SP-IR) tectal cells in the untreated lobe while disrupting topographic map formation in the treated one. Treatment with the NMDA receptor antagonistd-(−)-2-amino-5-phosphonovaleric acid (d-AP-5) disrupted the topographic map but had no affect on SP-IR cells. These results indicate that maintenance of the topographic map is dependent on direct input from the glutamatergic retinal ganglion cells, whereas substance P (SP) expression is being regulated by a pathway that relays activity from one tectal lobe to the other. Such a pathway is provided by the cholinergic nucleus isthmi, which is reciprocally connected to the ipsilateral tectum and sends a projection to the contralateral one.
Mecamylamine and atropine, antagonists of nicotinic and muscarinic receptors, respectively, were used together to block all cholinergic activity or alone to block receptor subclass activity. All three treatments decreased SP expression and disrupted the topographic map in the treated tectal lobe. We conclude that both SP expression and topographic map maintenance in the adult optic tectum are activity-dependent processes. Although our results are consistent with the maintenance of the topographic map through an NMDA receptor-based mechanism, they suggest that SP expression is regulated by a cholinergic interaction that depends on retinal ganglion cell input only for its activation.
Keywords: NMDA receptor, non-NMDA receptor, muscarinic receptor, nicotinic receptor, neurotransmitter expression, Elvax, optic tectum, retinotectal topography, nucleus isthmi, visual plasticity, neuropeptides, autoradiography, pipiens
Understanding the extent to which the nervous system can be changed by the signals it receives and transmits is of great interest. The visual system has served for some time as a model system in which to investigate how neuronal activity patterns can result in alterations in cellular properties that underlie neuronal function (Constantine-Paton et al., 1990; Shatz, 1990). Much of this work has involved looking at the structural reorganization that occurs as a consequence of the ability of presynaptic neurons to effectively drive their postsynaptic targets. A major component of this reorganization is the creation of topographic maps of visual space (Udin and Fawcett, 1988). This entails the precise ordering of terminals and synaptic contacts within a target in such a way as to recreate the spatial relationships that exist more peripherally in the system.
The degree to which other phenotypic characteristics of targets can be altered by visual activity has received less attention. Among the most prominent characteristics of a neuron is the neurotransmitter that it expresses. Neurons have the capability to change both the type and amount of several expressed neurotransmitters, including substance P (SP; Adler et al., 1984; Cowen and Gavazzi, 1998). However, the events leading to such changes in living animals are not well understood.
A number of in vitro studies have suggested that SP expression can be regulated by activity (Kessler et al., 1981; Roach et al., 1987; Sun et al., 1992; Hodie et al., 1995), and results obtainedin vivo with either nerve transection or tetrodotoxin (TTX) injections are consistent with this idea (Kessler and Black, 1982;Hendry et al., 1988; Kessler and Freidin, 1991; Benson et al., 1994). Nevertheless, the interpretation of such experiments has been complicated by the demonstration that substances associated with injury can dramatically affect the level of SP expression (Kessler and Freidin, 1991; Jonakait, 1993; Zigmond and Sun, 1997). Furthermore, blocking neuronal activity with TTX also blocks any presynaptic activity-dependent release of substances, such as neurotrophins (Thoenen, 1995), which may themselves regulate SP expression (Lindsay and Harmar, 1989; Croll et al., 1994; Carnahan and Nawa, 1995;Yao et al., 1997).
The visual system of the frog provides an opportunity to examine howin vivo depolarizing activity changes SP expression. Previously we have found that optic nerve transection decreases SP expression in neurons in the tectal lobe still receiving visual input (Liu and Debski, 1996). The known pharmacology of the frog visual pathways (Desan et al., 1987; Hickmott and Constantine-Paton, 1993), combined with a chronic drug release technique (Cline et al., 1987), allows us to selectively block activity evoked by signals from different tectal afferents. We can thus evaluate the degree to which such pathways regulate SP expression in the presence of presynaptic activity and the absence of injury responses that accompany axotomy.
We report the results of experiments that indicate that neural activity within a particular and defined pathway regulates both the activity-dependent maintenance of the retinotectal visual map and tectal SP expression.
MATERIALS AND METHODS
Experiments were conducted on adult Rana pipiensfrogs ∼2.5 inches in length using protocols approved by the Institutional Animal Care and Use Committee at the University of Kentucky. The animals were purchased from Charles D. Sullivan (Nashville, TN) and housed in 10 gallon glass tanks that had both a dry and wet area. They were kept at room temperature and fed with live mealworms.
Preparation and Implantation of Elvax. Retinal ganglion cells release glutamate onto tectal cells (Hickmott and Constantine-Paton, 1993) while the nucleus isthmi releases acetylcholine (Desan et al., 1987). To determine the effect of activity on topographic map maintenance and SP expression, we chronically treated the tecta of living animals with either glutamatergic or cholinergic receptor antagonists. This was done by embedding these drugs into the slow-release plastic, Elvax, and then implanting slices of this Elvax over the tecta of living animals (Silberstein and Daniel, 1982; Cline et al., 1987). 6-cyano-7-nitroquinoxaline-2,3-dione (CNQX) was used to block non-NMDA receptors, whereas NMDA receptors were blocked with d-(−)-2-amino-5-phosphonovaleric acid (d-AP-5). Mecamylamine and atropine sulfate salt were either embedded separately to block nicotinic or muscarinic receptor activity, respectively, or together, to block all cholinergic activity. To control for any effect produced by the Elvax or the implantation procedure itself, Elvax containing only the drug vehicle (water or DMSO) or the inactive isomer, l-AP-5, was also prepared (see below). The final embedded concentrations of CNQX,d-AP-5, and l-AP-5 were 0.1 mm, whereas mecamylamine was used at 15 mm and atropine at 0.3 mm. These concentrations were chosen based on those used in electrophysiological experiments in slice preparations and observations that from 0.2–0.8% of the original drug concentration is released daily from the Elvax (Cline and Constantine-Paton, 1989; Krewson and Saltzman, 1996) (C. M. Butt and E. A. Debski, unpublished observations). CNQX and mecamylamine were purchased from Research Biochemicals (Natick, MA). All other drugs were purchased from Sigma (St. Louis, MO).
Elvax plastic polymer was prepared as described elsewhere by washing the plastic beads in several changes of 95% alcohol for a week (Silberstein and Daniel, 1982; Cline and Constantine-Paton, 1989; Smith et al., 1995). After the beads were dried, they were dissolved in methylene chloride (0.2 gm/2 ml solvent). Receptor antagonists were dissolved in either 50 μl of distilled water (d-AP-5,l-AP-5, mecamylamine, and atropine) or 100 μl of dimethylsulfoxide (DMSO) (CNQX) in accordance with their solubility and then added to the Elvax mixture. Fast green, 0.01% final concentration, was also added to visualize the Elvax. The mixture was then vortexed, frozen quickly in a dry ice/acetone bath, and kept at −80°C for 2 d. It was then transferred to a prechilled glass Petri dish and vacuumed in a desiccator at −18°C for 3 d after which it was cut into 30 μm slices using a vibratome. It was implanted into animals within 1 week.
For Elvax implantation, animals were anesthetized with a 2% ethyl m-aminobenzoate (MS222) intraperitoneal injection (0.1 ml/15 gm body weight). The skin covering the tectum was deflected, and the underlying skull was opened with a dental drill. The dura mater was opened, and the pia mater was peeled away as much as possible. An Elvax slice containing either a drug or vehicle was then placed over one tectal lobe, covering most of its surface. The dura and remaining pia mater were used to hold the Elvax in place. The skin was reflected over the wound and sealed by Vetbond Tissue Adhesive (3M Animal Care, St. Paul, MN). Animals were allowed to survive for 6 weeks, after which, half were killed for SP immunocytochemical study. The others were used to test topographic map integrity as described below.
Immunocytochemistry. After anesthetization with a 2% MS222 intraperitoneal injection, animals were perfused with PBS followed by 4% paraformaldehyde in PBS. The brain was removed after the area covered with Elvax was marked by Xerox dry dye. The brain was fixed in 4% paraformaldehyde for 4 hr at room temperature or overnight at 4°C and then sunk in 30% sucrose for the same period of time. The tissue was embedded in O.C.T. medium (VWR, Oak Ridge, TN) and sectioned sagittally on a cryostat at 20 μm. If the sections were not used immediately, they were stored at −18°C.
Sections from the Elvax-covered area and from the analogous area in the contralateral tectum were selected for immunocytochemical procedures. After rehydration with 0.1 m PBS, the sections were incubated with monoclonal substance P antibodies (Accurate Chemical, Westbury, NY) diluted 1:200 with 0.3% Triton X-100 and 10% normal goat serum in 0.1 m PBS (Debski et al., 1995). After washing in PBS, the sections were incubated in the dark with fluorescein-coupled secondary antibodies (Cappel, Durham, NC) diluted 1:100 in 0.3% Triton X-100 in PBS. Both primary and secondary incubations were performed in a humidified chamber either at room temperature for 4 hr or overnight at 4°C. The sections were then washed with PBS and coverslipped with Fluoromount G mounting medium (Fisher Scientific, Pittsburgh, PA) for viewing under a fluorescent microscope. Omission of the primary antibodies eliminated the observed staining patterns.
In the tectum, SP-immunoreactive (IR) cells are found only within its main cellular layer, layer 6 (Kuljis and Karten, 1982). Because SP-IR cells are distributed nonuniformly within the tectum in anterior to posterior and lateral to medial gradients (Debski et al., 1995), care was taken to compare matching tectal regions under control and experimental conditions. The percentage of SP-IR cells was determined by counting SP-IR cells and then all tectal cells in layer 6 within a rectangular sample area (width, 219 μm; height, 312 μm) and a single focal plane. With one exception, these sampled areas were located in either central or lateral tectal sections (Tu and Debski, 1999). SP-IR profiles coincident with a clear soma outline, as determined under Nomarski optics, were counted as SP-IR cells. This group included both intensely and weakly stained cells. To examine the spatial properties of Elvax treatment, SP-IR cells in one group of animals were counted in medial tectum, a region not covered by Elvax. In this and in all other treatment groups, at least four alternate sections were counted for each animal. These sections yielded independent measurements because sampling was a minimum 20 μm apart, and the true diameter of SP-IR cells was 7.6 μm, as calculated by measuring the diameters of 124 SP-IR profiles in four adjacent sections (Smolen et al., 1983). The measurements were converted to percentages and then averaged together to provide one value for that animal for each tectal area sampled. Data from all animals with the same treatment were then averaged with regard to tectal area and compared to the values obtained in the analogous areas of the untreated contralateral tectum of the same animals.
Values given in the text are ±SEM, and significance was determined by paired t tests unless otherwise stated. No significant differences were found in the total number of layer 6 cells present in the sampled areas in any of the drug or vehicle treatments. Therefore, changes in the percentage of SP-IR cells represent changes in SP expression rather than changes in the overall cell population number.
Retrograde HRP labeling. To determine the effect of the various drug treatments on topographic map order, we injected horseradish peroxidase (HRP) into defined tectal sites to label the retinal ganglion cells that projected to these sites.
Animals in which Elvax had been implanted were anesthetized as described above. The tectum was exposed, and the placement of the Elvax below the dura mater and over the dorsal surface of only one tectal lobe was verified. The Elvax was then removed, and HRP was injected with a Picospritzer (General Valve, Fairfield, NJ) into the superficial layer of the previously covered anterior medial tectum using injection pipettes that had been pulled on a horizontal pipette puller PLU-1 (World Precision Instruments, Sarasota, FL). These pipettes were filled with 20% HRP in a 50 mm Tris buffer with NaCl (100 mm), and their tips were broken with a pair of forceps immediately before injections to a diameter of ≤50 μm (Cline and Constantine-Paton, 1989). The non-Elvax tectum was also injected at the analogous position with the same HRP injection pipette. The skin was reflected, and the wound was sealed with Vetbond Tissue Adhesive. After a survival period of 8 d that allowed for HRP transport to the retina, the animals were injected with MS222 and placed in the dark for 45 min. They were then perfused through the heart with Ringer's solution followed by 0.5% 3,3′-diaminobenzidine (DAB; Sigma) in Tris/NaCl buffer. The retinas were removed, placed in Ca2+- and Mg2+-free HEPES buffer solution for 15 min, and then separated from the rest of the eye in chilled Ringer's solution. The tecta were removed from the rest of the brain, and the dura and pia maters were peeled away. The retinas and tecta were reacted with DAB and flat-mounted between two coverslips. The mounted retinas and tectal lobes were then fixed in 2% paraformaldehyde and 2% glutaraldehyde in 0.1 m PBS for 15–30 min.
Camera lucida drawings outlining the tectum, retina and the injection site and showing the distribution of HRP-labeled retinal ganglion cells were made. The percentage of tectum covered by the injection site and the percentage of retina covered by the labeled retinal ganglion cells were then calculated from measurements taken with NIH Image version 1.61 (National Institutes of Health Website). Values given are again ±SEM, and paired t tests were used to determine significance. Only animals with similar HRP injection site sizes and placements were used in the analysis.
Cholinergic receptor autoradiography. The location of all nicotinic and muscarinic acetylcholine receptor-binding sites in the tectum was determined by digital imaging, which allowed the results of standard receptor autoradiography and tissue staining to be superimposed.
After animals were anesthetized with MS222 as described above, their chest cavities were opened, and they were perfused through the conus arteriosus with ice-cold (4°C) buffer (Tris-HCl 50 mm and NaCl 100 mm, pH 7.4). The brains were extracted, the dura mater and pia mater were removed, and the unfixed tissue was quick-frozen in −25°C isopentane. The frozen brains were then cut sagittally into 20 μm sections, thaw-mounted on Superfrost Plus slides, and dried overnight in a vacuum desiccator at 4°C. The mounted sections were stored at −80°C until use or directly prepared for radioligand binding the next day.
Receptor autoradiography was performed using standard methods (Happe et al., 1994; Aubert et al., 1996). Briefly, the tissue was slowly brought to room temperature, preincubated in buffer for 15 min, and then incubated in a buffer solution containing radioligand. [3H]nicotine (2 nm; 81.5 Ci/mmol) was used to visualize nicotinic receptor-binding sites and [3H]N-methylscopolamine (NMS; 2.5 nm; 82.0 Ci/mmol) was used to label muscarinic sites. Both radioligands were purchased from New England Nuclear (Boston, MA). Experiments with [3H]nicotine were run for 90 min at 4°C and were terminated by a 5 min wash in fresh buffer solution, a 5 min wash in 10% buffer, and a 10 sec dip in deionized water. Nonspecific binding was determined on adjacent tissue sections by the addition of excess cytisine (10 μm) to the radioligand solutions. Experiments using [3H]NMS lasted for 90 min at room temperature and were ended with the same post-washes described above. Nonspecific binding in these muscarinic experiments was determined with excess atropine sulfate (10 μm). After washing, the tissue was dried under a gentle stream of ambient air and placed in a vacuum desiccator overnight at room temperature. The following day quantitative standards (Amersham, Arlington Heights, IL) and the treated tissue were set together against3H-Hyperfilm (Amersham). The film was exposed for an appropriate length of time (generally 6 weeks for [3H]nicotine and 2 weeks for [3H]NMS), and the resulting autoradiograms were captured digitally for analysis. Finally, the treated tissue was defatted with xylene and ethanol and Nissl-stained with thionin (Clarke et al., 1985). The bright-field images of the stained tissue were then captured for morphological analysis. All images were captured using a digital camera (model CCD100; Dage, Michigan City, IN) connected to an Apple PowerPC running NIH Image version 1.61. The images were then aligned and printed with Adobe Photoshop 5.0.
RESULTS
SP expression is regulated by non-NMDA glutamate receptor activity
The optic tectum of the frog is a laminated structure consisting of alternating cellular and plexiform layers (Székely and Lázár, 1976). SP is expressed in a subpopulation of tectal neurons found exclusively in layer 6 (Kuljis and Karten, 1982). Our previous work has shown that unilateral optic nerve transection decreases the percentage of SP-IR cells in the afferented tectum but leaves the deafferented tectum unchanged (Liu and Debski, 1996). This suggests that SP expression in tectal cells is regulated by activity that is relayed from one tectal lobe to the other. To demonstrate directly the role of activity in regulating SP expression, we investigated this expression in animals in which one tectal lobe was chronically exposed to either the non-NMDA receptor antagonist (CNQX) or the NMDA receptor antagonist (d-AP-5) for a period of 6 weeks. Blocking non-NMDA receptor activity should eliminate most retinal ganglion cell-driven tectal activity because non-NMDA receptors carry most of the synaptic current involved in retinotectal transmission (Hickmott and Constantine-Paton, 1993).
Comparison of the CNQX-treated tectum and the non-Elvax tectum in the analogous areas within each animal indicated that there were fewer SP-IR cells in the non-Elvax tectum (Fig.1A,B). This difference was dependent on exposure to CNQX because no difference was observed in animals treated with vehicle Elvax (Fig. 1C,D). There was no difference in the number of SP-IR cells between the Elvax tectum and the non-Elvax tectum in the animals treated with eitherd-AP-5 or its inactive isomerl-AP-5 (Fig.2A–D). These qualitative differences were confirmed by quantitative analysis. Treatment of one tectal lobe with CNQX (Fig.3A) resulted in a percentage of SP-IR cells in layer 6 of non-Elvax tectum (4.15 ± 0.86%) that was significantly lower than that in the Elvax tectum (9.74 ± 0.72%; p < 0.002). This difference was attributable to a selective decrease in SP-IR cells because there was no change in the total number of layer 6 cells within the sampled area (CNQX-treated lobe, 151 ± 13; non-Elvax lobe, 148 ± 6). In agreement with the previous optic nerve lesion studies, comparison with data from vehicle-treated animals indicated that the change produced by chronic treatment with CNQX was a decrease in SP-IR cells in the tectal lobe that was not directly exposed to the drug: for vehicle-treated animals, the percentage of SP-IR cells in a region under the Elvax was 11.22 ± 2.25% compared to 11.13 ± 1.40% in the analogous region of the non-Elvax tectum.
Fig. 1.

Blocking non-NMDA receptor activity alters the number of SP-IR cells in the optic tectum. Animals had either CNQX-containing Elvax (A) or vehicle-containing Elvax (C) implanted over one tectal lobe and nothing placed over the other one (B orD). In CNQX-treated animals, the number of SP-IR cells in layer 6 is much lower in the tectum without Elvax (B) than in the tectum with Elvax (A). In animals treated with vehicle-containing Elvax, there is no difference between the number of SP-IR cells in each of the tectal lobes (C and D).A and B are from lateral middle tectal regions, whereas C and D are from central middle regions. These were the regions covered by Elvax in the tectal lobe containing Elvax. Photographs taken in the same animal were exposed for the same period of time. L 6, Layer 6. Scale bar, 50 μm.
Fig. 2.

Blocking NMDA receptor activity does not affect the SP-like immunoreactivity of tectal cells. Animals had Elvax containing either d-AP-5 (A) or its biologically inactive isomer l-AP-5 (C) implanted over one tectal lobe and nothing put over the other one (B and D). No difference is evident in the number of SP-IR cells in layer 6 with either of these treatments. All photographs were taken in the central middle tectal regions, which were covered by Elvax in the Elvax-containing tectum. Photographs within the same animal were exposed for the same period of time. Scale bar, 50 μm.
Fig. 3.

Tectal cell SP-like immunoreactivity is affected by blocking non-NMDA (A) but not NMDA receptor activity (B). A, The percentage of SP-IR cells in layer 6 of the non-Elvax tectal lobe is much lower than that in the CNQX-treated lobe (p < 0.0035). There is no difference in SP-like immunoreactivity in the tecta of the vehicle-treated animals. B, Treatment with eitherd-AP-5 or l-AP-5 does not change the percentage of SP-IR cells in layer 6. Data were collected from central middle tectal regions in A and from lateral middle regions inB, which were the areas covered by Elvax in the Elvax-containing tectum. Error bars indicate SEM.
Treatment with either d-AP-5 or l-AP-5 did not produce any change in the percentage of SP-IR cells. Ind-AP-5-treated animals (Fig. 3B), the mean percentage of SP-IR cells was 13.20 ± 1.12% in the Elvax tectum versus 12.47 ± 0.86% in the non-Elvax tectum; inl-AP-5-treated animals, 12.17 ± 0.73% of cells in layer 6 were SP-IR in the Elvax tectum versus 11.57 ± 0.59% in the non-Elvax tectum.
To determine how local the effect of the drug treatment was, areas not covered by Elvax were also studied in the CNQX-treated animals. While lateral and central regions were covered by Elvax in these animals, the medial regions were not. The presence of drug-containing Elvax had no effect on SP expression in medial regions (Fig.4). Furthermore, the mean percentage of SP-IR cells in the medial areas of Elvax and non-Elvax-covered tectal lobes in CNQX-treated animals was also essentially identical to that found in the vehicle-treated animals (Fig. 4). These results confirm that the effective area of drug treatment was limited to the area covered by Elvax.
Fig. 4.

The effects of Elvax containing CNQX are local. The SP-like immunoreactivity of tectal cells in the treated lobe in a region not directly covered by Elvax is similar to that in the analogous region of the untreated lobe. SP-IR cells were compared in middle medial regions, an area of tectum not covered by the Elvax slab in the treated tectal lobe. The percentage of SP-IR cells in layer 6 of the non-Elvax tectum is nearly identical to that found in the Elvax tectum and close to that found in comparable areas of the vehicle-treated animals. Error bars indicate SEM.
Glutamate receptor antagonists disrupt retinal ganglion cell topography
Despite the fact that treatment with d-AP-5 did not change tectal cell SP-IR expression in the adult, it was able to disrupt the topographic map created by retinal ganglion cell terminals at the tectum, as previously reported in the developing visual system (Cline and Constantine-Paton, 1989). This disruption occurred in thed-AP-5-treated tectum and was also seen in animals treated with CNQX. Map disruption was assessed by measuring the degree of scatter of retinal ganglion cell bodies labeled retrogradely with HRP injected from a specific site in the tectum. If the map is intact, labeled retinal ganglion cells will be clustered together and occupy a small area of the tectum. If the map has been disrupted, those retinal ganglion cells will be scattered over a much larger retinal area (Cook and Rankin, 1986; Cline and Constantine-Paton, 1989).
In the animals treated with CNQX or d-AP-5, the area occupied by HRP-labeled retinal ganglion cell bodies in the retina having projections to the Elvax tectum was much bigger than that in the retina having projections to the tectum without Elvax (Fig.5B,D). The area occupied by HRP-labeled retinal ganglion cells was similar between the two retinas in the control animals whose tecta were treated with either vehicle- orl-AP-5 (Fig. 5A,C). In the animals treated with CNQX (Fig.6B), the percentage of area containing HRP-labeled retinal ganglion cells in the retina projecting to the Elvax-treated tectal lobe (Elvax retina, 4.80 ± 0.88%) was significantly higher (p < 0.006) than that in the retina projecting to the non-Elvax-treated lobe (non-Elvax retina, 1.32 ± 0.18%). This difference was dependent on exposure to CNQX because the percentage of area in the vehicle-Elvax retina (2.98 ± 0.58%) was not different from that in the non-Elvax retina (3.69 ± 0.82%) in control animals (Fig.6A). In the animals treated withd-AP-5 (Fig. 6D), the percentage of area containing HRP-labeled retinal ganglion cells was significantly higher (p < 0.03) in the Elvax retina (6.35 ± 1.39%) than that in the non-Elvax retina (1.25 ± 0.05%). Animals treated with the inactive isomerl-AP-5 (Fig. 6C), had no such difference between the two retinas (Elvax retina, 1.53 ± 0.62%; non-Elvax retina, 1.65 ± 0.47%).
Fig. 5.

CNQX and d-AP-5 treatment disrupts retinotectal topography in the adult frog. Representative camera lucida drawings show retinas and tectal injection sites for vehicle- (A), CNQX- (B),l-AP-5- (C), and d-AP-5- (D) treated animals. Retinal ganglion cell bodies were retrogradely labeled by local injection of HRP in the contralateral anterior medial region of each tectal lobe. The injection size and location is shown (shaded areas) in the flat-mounted tectal tissue. In the vehicle- andl-AP-5-treated animals (A, C), the area occupied by HRP-labeled retinal ganglion cells in the retina projecting to the Elvax-covered tectum (Elvax retina) is similar to that in the retina projecting to the tectal lobe without Elvax (non-Elvax retina). In the animals treated with Elvax containing CNQX (B) or d-AP-5 (D), the area occupied by HRP-labeled retinal ganglion cells in the Elvax retina is much bigger than that in the non-Elvax retina. HRP-labeled retinal ganglion cells are represented bysmall black dots in the retinas; injection sites are represented by black shaded areas in the tecta. The orientation of retinas or tecta is indicated at thebottom of the figure. The scale bar applies only to the retina and tectum and not to the retinal ganglion cells.
Fig. 6.

Summary graphs indicating that retinotectal topography is disrupted by both non-NMDA and NMDA receptor antagonists (CNQX and d-AP-5). Elvax containing either vehicle (A) or l-AP-5 (C) has no effect on retinotectal topography. In animals whose tecta were treated with Elvax containing either CNQX (B) or d-AP-5 (D), the percentage of the area occupied by HRP-labeled retinal ganglion cells is bigger in the retina having projections to the tectum with Elvax than in the retina having projections to the tectum without Elvax. The difference between the two retinas is significant in both group of animals (p < 0.006 in CNQX-treated animals;p < 0.03 in d-AP-5 treated animals). Error bars indicate SEM.
Cholinergic receptors in the optic tectum
The demonstration that the number of SP-IR tectal cells was reduced by exposing the opposite tectal lobe to CNQX suggested that SP expression was being regulated by activity that was being relayed from one tectal lobe to the other. One structure that could be performing this function is the nucleus isthmi. This bilateral midbrain structure has reciprocal connections with the ipsilateral tectal lobe and sends a projection to the contralateral lobe (Grobstein et al., 1978; Gruberg and Udin, 1978; Grobstein and Comer, 1983). The nucleus isthmi supplies almost all of the acetylcholine in the tectum (Ricciuti and Gruberg, 1985; Desan et al., 1987; Wallace et al., 1990; Marín and González, 1999). To determine if the nucleus isthmi was involved in the regulation of SP-IR expression, we needed to know what types of cholinergic receptors were present in the optic tectum to mediate this signal.
Neuronal cholinergic receptors are divided into two major subtypes: nicotinic and muscarinic. Autoradiography was performed to determine the existence and location of these two types of receptors in the laminated optic tectum. [3H]Nicotine was used to examine the distribution of nicotinic receptors while [3H]NMS was used for muscarinic receptors. The localization of radioligand binding to the individual tectal layers was accurately determined by superimposing the autoradiographic images taken from the optic tectum over the stained, bright-field images of the same tissue sections that produced the autoradiograms.
The optic tectum consists of nine alternating cellular and plexiform layers (Székely and Lázár, 1976). Most of the cell bodies of tectal neurons are found in layer 6. These cells send processes to more superficial layers where they intersect with various tectal inputs. Retinal ganglion cell terminals are restricted to the most superficial layers of the tectum, layers 8 and 9 (Hughes, 1990). Terminals from the nucleus isthmi are also found in both of these layers (Gruberg and Udin, 1978; Gruberg et al., 1989, 1994; Udin et al., 1990).
Both nicotinic and muscarinic receptors were present in the optic tectum, but the binding patterns of the two receptor classes were markedly different (Fig. 7). [3H]Nicotine (2 nm) bound at high density in a band restricted to a portion of tectal layer 9 (Fig.7A,C). A band of intermediate binding, residing in layer 8, was located adjacent to it. These two bands were seen across the entire rostrocaudal axis of lateral sections of the tectum with little observable change in density or width. However, in more medial sections the binding in layers 8 and 9 did not reach the posterior extent of the tectum, and the bands became thinner (data not shown). This result was consistent with the thinning and shortening of the retinorecipient layers in more medial areas (Scalia, 1976). Layers 1–7 had very low levels of [3H]nicotine-binding sites, and their density and distribution did not change along the rostrocaudal or lateromedial axes. Nonspecific binding, as determined by the addition of excess cytisine (10 μm) was not detected when [3H]nicotine was used at 2 nm (Fig. 7D). However, increasing the radioligand concentration above 5 nm resulted in nonspecific binding that was ≥5% of the total binding (data not shown).
Fig. 7.
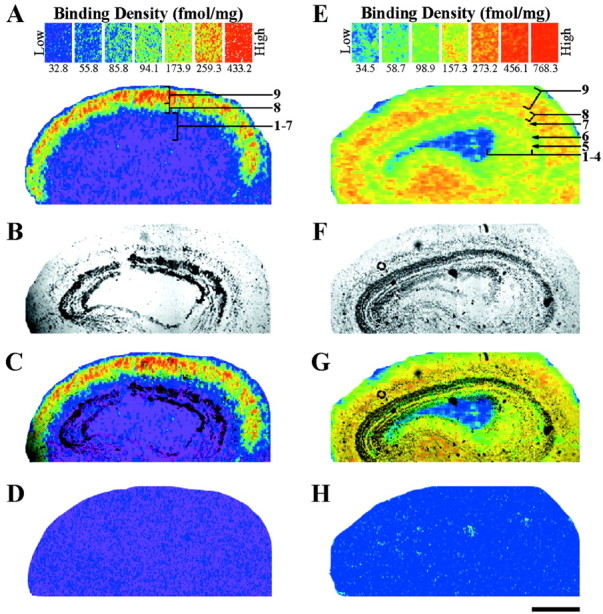
Localization of nicotinic (A, C) and muscarinic (E, G) acetylcholine receptor-binding sites in the adult optic tectum. A, Autoradiogram of specific [3H]nicotine (2 nm) binding in the optic tectum. Nicotinic-binding sites are most dense (red–orange) in layer 9. Layer 8 has intermediate densities (yellow–green), whereas layers 1–7 have virtually none (blue–purple). B,Bright-field image of the same tissue section that produced the autoradiogram (A). C,Superimposing A and B with Adobe Photoshop 5.0 accurately localizes the binding to specific, tectal layers. D, Nonspecific binding, as determined by the addition of cytisine (10 μm) to the incubation solution, is not detected when using [3H]nicotine at 2 nm. E, Specific binding of [3H]NMS (2.5 nm) shows the distribution of muscarinic receptors in the optic tectum. The most dense binding (red–orange) is seen in the superficial layers (7–9) and plexiform layer 5, but the binding is less robust (yellow–green) in the layers 1–4 and 6.F, Bright-field image of the section used to produce the autoradiogram in E. G, Layer-specific binding as determined by superimposing E andF. H, Competition of [3H]NMS (2.5 nm) with excess atropine sulfate (10 μm) results in a blank autoradiogram. Scale bar, 500 μm.
[3H]NMS (2.5 nm) binding was present in every layer throughout the optic tectum (Fig.7E,G). The muscarinic binding pattern was strongest in layers 7–9 as well as plexiform layer 5. Less dense, but appreciable binding was present in layers 1–4 and 6. No observable change occurred in the density of the binding sites along the rostrocaudal or lateromedial axes. Nonspecific binding was not present. The addition of excess atropine sulfate (10 μm) to the radioligand solution resulted in a blank autoradiogram (Fig.7H). Use of even higher [3H]NMS concentrations (5–12 nm) resulted in no change in nonspecific binding values (data not shown).
SP expression is dependent on cholinergic receptor activity
To examine whether nucleus isthmi activity is involved in the regulation of SP-IR expression, mecamylamine, an antagonist of nicotinic receptors, and atropine, an antagonist of muscarinic receptors, were embedded together in the Elvax to block all cholinergic activity in the optic tectum. Elvax containing only vehicle was also implanted over the tectal lobes of some animals who acted as controls. In the animals treated with mecamylamine and atropine, comparison of the number of SP-IR cells in each tectal lobe indicated that there were fewer cells in the tectum with Elvax than in the untreated lobe (Fig.8C,D). Quantitative analysis of seven animals demonstrated that the mean percentage of SP-IR cells in the treated tectum (6.03 ± 0.88%) was indeed lower (p < 0.03) than that in the non-Elvax tectum (9.89 ± 0.33%; Fig. 9). Control experiments using vehicle Elvax demonstrated that these differences were not caused by the Elvax itself because there were no qualitative (Fig. 8A,B) or quantitative (Fig. 9) differences in the number of SP-IR cells in the Elvax and non-Elvax-containing tectal lobes of these animals.
Fig. 8.

The SP-like immunoreactivity of tectal cells is affected by blocking cholinergic receptor activity. Animals were implanted with Elvax containing either vehicle (A), mecamylamine and atropine (C), atropine (E), or mecamylamine (G) over one tectal lobe. The other lobe in each of the animals had no Elvax (B, D, F,H). Blocking all cholinergic receptors (Mec. + atropine) or blocking nicotinic (Mec.) or muscarinic (Atropine) receptors alone results in a decreased number of SP-IR cells in the tectal lobe treated with the drugs (C, E, G) when compared to the lobe within the same animals that was not exposed to drug-containing Elvax (D, F, H). The number of SP-IR cells in layer 6 is not different between the two tecta of the vehicle-treated animal (A, B). All photographs were taken in the central middle regions, which were covered by Elvax in the Elvax-containing tectum. Photographs from the same animal were exposed for the same period of time. Scale bar, 50 μm.Mec., Mecamylamine.
Fig. 9.

Tectal cell SP-like immunoreactivity is altered by blocking either all cholinergic receptor activity or nicotinic or muscarinic receptor activity alone. The percentage of SP-IR cells in layer 6 of the drug-treated tectum is lower and significantly different from that in the untreated tectum. Elvax without any drug (vehicle) produces no change in the percentage of SP-IR cells. All data were collected from central middle tectal regions, which were covered by Elvax in the Elvax-containing tectum. Atro., Atropine. Error bars indicate SEM.
To determine if the effect of total cholinergic receptor blockade was attributable predominantly to the inactivation of only one of the two cholinergic receptor subclasses, tecta were also treated separately with either mecamylamine or atropine. In animals treated with mecamylamine, the number of SP-IR cells in the treated tectum appeared dramatically lower than in the analogous contralateral tectal region (Fig. 8G,H). When quantified, the mean percentage of SP-IR cells in the treated tectum (4.15 ± 0.57%) was significantly lower (p < 0.00007) than in the tectum without drugs (10.39 ± 0.44%; Fig. 9). Similar results were obtained in animals treated with atropine (Fig.8E,F), although the magnitude of the difference between the two lobes was smaller than that obtained with either mecamylamine or both mecamylamine and atropine. The mean percentage of SP-IR cells in the drug-treated tectum was 7.50 ± 0.64%, whereas in the analogous region of the untreated tectum it was 10.44 ± 0.70% (Fig. 9). Although this difference was small, it was consistently seen in all atropine-treated animals. Consequently, the difference between the two tecta was highly significant (p < 0.0004).
Comparison of the mecamylamine-alone and atropine-alone results using an unpaired, two-tailed t test indicated that they were highly significantly different from one another (p < 0.005). Results obtained by treatment with mecamylamine plus atropine were not significantly different from those obtained with either agent applied alone.
Cholinergic receptor antagonists disrupt retinal ganglion cell topography
We also examined the effect of cholinergic receptor antagonist treatments on the integrity of the retinotectal topographic map. Map integrity was not affected by vehicle-treated tecta because no qualitative (Fig.10A) or quantitative (Fig. 11A) differences were seen between the Elvax and non-Elvax retinas of these animals. In animals whose tecta had been chronically treated with both atropine and mecamylamine, HRP-labeled retinal ganglion cell bodies always occupied a much larger area in the Elvax retina than in the non-Elvax one (Fig. 10B). The mean percentage of area in the Elvax retina (6.00 ± 0.16%) was significantly higher (p < 0.0002) than that in the non-Elvax retina (2.15 ± 0.10%; Fig. 11B). Similar results were seen in animals whose tecta had been chronically exposed to atropine (Fig. 10C). Quantitative analysis (Fig. 11C) demonstrated that the mean percentage of area in the Elvax retina (6.31 ± 0.76%) was also significantly higher (p < 0.0004) than that in the non-Elvax retina (2.83 ± 0.59%), confirming qualitative impressions. However, the effects of exposure to mecamylamine alone on the topographic map were not as obvious. In most of these animals (8 of 10), HRP-labeled retinal ganglion cell bodies occupied a larger area in the Elvax retina than in the non-Elvax one (as illustrated in Fig. 10D). In two of these animals, this difference was relatively large, but in the other six, it was <2%. In the remaining two animals, labeled retinal ganglion cells occupied a smaller area in the Elvax retina than in the non-Elvax one. The mean percentage of area for the entire sample (Fig.11D) was 3.89 ± 0.47% in the Elvax retina and 2.83 ± 0.27% in the non-Elvax one. This difference bordered on significance (p < 0.0539).
Fig. 10.

Blocking cholinergic activity disrupts retinotectal topography. Representative camera lucida drawings show that in the animals treated with vehicle (A), the area occupied by HRP-labeled retinal ganglion cells in the Elvax retina is similar to that in the non-Elvax retina. However, in the animals treated with Elvax containing both mecamylamine and atropine (B), or atropine (C) or mecamylamine (D) alone, the area occupied by HRP-labeled retinal ganglion cells in the Elvax retina is bigger than that in the non-Elvax retina. The drawings in each row are from the same animal. HRP-labeled retinal ganglion cells are represented bysmall black dots in the retinas; injection sites are represented by black shaded areas in the tecta. The orientation of retinas or tecta is indicated at thebottom of the figure. The scale bar applies only to the retina and tectum and not to the retinal ganglion cells.
Fig. 11.

Summary graphs indicating that retinotectal topography is disrupted by blocking cholinergic receptor activity. Mecamylamine or atropine was used to block nicotinic or muscarinic receptor activity, respectively. In vehicle-treated animals (A), the percentage of the area occupied by HRP-labeled retinal ganglion cells is similar between the two retinas. In the animals treated with mecamylamine and atropine together (B) or only atropine (C), the percentage of the area occupied by HRP-labeled retinal ganglion cells is much larger in the Elvax retina than in the non-Elvax one. This change in distribution is highly significant (B,p < 0.0002; C,p < 0.0004). In the animals treated with mecamylamine (D), the difference between the two retinas is smaller and barely reached significance (p < 0.0539). Error bars indicate SEM.
DISCUSSION
We have shown that both SP expression in tectal cells and maintenance of the topographic visual map are regulated by activity in the adult visual system. Furthermore, our results indicate that these two nervous system features, neurotransmitter expression and terminal placement, are dependent on different aspects of neuronal activity for their regulation.
SP expression is regulated by activity originating from the ipsilateral eye
Our previous work demonstrated that transection of the optic nerve causes a decrease in SP-IR cells in the innervated tectal lobe, whereas SP expression in the deafferented lobe is unaffected (Liu and Debski, 1996). Because each tectal lobe receives direct retinal input almost exclusively from the contralateral eye (Singman and Scalia, 1990), this result suggested to us that SP expression was being regulated by activity that was relayed between the two tectal lobes. In this study we have tested that idea directly by blocking activity at postsynaptic tectal sites.
Retinal ganglion cells release glutamate onto tectal cells, and most synaptic current is carried by non-NMDA receptor activity (Nistri et al., 1990; Hickmott and Constantine-Paton, 1993). Therefore, blocking non-NMDA receptor activity should eliminate most of the depolarization caused by glutamatergic transmission from the optic nerve. When we did this experiment, we obtained the same result as with optic nerve transection: SP expression was decreased in the untreated lobe (Fig.12A,B). Interestingly, this decrease was limited to a tectal area corresponding to the blocked region. We conclude that SP expression is regulated by depolarization of tectal cells and dependent on activity that is topographically relayed from one tectal lobe to the other.
Fig. 12.

Schematic drawing of the pathway through which SP expression in the optic tectum is regulated. A,Unilateral optic nerve transection causes the percentage of SP-IR cells in layer 6 to decrease in the afferented tectum (shaded). B, Chronic treatment with CNQX-containing Elvax (rectangle with solid line) results in a decrease in the percentage of SP-IR cells in layer 6 in the contralateral tectum without Elvax (shaded rectangle with dashed line). Notice that SP expression in the non-Elvax tectum is changed in the area analogous to the area under Elvax in the Elvax tectum. C, Chronic treatment with mecamylamine (nicotinic antagonist) and atropine (muscarinic antagonist) together or separately results in a decrease in SP expression in the treated tectum (shaded rectanglewith solid line). Glu, Glutamate;Ach, acetylcholine; NI, nucleus isthmi.
NMDA receptors are also present on tectal cell membranes (Hickmott and Constantine-Paton, 1993). Activation of these receptors mediates the activity-dependent aspect of topographic map formation (Cline et al., 1987; Cline and Constantine-Paton, 1989). It was therefore of interest to see if activity-dependent SP expression was also mediated by NMDA receptor activation. We found that it was not because blocking this receptor had no affect on the percent of SP-IR cells. Consequently, it is clear that these two types of activity-dependent phenomena are mediated by different mechanisms.
Cholinergic input from the nucleus isthmi regulates SP expression
The projection from the retina to the optic tectum in the leopard frog is almost entirely crossed (Singman and Scalia, 1990). Visual information from one tectal lobe to the other is relayed via the nucleus isthmi, which has reciprocal connections to the ipsilateral tectal lobe and sends a projection to the contralateral one (Grobstein et al., 1978; Gruberg and Udin, 1978; Grobstein and Comer, 1983). The pharmacology of these projections has been established: SP-IR tectal cells project from the ipsilateral tectum to the nucleus isthmi (Debski and Constantine-Paton, 1993) while the projection from the nucleus isthmi to both the contralateral and ipsilateral tectal lobes is cholinergic (Ricciuti and Gruberg, 1985; Desan et al., 1987). Furthermore, the nucleus isthmi supplies almost all of the acetylcholine within the tectum (Ricciuti and Gruberg, 1985; Wallace et al., 1990).
The types of cholinergic receptors present in the tectum and their location is not known in detail. Nicotinic receptors have been immunocytochemically identified on some retinal ganglion cell terminals (Sargent et al., 1989), and physiological evidence supports the existence of both nicotinic and muscarinic receptors in this structure (Fite and Wang, 1986; Titmus et al., 1999). Our autoradiographic study provides direct evidence that both nicotinic and muscarinic receptors exist in the tectum and demonstrates that these receptors are located in the superficial layers of the tectum (layers 8 and 9) in which nucleus isthmi axons terminate (Gruberg and Udin, 1978; Udin and Fisher, 1985; Gruberg et al., 1989). Consequently, to block nucleus isthmi input, we chronically exposed one tectal lobe of animals to both nicotinic and muscarinic receptor antagonists. Not only was the number of SP-IR tectal cells decreased by this treatment, but this decrease now took place in the lobe directly exposed to the drugs (Fig.12C). This change in the locus of the effect is to be expected if nucleus isthmi input directly regulates the number of SP-IR tectal cells.
The ability to alter SP expression in tectal cells was not specific to one of the two types of cholinergic receptors. Tecta in which only nicotinic or only muscarinic receptors were blocked also had decreased percentages of SP-IR cells. Interestingly, the biggest decrease was observed in animals in which nicotinic receptors were blocked although this treatment created the least disruption of the topographic map (see below). This difference likely reflects the different distributions and functional roles of the multiple nicotinic and muscarinic receptor subtypes within the tectum (Butt et al., 1998, 2000).
The purpose of regulating SP-IR cell expression in the optic tectum by visual activity originating from the ipsilateral eye remains to be elucidated. However, one possibility is that it serves as a way of keeping activity levels within the two tectal lobes at comparable levels. Nucleus isthmi input appears to play a facilitating and necessary role in visual signal processing within the tectum (Caine and Gruberg, 1985; Gruberg et al., 1991). As SP-IR tectal cells provide input to the ipsilateral nucleus isthmi (Debski and Constantine-Paton, 1993), a reduction in the number of SP-IR cells in one tectal lobe should decrease the strength of the facilitatory tectal-isthmi interaction, diminishing the response to retinal ganglion cell input in that tectum. Thus, a decrease in the ability of retinal ganglion cells to directly depolarize tectal cells in one lobe could promote a change in modulation in the other tectal lobe that would lessen tectal activity there.
Activity and topographic map maintenance
Topographic maps of visual space are found throughout the visual systems of animals (Udin and Fawcett, 1988). In the frog, retinal ganglion cell terminals create such a map in the optic tectum so that cell bodies that neighbor one another in the retina project to neighboring synaptic sites in the tectum. The formation of this map during development is dependent on retinal ganglion cells activating their tectal targets. Retinal ganglion cells release glutamate onto tectal membranes, which activates first non-NMDA receptors and then the NMDA receptors that are thought to mediate map formation (Cline et al., 1987). This mechanism operates throughout tadpole stages to allow for the shifting of the retinal ganglion cell projection needed to accommodate the different growth patterns of the retina and tectum (Reh and Constantine-Paton, 1984).
Our results indicate that the same mechanisms that operate during development to create the visual map are retained in the adult to maintain it. We have demonstrated that blocking NMDA receptor activity disrupted the visual map of the adult. Non-NMDA receptor activity was also needed. This was expected because non-NMDA receptor activation provides most of the synaptic current (Hickmott and Constantine-Paton, 1993) that is needed to relieve the magnesium block of the NMDA receptors (Nowak et al., 1984) and therefore contributes to the ultimate activation of these receptors.
Cholinergic receptor blockers also disrupted the visual map. Blocking all cholinergic receptors or muscarinic receptors alone significantly increased the dispersal area of retinal ganglion cells projecting to a given tectal site. Interestingly, blocking nicotinic receptors had much less of an effect that just bordered on significance. We believe these results can be understood through their likely effect on tectal activity levels. The cholinergic nucleus isthmi appears to be necessary for tectal cells to respond to visual input (Caine and Gruberg, 1985;Gruberg et al., 1991). Therefore cholinergic blockers may affect retinotectal topography by preventing nucleus isthmi input needed for the retinal ganglion cells to effectively depolarize tectal cells. The differing effectiveness of the receptor blockers in disrupting topographic map formation is consistent with the expected distribution of these receptors. Muscarinic receptors are thought to be on postsynaptic tectal membranes and could therefore significantly affect the amount of depolarization experienced by these neurons (Fite and Wang, 1986). Nicotinic receptors, on the other hand, are found on retinal ganglion cell terminals, where they may modulate action potential-mediated glutamate release (Sargent et al., 1989; Debski and Sargent, 1999; Titmus et al., 1999).
Conclusions
We have shown that in the adult frog the maintenance of visual topography and the expression of SP in tectal cells are both regulated by activity. Although the source of this activity is ultimately the retina, as conveyed to the tectum via the retinal ganglion cells, the activity dependence of these two phenomena is mediated by different synaptic interactions. Maintenance of the retinotopic map is dependent on direct retinal ganglion cell input and NMDA receptor activation, because it is in the developing system. Regulation of SP-IR cells is mediated by contralateral nucleus isthmi input and apparently dependent on retinal ganglion cell input only so far as it drives this pathway.
The contribution of modulatory pathways, such as that provided by the nucleus isthmi, to activity-dependent phenomena is not well understood. Our work suggests that such a pathway can both modulate activity-dependent phenomena by changing activity levels mediated at other sites as well as directly mediate its own activity-dependent effects.
Footnotes
This work was supported by National Science Foundation Grant IBN-9514614, National Institute of Mental Health Grant 5T32MH19917 and National Institutes of Health Grant EY 11913. We thank Drs. Bertram Peretz and Malathi Srivatsan for their gift of the Elvax used in this study.
Correspondence should be addressed to Elizabeth A. Debski, 101 Morgan Building, School of Biological Sciences, University of Kentucky, Lexington, KY 40506. E-mail: debski@pop.uky.edu.
REFERENCES
- 1.Adler JE, Kessler JA, Black IB. Development and regulation of substance P in sensory neurons in vitro. Dev Biol. 1984;102:417–425. doi: 10.1016/0012-1606(84)90206-9. [DOI] [PubMed] [Google Scholar]
- 2.Aubert I, Cecyre D, Gauthier S, Quirion R. Comparative ontogenic profile of cholinergic markers, including nicotinic and muscarinic receptors, in rat brain. J Comp Neurol. 1996;369:31–55. doi: 10.1002/(SICI)1096-9861(19960520)369:1<31::AID-CNE3>3.0.CO;2-L. [DOI] [PubMed] [Google Scholar]
- 3.Benson DL, Huntsman MM, Jones EG. Activity-dependent changes in GAD and preprotachykinin mRNAs in visual cortex of adult monkeys. Cereb Cortex. 1994;4:40–51. doi: 10.1093/cercor/4.1.40. [DOI] [PubMed] [Google Scholar]
- 4.Butt CM, Pauly JR, Debski EA. Synaptic location of putative muscarinic subtypes in the retinotectal system of Rana pipiens. Soc Neurosci Abstr. 1998;24:1395. [Google Scholar]
- 5.Butt CM, Pauly JR, Debski EA (2000) Distribution and development of nicotinic acetylcholine receptor subtypes in the optic tectum of Rana pipiens. J Comp Neurol, in press. [DOI] [PMC free article] [PubMed]
- 6.Caine HS, Gruberg ER. Ablation of nucleus isthmi leads to loss of specific visually elicited behaviors in the frog Rana pipiens. Neurosci Lett. 1985;54:307–312. doi: 10.1016/s0304-3940(85)80096-3. [DOI] [PubMed] [Google Scholar]
- 7.Carnahan J, Nawa H. Regulation of neuropeptide expression in the brain by neurotrophins. Potential role in vivo. Mol Neurobiol. 1995;10:135–149. doi: 10.1007/BF02740672. [DOI] [PubMed] [Google Scholar]
- 8.Clarke PB, Schwartz RD, Paul SM, Pert CB, Pert A. Nicotinic binding in rat brain: autoradiographic comparison of [3H]acetylcholine, [3H]nicotine, and [125I]-alpha-bungarotoxin. J Neurosci. 1985;5:1307–1315. doi: 10.1523/JNEUROSCI.05-05-01307.1985. [DOI] [PMC free article] [PubMed] [Google Scholar]
- 9.Cline HT, Constantine-Paton M. NMDA receptor antagonists disrupt the retinotectal topographic map. Neuron. 1989;3:413–426. doi: 10.1016/0896-6273(89)90201-8. [DOI] [PubMed] [Google Scholar]
- 10.Cline HT, Debski EA, Constantine-Paton M. N-methyl-d-aspartate receptor antagonist desegregates eye-specific stripes. Proc Natl Acad Sci USA. 1987;84:4342–4345. doi: 10.1073/pnas.84.12.4342. [DOI] [PMC free article] [PubMed] [Google Scholar]
- 11.Constantine-Paton M, Cline HT, Debski E. Patterned activity, synaptic convergence, and the NMDA receptor in developing visual pathways. Annu Rev Neurosci. 1990;13:129–154. doi: 10.1146/annurev.ne.13.030190.001021. [DOI] [PubMed] [Google Scholar]
- 12.Cook JE, Rankin EC. Topographic refinement of the regenerating retinotectal projection of the goldfish in standard laboratory conditions: a quantitative WGA-HRP study. Exp Brain Res. 1986;63:409–420. doi: 10.1007/BF00236860. [DOI] [PubMed] [Google Scholar]
- 13.Cowen T, Gavazzi I. Plasticity in adult and aging sympathetic neurons. Prog Neurobiol. 1998;54:249–288. doi: 10.1016/s0301-0082(97)00071-3. [DOI] [PubMed] [Google Scholar]
- 14.Croll SD, Wiegand SJ, Anderson KD, Lindsay RM, Nawa H. Regulation of neuropeptides in adult rat forebrain by the neurotrophins BDNF and NGF. Eur J Neurosci. 1994;6:1343–1353. doi: 10.1111/j.1460-9568.1994.tb00325.x. [DOI] [PubMed] [Google Scholar]
- 15.Debski EA, Constantine-Paton M. The development of non-retinal afferent projections to the frog optic tectum and the substance P immunoreactivity of tectal connections. Dev Brain Res. 1993;72:21–39. doi: 10.1016/0165-3806(93)90156-5. [DOI] [PubMed] [Google Scholar]
- 16.Debski EA, Sargent PB. Visualization of cholinergic input, presynaptic nicotinic AChR-like molecules and synaptic sites in the optic tectum. Soc Neurosci Abstr. 1999;25:980. [Google Scholar]
- 17.Debski EA, Liu Q, Chapman AM. Non-uniform distribution of cellular phenotypes in the optic tectum of the leopard frog. J Comp Neurol. 1995;360:671–684. doi: 10.1002/cne.903600411. [DOI] [PubMed] [Google Scholar]
- 18.Desan PH, Gruberg ER, Grewell KM, Eckenstein F. Cholinergic innervation of the optic tectum in the frog Rana pipiens. Brain Res. 1987;413:344–349. doi: 10.1016/0006-8993(87)91026-2. [DOI] [PubMed] [Google Scholar]
- 19.Fite KV, Wang S-R. Microiontophoresis and single-unit analysis of cholinergic drugs in the optic tectum of the frog. Brain Behav Evol. 1986;28:198–206. doi: 10.1159/000118703. [DOI] [PubMed] [Google Scholar]
- 20.Grobstein P, Comer C. The nucleus isthmi as an intertectal relay for the ipsilateral oculotectal projection in the frog, Rana pipiens. J Comp Neurol. 1983;217:54–74. doi: 10.1002/cne.902170106. [DOI] [PubMed] [Google Scholar]
- 21.Grobstein P, Comer C, Hollyday M, Archer SM. A crossed isthmo-tectal projection in Rana pipiens and its involvement in the ipsilateral visuotectal projection. Brain Res. 1978;156:117–123. doi: 10.1016/0006-8993(78)90086-0. [DOI] [PubMed] [Google Scholar]
- 22.Gruberg ER, Udin SB. Topographic projections between the nucleus isthmi and the tectum of the frog Rana pipiens. J Comp Neurol. 1978;179:487–500. doi: 10.1002/cne.901790303. [DOI] [PubMed] [Google Scholar]
- 23.Gruberg ER, Wallace MT, Waldeck RF. Relationship between isthmotectal fibers and other tectopetal systems in the leopard frog. J Comp Neurol. 1989;288:39–50. doi: 10.1002/cne.902880104. [DOI] [PubMed] [Google Scholar]
- 24.Gruberg ER, Wallace MT, Caine HS, Mote MI. Behavioral and physiological consequences of unilateral ablation of the nucleus isthmi in the leopard frog. Brain Behav Evol. 1991;37:92–103. doi: 10.1159/000114350. [DOI] [PubMed] [Google Scholar]
- 25.Gruberg ER, Hughes TE, Karten HJ. Synaptic interrelationships between the optic tectum and the ipsilateral nucleus isthmi in Rana pipiens. J Comp Neurol. 1994;339:353–364. doi: 10.1002/cne.903390305. [DOI] [PubMed] [Google Scholar]
- 26.Happe HK, Peters JL, Bergman DA, Murrin LC. Localization of nicotinic cholinergic receptors in rat brain: autoradiographic studies with [3H] cytisine. Neuroscience. 1994;62:929–944. doi: 10.1016/0306-4522(94)90484-7. [DOI] [PubMed] [Google Scholar]
- 27.Hendry SH, Jones EG, Burstein N. Activity-dependent regulation of tachykinin-like immunoreactivity in neurons of monkey visual cortex. J Neurosci. 1988;8:1225–1238. doi: 10.1523/JNEUROSCI.08-04-01225.1988. [DOI] [PMC free article] [PubMed] [Google Scholar]
- 28.Hickmott PW, Constantine-Paton M. The contributions of NMDA, non-NMDA, and GABA receptors to postsynaptic responses in neurons of the optic tectum. J Neurosci. 1993;13:4339–4353. doi: 10.1523/JNEUROSCI.13-10-04339.1993. [DOI] [PMC free article] [PubMed] [Google Scholar]
- 29.Hodie M, Jeevaratnam P, Salter MW, Roach A. Regulation of intracellular calcium and preprotachykinin neurotransmitter precursor gene expression by patterned electrical stimulation in rat sympathetic neurons. Neurosci Lett. 1995;185:195–198. doi: 10.1016/0304-3940(95)11260-4. [DOI] [PubMed] [Google Scholar]
- 30.Hughes TE. A light- and electron-microscopic investigation of the optic tectum of the frog, Rana pipiens. I: The retinal axons. Vis Neurosci. 1990;4:499–518. doi: 10.1017/s0952523800005721. [DOI] [PubMed] [Google Scholar]
- 31.Jonakait GM. Neural-immune interactions in sympathetic ganglia. Trends Neurosci. 1993;16:419–423. doi: 10.1016/0166-2236(93)90011-a. [DOI] [PubMed] [Google Scholar]
- 32.Kessler JA, Black IB. Regulation of substance P in adult rat sympathetic ganglia. Brain Res. 1982;234:182–187. doi: 10.1016/0006-8993(82)90485-1. [DOI] [PubMed] [Google Scholar]
- 33.Kessler JA, Freidin M. Regulation of substance P expression in sympathetic neurons. Ann NY Acad Sci. 1991;632:10–18. doi: 10.1111/j.1749-6632.1991.tb33089.x. [DOI] [PubMed] [Google Scholar]
- 34.Kessler JA, Adler JE, Bohn MC, Black IB. Substance P in principal sympathetic neurons: regulation by impulse activity. Science. 1981;214:335–336. doi: 10.1126/science.6169153. [DOI] [PubMed] [Google Scholar]
- 35.Krewson CE, Saltzman WM. Transport and elimination of recombinant NGF during long-term delivery to the brain. Brain Res. 1996;727:169–181. doi: 10.1016/0006-8993(96)00378-2. [DOI] [PubMed] [Google Scholar]
- 36.Kuljis RO, Karten HJ. Laminar organization of peptide-like immunoreactivity in the anuran optic tectum. J Comp Neurol. 1982;212:188–201. doi: 10.1002/cne.902120208. [DOI] [PubMed] [Google Scholar]
- 37.Lindsay RM, Harmar AJ. Nerve growth factor regulates expression of neuropeptide genes in adult sensory neurons. Nature. 1989;337:362–364. doi: 10.1038/337362a0. [DOI] [PubMed] [Google Scholar]
- 38.Liu Q, Debski EA. Optic nerve-dependent changes in adult frog tectal cell phenotypes. J Neurobiol. 1996;29:517–534. doi: 10.1002/(SICI)1097-4695(199604)29:4<517::AID-NEU8>3.0.CO;2-B. [DOI] [PubMed] [Google Scholar]
- 39.Marín O, González A. Origin of tectal cholinergic projections in amphibians: a combined study of choline acetyltransferase immunohistochemistry and retrograde transport of dextran amines. Vis Neurosci. 1999;16:271–283. doi: 10.1017/s0952523899162084. [DOI] [PubMed] [Google Scholar]
- 40.Nistri A, Sivilotti A, Welsh DM. An electrophysiological study of the action of N-methyl-d-aspartate on excitatory synaptic transmission in the optic tectum of frog in vitro. Neuropharmacology. 1990;29:681–688. doi: 10.1016/0028-3908(90)90030-u. [DOI] [PubMed] [Google Scholar]
- 41.Nowak L, Bregestovski P, Ascher P, Hebert A, Prochiantz A. Magnesium gates glutamate-gated channels in mouse central neurons. Nature. 1984;307:462–465. doi: 10.1038/307462a0. [DOI] [PubMed] [Google Scholar]
- 42.Reh TA, Constantine-Paton M. Retinal ganglion cell terminals change their projection sites during larval development of Rana pipiens. J Neurosci. 1984;4:442–457. doi: 10.1523/JNEUROSCI.04-02-00442.1984. [DOI] [PMC free article] [PubMed] [Google Scholar]
- 43.Ricciuti AJ, Gruberg ER. Nucleus isthmi provides most tectal choline acetyltransferase in frog Rana pipiens. Brain Res. 1985;341:399–402. doi: 10.1016/0006-8993(85)91083-2. [DOI] [PubMed] [Google Scholar]
- 44.Roach A, Adler JE, Black IB. Depolarizing influences regulate preprotachykinin mRNA in sympathetic neurons. Proc Natl Acad Sci USA. 1987;84:5078–5081. doi: 10.1073/pnas.84.14.5078. [DOI] [PMC free article] [PubMed] [Google Scholar]
- 45.Sargent PB, Pike SH, Nadel DB, Lindstrom JM. Nicotinic acetylcholine receptor-like molecules in the retina, retinotectal pathway, and optic tectum of the frog. J Neurosci. 1989;9:565–573. doi: 10.1523/JNEUROSCI.09-02-00565.1989. [DOI] [PMC free article] [PubMed] [Google Scholar]
- 46.Scalia F. The optic pathway of the frog: Nuclear organization and connections. In: Llinás R, Precht W, editors. Frog neurobiology. Springer; New York: 1976. pp. 386–406. [Google Scholar]
- 47.Shatz CJ. Impulse activity and the patterning of connections during CNS development. Neuron. 1990;5:745–756. doi: 10.1016/0896-6273(90)90333-b. [DOI] [PubMed] [Google Scholar]
- 48.Silberstein GB, Daniel CW. Elvax 40P implants: sustained, local release of bioactive molecules influencing mammary ductal development. Dev Biol. 1982;93:272–278. doi: 10.1016/0012-1606(82)90259-7. [DOI] [PubMed] [Google Scholar]
- 49.Singman EL, Scalia F. Quantitative study of the tectally projecting retinal ganglion cells in the adult frog. I. The size of the contralateral and ipsilateral projections. J Comp Neurol. 1990;302:792–809. doi: 10.1002/cne.903020411. [DOI] [PubMed] [Google Scholar]
- 50.Smith AL, Cordery PM, Thompson ID. Manufacture and release characteristics of Elvax polymers containing glutamate receptor antagonists. J Neurosci Methods. 1995;60:211–217. doi: 10.1016/0165-0270(95)00014-l. [DOI] [PubMed] [Google Scholar]
- 51.Smolen AJ, Wright LL, Cunningham TJ. Neuron numbers in the superior cervical sympathetic ganglion of the rat: a critical comparison of methods for cell counting. J Neurocytol. 1983;12:739–750. doi: 10.1007/BF01258148. [DOI] [PubMed] [Google Scholar]
- 52.Sun Y, Rao MS, Landis SC, Zigmond RE. Depolarization increases vasoactive intestinal peptide- and substance P-like immunoreactivities in cultured neonatal and adult sympathetic neurons. J Neurosci. 1992;12:3717–3728. doi: 10.1523/JNEUROSCI.12-10-03717.1992. [DOI] [PMC free article] [PubMed] [Google Scholar]
- 53.Székely G, Lázár G. Cellular and synaptic architecture of optic tectum. In: Llinás R, Precht W, editors. Frog neurobiology. Springer; New York: 1976. pp. 407–434. [Google Scholar]
- 54.Thoenen H. Neurotrophins and neuronal plasticity. Science. 1995;270:593–598. doi: 10.1126/science.270.5236.593. [DOI] [PubMed] [Google Scholar]
- 55.Titmus MJ, Tsai H-J, Lima R, Udin SB. Effects of choline and other nicotinic agonists on the tectum of juvenile and adult Xenopus frogs: a patch-clamp study. Neuroscience. 1999;91:753–769. doi: 10.1016/s0306-4522(98)00625-3. [DOI] [PubMed] [Google Scholar]
- 56.Tu S, Debski EA. Development and regulation of substance P expression in neurons of the tadpole optic tectum. Vis Neurosci. 1999;16:695–705. doi: 10.1017/s0952523899164095. [DOI] [PubMed] [Google Scholar]
- 57.Udin SB, Fawcett JW. Formation of topographic maps. Annu Rev Neurosci. 1988;11:289–327. doi: 10.1146/annurev.ne.11.030188.001445. [DOI] [PubMed] [Google Scholar]
- 58.Udin SB, Fisher MD. The development of the nucleus isthmi in Xenopus laevis. I. Cell genesis and the formation of connections with the tectum. J Comp Neurol. 1985;232:25–35. doi: 10.1002/cne.902320103. [DOI] [PubMed] [Google Scholar]
- 59.Udin SB, Fisher MD, Norden JJ. Ultrastructure of the crossed isthmotectal projection in Xenopus frogs. J Comp Neurol. 1990;292:246–254. doi: 10.1002/cne.902920207. [DOI] [PubMed] [Google Scholar]
- 60.Wallace MT, Ricciuti AJ, Gruberg ER. Nucleus isthmi: its contribution to tectal acetylcholinesterase and choline acetyltransferase in the frog Rana pipiens. Neuroscience. 1990;35:627–636. doi: 10.1016/0306-4522(90)90334-z. [DOI] [PubMed] [Google Scholar]
- 61.Yao L, Zhang D, Bernd P. Differential regulation of substance P by all members of the nerve growth factor family of neurotrophins in avian dorsal root ganglia throughout development. Neuroscience. 1997;79:1197–1206. doi: 10.1016/s0306-4522(96)00698-7. [DOI] [PubMed] [Google Scholar]
- 62.Zigmond RE, Sun Y. Regulation of neuropeptide expression in sympathetic neurons: paracrine and retrograde influences. Ann NY Acad Sci. 1997;814:181–197. doi: 10.1111/j.1749-6632.1997.tb46157.x. [DOI] [PubMed] [Google Scholar]