Abstract
Chromosome replication timing is biphasic (early–late) in the cell cycle of vertebrates and of most (possibly all) eukaryotes. In the present work we have compared the extended, detailed replication timing maps that are available, namely those of human chromosomes 6, 11q, and 21q, with chromosomal bands as visualized at low (400 bands), high (850 bands), and highest (3,200 isochores) resolution. We have observed that the replicons located in a given isochore practically always show either all early or all late replication timing and that early-replicating isochores are short and GC-rich and late-replicating isochores are long and GC-poor. In the vast majority of cases, replicons are clustered in isochores, which are themselves most often clustered in early- or late-replication timing zones and may often reach the size of high-resolution bands and, very rarely, even that of low-resolution bands. Finally, we show that our results should be representative for the whole human genome and thus help to predict replication timing zones in all chromosomes.
Keywords: replication origins, replicon clusters, replicons
Forty years ago Huberman and Riggs (1) showed, by combining the techniques of pulse-labeling and DNA autoradiography, that mammalian chromosomes are replicated from many replication origins and that adjacent starting points initiate replication at the same time. In other words, replicons, the DNA sequences that start their replication from a given origin, are organized in clusters that fire simultaneously. By using the incorporation of BrdU into human DNA, and thus changing the appearance of metaphase chromatids, it was shown, at the very low resolution of 277 bands, that reverse (R) bands replicate early, whereas quinacrine (Q) or Giemsa (G) bands replicate late (2–4), a result that was widely accepted for many years. Additional investigations indicated the existence of nine replication timings within each one of these two groups (5, 6).
The heterogeneity in replication timing within the early and late classes was shown to be associated with different band structures. Indeed, at the low resolution of 400 bands, the R bands containing the GC-richest, gene-richest isochores from the H3 family (the H3+ bands; for a general review on isochores see ref. 7) replicated at the onset of the S phase, whereas the bands not containing H3 isochores (H3− bands) replicated later (8). Likewise, among low-resolution G bands, those predominantly composed by the GC-poorest, gene-poorest L1 isochores (L1+ bands), which corresponded to the darkest G bands of Francke (9), replicated at the latest times, whereas the L1− bands were the earliest-replicating among the G bands (10). These experiments indicated the existence of a correlation between the replication timings and the fine structure of chromosomal bands, namely the isochore composition of bands.
A further step was made by assessing replication timing along chromosomal DNA sequences as done by Watanabe et al. (11) for human chromosomes 11q and 21q. These authors found that replicons are heterogeneous in size (most of them being estimated at 50–450 kb) and that several (up to 10 or more) contiguous replicons with origins that fire synchronously at a specific time comprise megabase-size domains that can be visualized cytogenetically as bands. When Watanabe et al. (11) compared their detailed replication maps with the corresponding compositional maps (GC profiles), as obtained at the high resolution of 850 bands (12, 13), they could conclude that early-replicating zones were GC-richer and gene-richer than late-replicating zones and that early/late transitions occurred primarily at positions identical to, or near, GC transitions.
Recent work in our laboratory established an isochore map of human chromosomes based on assessments of GC levels and their variation (standard deviation) within and between adjacent regions. Complete coverage of the human genome comprises ≈3,200 isochores having an average size of 0.9 Mb (14, 15). This prompted a new comparison with the replication maps of chromosomes 21q and 11q (11) and of chromosome 6 (16), which is presented here.
We first assessed the distribution of replicons in the isochores of chromosomes 11q, 21q, and 6 and found that, in the vast majority of cases, either early or late replicons were clustered in isochores. We then assessed the distribution of isochores on chromosomes and found that the isochores themselves were clustered in early- or late-replication timing zones. These could reach the size of high-resolution bands or, much more rarely, that of low-resolution bands. Finally, because the regions analyzed are compositionally representative of the human genome, our results should help to predict replication time zones also on other chromosomes.
Results
Correlation Between Replication Timing and Compositional Patterns.
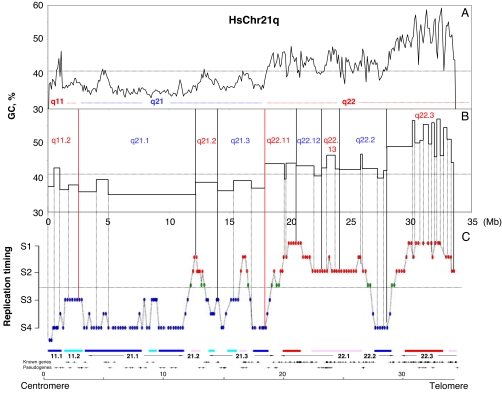
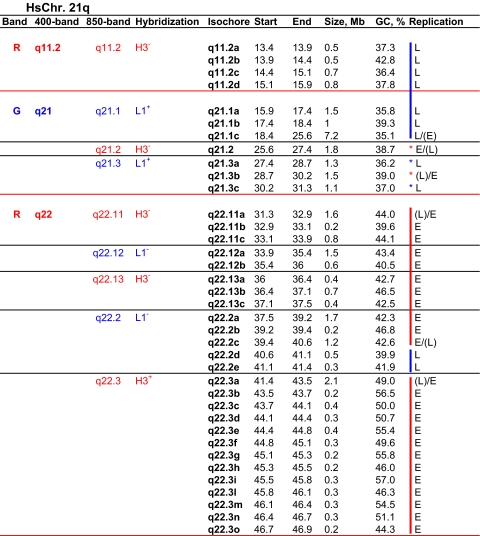
Fig. 1 compares GC profiles (Fig. 1A) and band profiles (Fig. 1B) at different resolution levels with replication timings for human chromosome 21q (Fig. 1C). Table 1 presents a corresponding list of the low-resolution (400 band), high-resolution (850 bands), and highest-resolution (3,200 isochores) bands for chromosome 21q, together with their coordinates, sizes, average GC levels, and replication times. Supporting information (SI) Fig. 4 A and B and SI Table 3 present similar sets of data for chromosome 11q, the replication data being again derived from Watanabe et al. (11). Finally, the replication data concerning chromosome 6 (16) are displayed in SI Fig. 5 A–C and SI Table 4.
Fig. 1.
Replication timing zones and chromosomal bands in human chromosome 21q. GC and chromosomal band profiles are compared with the replication timing pattern from Watanabe et al. (11). (A) The GC profile was drawn by using chromosome sequences downloaded from http://genome.ucsc.edu, release hg17 (19), using a nonoverlapping window of 100 kb (14). A horizontal dotted line at 41% GC is drawn to separate GC-poor (L1 and L2) and GC-rich (H1, H2, and H3) isochores. (B) The vertical red lines show the borders between low-resolution bands; the vertical black lines represent borders between high-resolution bands (band names are in blue or in red according to whether bands are G or R, respectively). The dashed vertical lines show the borders between isochores (14) and the correspondence between the isochores and the replication timing profile. (C) Profile of replication timing as reported by Watanabe et al. (11), in which early-replicating, intermediate-replicating (S1–S2), and late-replicating (S3–S4) loci are indicated by red, green, and blue ovals, respectively (see ref. 11 for further information). A horizontal dotted line under the green ovals is drawn to separate the early- and late-replication timing regions.
Table 1.
Low- and high-resolution bands on the long arm of chromosome 21 are listed together with their component isochores (starts, ends, sizes, GC levels, and replication timings)
Isochore nomenclature is according to Costantini et al. (14). L, late-replicating; E, early-replicating; L/(E) or E/(L), isochores with a small terminal region (in brackets) showing a different timing. As in Fig. 1, horizontal red lines separate low-resolution bands; black horizontal lines separate high-resolution bands. Vertical red or blue thick lines indicate regions having early- or late-replication timing, respectively. Red or blue asterisks indicate individual isochores having early- or late-replication timings, respectively.
Distribution of Replicons in Isochores.
The data presented in the preceding section and in the SI show that ≈88% of the highest-resolution bands, the isochores, are made up of replicons that are either early- or late-replicating. In other words, the simultaneous presence of early and late replicons was found in only ≈12% of isochores in the chromosomes examined, and these counterexamples are almost certainly artefactual (see below).
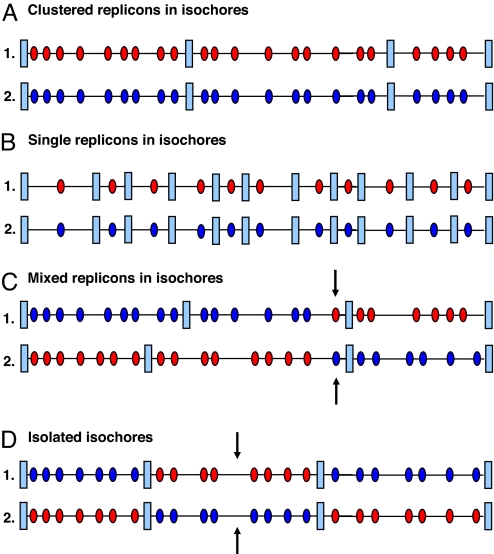
As far as replicon distribution within isochores is concerned, two different situations were found. In the most frequent case (90% of isochores), two or more (early or late) replicons were clustered in isochores (Fig. 2A). In the rarer case, single replicons were contained in very small (0.2–0.3 Mb) isochores (Fig. 2B), which were mainly early-replicating.
Fig. 2.
Distribution of replicons on isochores and of isochores on chromosomes. Replicons (red or blue ovals for early or late replication, respectively) in isochores may be clustered (A), single (B), or mixed (C). In the latter case, the terminal part of an isochore (arrows) shows the replication timing of one contiguous isochore (see text). Early- and late-replicating isochores are generally clustered to form replication timing zones (A–C). Isolated isochores (arrows) are shown in D.
We next examined the “mixed” isochores, which comprised both early and late replicons (see Fig. 2C). We found that sequences having a different replication timing from that shown by the majority of the isochores occupied a terminal region that represented <20% of the isochore sequence and had the same replication timing as that of a contiguous isochore. This was a very strong indication that such terminal regions simply reflected misassignments of isochore and/or replication timing zone borders. The isochore borders of those bands were, therefore, checked and found to be correct, leading to the conclusion that misassignments concerned replication zone borders. The only exception was that of band q22.2 of chromosome 11q. In this case, in which the very long, 3.6-Mb isochore coincides with a high-resolution band, the alternative replication timing is centrally located. This isochore should therefore in fact be split into three isochores to match the replication timing.
If the small, terminal, alternatively replicating regions are due to occasional misassignment of replication timing borders, and if the only exception just mentioned is corrected as just indicated, one can conclude that all isochores are either early- or late-replicating.
Distribution of Isochores on Chromosomes.
Isochores comprising early or late replicons are in their vast majority clustered on chromosomes (see Fig. 2 A–C), thus originating early- or late-replication timing zones. Only in 11.5% of cases were isochores isolated, namely flanked by isochores showing a different replication timing (see Fig. 2D). Both early- and late-replicating zones were 4–7 Mb in size, approaching or reaching the size of high-resolution bands or, much more rarely, that of low-resolution bands (see below).
Distribution of Replication Timing Zones on Chromosomes.
We will now consider low- and high-resolution bands of chromosomes 21q and 11q to clarify their correlation with replication timing zones. A typical G400 band (namely a G band at a 400-band resolution), such as q21 of chromosome 21, comprises both early and late replication timing zones. This is also true for its constituent high-resolution bands q21.1, q21.2, and q21.3. The low-resolution band q21 appears to be a late-replicating band because the majority of replicon clusters are late-replicating (see Fig. 1 and Table 1). This can also be said of high-resolution bands q21.2 and q21.3. A similar analysis led to similar findings for the low-resolution band q22 and its corresponding high-resolution bands. A special case is that of band q11, which appears as an early-replicating band, apparently because of the contrast with the preceding centromeric sequences and the following G band q21, which replicate at an even later time.
In the case of chromosome 11q, eight bands were seen at low resolution (see SI Fig. 5 and SI Table 3). Each one of these bands is a mixture of early and late zones, and the relative amount of early- or late-replicating zones defines the classification of the low-resolution bands as early- or late-replicating. For example, band q13 shows a mixture of early and late zones, but the amount of early-replicating zones is larger than that of late zones, so the band appears as an early-replicating band. An opposite situation is found in q14, where the amount of DNA in late-replicating zones is larger than that in the early ones, so this band appears as late-replicating. Incidentally, the replication heterogeneity of low-resolution bands could have been predicted on the basis of their constituent high-resolution bands, which were heterogeneous in terms of hybridization of different isochore families (see figure 2 of ref. 15).
If one considers now all of the chromosomal bands analyzed here, the 29 low-resolution bands comprise both early- and late-replication zones (with the exception of the centromeric band q11.2 on chromosome 21, which correspond to a late-replication timing zone) whereas only 58.0% of the 850 high-resolution band behave this way, the remaining 42% corresponding to either early- or late-replicating isochore clusters.
Replication Timing and Isochore Families.
To investigate the replication timing borders between the early and late chromosomal bands we put all of the early (red ovals in Fig. 1 and SI Fig. 5 A and B) and intermediate (green ovals in Fig. 1) zones of Watanabe et al. (11) in the same early class, because the intermediate timings were closer to the early timings compared with the late timings (blue ovals; see Fig. 1 and SI Fig. 4 A and B). A separation between the two classes of replication timings then appeared.
The early- and late-replication timings were correlated with isochore families. We found that most GC values >41%, namely above the border between the L2 and H1 families, corresponded to early-replicating zones, and most GC values <41% corresponded to late-replicating zones. There were, however, several exceptions to this tendency suggesting that the contrast with neighboring replication timing zones might sometimes be the predominant factor, as observed before (17). Moreover, in some cases, replication timing zones were slightly shifted relative to chromosomal bands, possibly as the result of small misassignments of their borders.
As far as the bands obtained by hybridization with isochores are concerned, the results were clear-cut in the case of H3+ and L1+ bands, which very largely corresponded to early- or late-replicating bands, respectively, whereas, in contrast, H3− and L1− corresponded to bands in which both early- and late-replicating zones were present.
Representativity of Chromosomes 21q, 11q, and 6 for the Whole Human Genome.
If one compares the relative amounts of the isochore families of 21q, 11q, and 6 chromosomes, which comprise a total of 304 isochores and represent 281.9 Mb (9.9% of the genome) with those (3,200 isochores) from the whole genome (14), the differences found are <20%, except for the smallest isochore family, H3, which is underrepresented by ≈50% in the chromosomes studied (see SI Fig. 6)
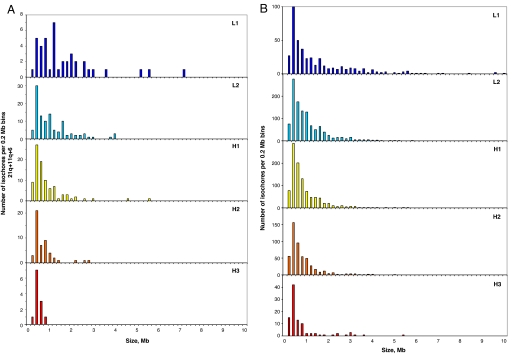
We also checked the size of isochores in the five families present in the chromosomes investigated and found a pattern characterized by a decrease when going from family L1 to family H3, which was paralleled by the size decrease in the whole genome (Table 2). The distribution of isochores in both cases was also similar (Fig. 3). The data of Fig. 3 and SI Fig. 6 indicate that, taken together, chromosomes 6, 11q, and 21q are good representatives of the whole genome.
Table 2.
Average size of isochores in the five families of chromosomes 6, 11q, and 21q and in the whole genome
| Family | Average size, Mb |
|
|---|---|---|
| 6 + 11q + 21q | Whole genome | |
| L1 | 1.60 | 1.47 |
| L2 | 1.00 | 0.92 |
| H1 | 0.80 | 0.78 |
| H2 | 0.60 | 0.70 |
| H3 | (0.34) | 0.69 |
The isochore family H3 is underrepresented in chromosomes 6, 11q, and 21q, and its average size is underestimated.
Fig. 3.
Size distribution of isochores from different families in chromosomes 6, 11q, and 21q. (A) The number of isochores per 0.2-Mb bin is shown for the isochores belonging to the five isochore families in the three chromosomes studied in this work. (B) Number distribution of clustered isochores from different families in the whole human genome.
Discussion
The major finding of the present investigations is the discovery of three nested structures that are directly relevant in the replication of mammalian chromosomes, the replicons, well known for a long time; the replication units, namely the isochores that can replicate early or late in the cell cycle; and the classic cytogenetic bands, the latter replicating both early and late in most cases. We will now comment on the structures that are intermediate between the replicons and the replication timing zones, namely the isochores.
First, as already mentioned, the vast majority of isochores are either early- or late-replicating, and our investigations indicate that all “mixed” isochores are likely to be artefacts. This is a crucial finding because it establishes the isochores as intimately linked to replication timing. One could even say that isochores are elementary replication units, a view supported by the distribution of isochores on chromosomes. In any case, isochores provide a solid starting point, which is essential to understanding the complex replication timing pattern of the mammalian genome (see below) and to identifying sequences involved in starting early or late replication.
Second, the most common situation is that isochores are made of clustered replicons, isochores comprising single replicons being rare and most frequently GC-rich, as also shown by the very recent results of Schmegner et al. (18) on a 0.8-Mb region from human chromosome 22.
Third, isochores are mostly clustered, thus originating early- or late-replicating timing zones, but isolated isochores also exist, reinforcing the correspondence between replication units and isochores. Early- or late-replicating zones extend in 40% of cases to cover high-resolution (850-band) bands and in very rare cases to cover even the larger low-resolution (400-band) bands. As a consequence, almost all low-resolution chromosomal bands and 60% of high-resolution bands exhibit both early and late replicon clusters, and their cytogenetic appearance after BrdU incorporation depends on the relative amounts of early- and late-replicating regions. The single exception concerns a paracentromeric band, q11.2, of chromosome 21q.
Fourth, the early finding of 18 different replication timing zones in low-resolution replication bands (5, 6) is apparently due to the contribution of different high-resolution bands having a few distinct replication times, within low-resolution bands, rather than 18 distinct replication times. This conclusion is supported by the finding of only four replication timings at the high resolution of 850 bands by Watanabe et al. (11).
Fifth, the representativity of chromosomes 21q, 11q, and 6 for the whole genome, as judged from the distribution of both isochores and their sizes, indicates that the present results can help in predicting replication timing zones in other parts of the genome, especially in regions having very high or very low GC regions. In the extreme cases there is a perfect compositional match between isochores and replication timing zones, as abundantly exemplified by our data as well as by the results of Schmegner et al. (18). In compositionally intermediate regions predictions are likely to be more difficult because of the influence of other factors, the major one apparently being the compositional contrast.
Supplementary Material
ACKNOWLEDGMENTS.
We thank Drs. T. Ikemura and K. Woodfine for providing high-resolution versions of their data. We thank also Drs. Oliver Clay and Giacomo Bernardi for helpful discussions and suggestions.
Footnotes
The authors declare no conflict of interest.
This article is a PNAS Direct Submission.
This article contains supporting information online at www.pnas.org/cgi/content/full/0710587105/DC1.
References
- 1.Huberman JA, Riggs AD. J Mol Biol. 1968;32:327–341. doi: 10.1016/0022-2836(68)90013-2. [DOI] [PubMed] [Google Scholar]
- 2.Dutrillaux B, Laurent C, Couturier J, Lejeune J. C R Acad Sci Hebd Seances Acad Sci D. 1973;276:3179–3181. [PubMed] [Google Scholar]
- 3.Latt SA. Proc Natl Acad Sci USA. 1973;70:3395–3399. doi: 10.1073/pnas.70.12.3395. [DOI] [PMC free article] [PubMed] [Google Scholar]
- 4.Dutrillaux B. Chromosoma. 1975;52:261–273. doi: 10.1007/BF00332115. [DOI] [PubMed] [Google Scholar]
- 5.Dutrillaux B, Couturier J, Richer CL, Viegas-Pequinot E. Chromosoma. 1976;58:51–61. doi: 10.1007/BF00293440. [DOI] [PubMed] [Google Scholar]
- 6.Biémont MC, Laurent C, Couturier J, Dutrillaux B. Ann Genet. 1978;21:133–141. [PubMed] [Google Scholar]
- 7.Bernardi G. Structural and Evolutionary Genomics: Natural Selection in Genome Evolution. Amsterdam: Elsevier; 2004. [Google Scholar]
- 8.Federico C, Saccone S, Bernardi G. Cytogenet Cell Genet. 1998;80:83–88. doi: 10.1159/000014961. [DOI] [PubMed] [Google Scholar]
- 9.Francke W. Cytogenet Cell Genet. 1994;6:206–219. doi: 10.1159/000133633. [DOI] [PubMed] [Google Scholar]
- 10.Federico C, Andreozzi L, Saccone S, Bernardi G. Chromosome Res. 2000;8:737–746. doi: 10.1023/a:1026797522102. [DOI] [PubMed] [Google Scholar]
- 11.Watanabe Y, Fujiyama A, Ichiba Y, Hattori M, Yada T, Sakaki Y, Ikemura T. Hum Mol Genet. 2002;11:13–21. doi: 10.1093/hmg/11.1.13. [DOI] [PubMed] [Google Scholar]
- 12.Saccone S, Federico C, Solovei I, Croquette MF, Della Valle G, Bernardi G. Chromosome Res. 1999;7:379–386. doi: 10.1023/a:1009220131225. [DOI] [PubMed] [Google Scholar]
- 13.Hattori M, Fujiyama A, Taylor TD, Watanabe H, Yada T, Park HS, Toyoda A, Ishii K, Totoki Y, Choi DK, et al. Nature. 2000;405:311–319. doi: 10.1038/35012518. [DOI] [PubMed] [Google Scholar]
- 14.Costantini M, Clay O, Auletta F, Bernardi G. Genome Res. 2006;16:536–541. doi: 10.1101/gr.4910606. [DOI] [PMC free article] [PubMed] [Google Scholar]
- 15.Costantini M, Clay O, Federico C, Saccone S, Auletta F, Bernardi G. Chromosoma. 2007;116:29–40. doi: 10.1007/s00412-006-0078-0. [DOI] [PubMed] [Google Scholar]
- 16.Woodfine K, Beare DM, Ichimura K, Debernardi S, Mungall AJ, Fiegler H, Collins VP, Carter NP, Dunham I. Cell Cycle. 2005;4:172–176. doi: 10.4161/cc.4.1.1350. [DOI] [PubMed] [Google Scholar]
- 17.Saccone S, Pavliček A, Federico C, Pačes J, Bernardi G. Chromosome Res. 2001;9:533–539. doi: 10.1023/a:1012443217627. [DOI] [PubMed] [Google Scholar]
- 18.Schmegner C, Hameister H, Vogel W, Assum G. Cytogenet Genome Res. 2007;116:167–172. doi: 10.1159/000098182. [DOI] [PubMed] [Google Scholar]
- 19.International Human Genome Sequencing Consortium. Nature. 2004;431:931–945. doi: 10.1038/nature03001. [DOI] [PubMed] [Google Scholar]
Associated Data
This section collects any data citations, data availability statements, or supplementary materials included in this article.


