Abstract
Background
We have previously reported the safety of aerosolized PGE1 in neonatal hypoxemic respiratory failure. The aim of this study is to characterize the physicochemical properties of PGE1 solution, stability, emitted dose and the aerodynamic particle size distribution (APSD) of PGE1 aerosol in a neonatal ventilator circuit.
Methods
PGE1 was diluted in normal saline and physicochemical properties of the solution characterized. Chemical stability and emitted dose were evaluated during jet nebulization in a neonatal conventional (CMV) or high frequency (HFV) ventilator circuit by a High Performance Liquid Chromatography - Mass Spectrometry method. The APSD of the PGE1 aerosol was evaluated with a six-stage cascade impactor during CMV.
Results
PGE1 solution in normal saline had a low viscosity (0.9818 cP) and surface tension (60.8 mN/m) making it suitable for aerosolization. Little or no degradation of PGE1 was observed in samples from aerosol condensates, the PGE1 solution infused over 24 h, or the residual solution in the nebulizer. The emitted dose of PGE1 following jet nebulization was 32–40% during CMV and 0.1% during HFV. The PGE1 aerosol had a mass median aerodynamic diameter of 1.4 µm and geometric standard deviation of 2.9 with 90% of particles being < 4.0 µm in size.
Conclusion
Nebulization of PGE1 during neonatal CMV or HFV is efficient and results in rapid nebulization without altering the chemical structure. On the basis of the physicochemical properties of PGE1 solution and the APSD of the PGE1 aerosol, one can predict predominantly alveolar deposition of aerosolized PGE1.
Keywords: aerosol, aerosol particle size distribution, cascade impactor, chemical stability, emitted dose, jet nebulizer, LC-MS, mechanical ventilation, nebulizer, neonatal hypoxemic respiratory failure, prostaglandin E1[PGE1]/ Alprostadil, pulmonary deposition, respirable fraction
Introduction
Neonatal hypoxemic respiratory failure (NHRF) is usually associated with potentially reversible pulmonary hypertension that causes right-to-left shunting and profound hypoxemia. Inhaled nitric oxide (INO), a selective pulmonary vasodilator (SPV), has revolutionized the treatment of NHRF (1). However, lack of sustained improvement in 30–46% of infants and the need for specialized delivery systems make the treatment expensive and limit availability. Several investigators have explored the use of aerosolized prostaglandin E1 (PGE1) as a SPV in patients with respiratory failure to improve oxygenation because of its selective action not only on the pulmonary circulation, but also on well-ventilated lung units resulting in improvement in ventilation perfusion ratio and oxygenation (2–5).
PGE1 is a crystalline compound stable at room temperature (RT) in the solid state and as a solution in non-aqueous solvents such as ethanol. In isotonic saline (pH 4.5), PGE1 is stable for more than a month at 0 °C and greater than 90% stable at 37 °C for 2 days (6). Aqueous solutions of PGE1 show a small, spontaneous dehydration to the significantly less active PGA1 (Figure 1) within 2 h following dilution from an ethanolic solution at RT (7). While oxidation of PGE1 at the hydroxyl at C-15 followed by the reduction of the 13,14-double bond, resulting in the formation of 13,14-dihydro-15-keto PGE1 (Figure 1), is the primary metabolic inactivation step in vivo, the initial oxidation to 15-keto PGE1 requires strong oxidizing agents in vitro (8)
Figure 1.
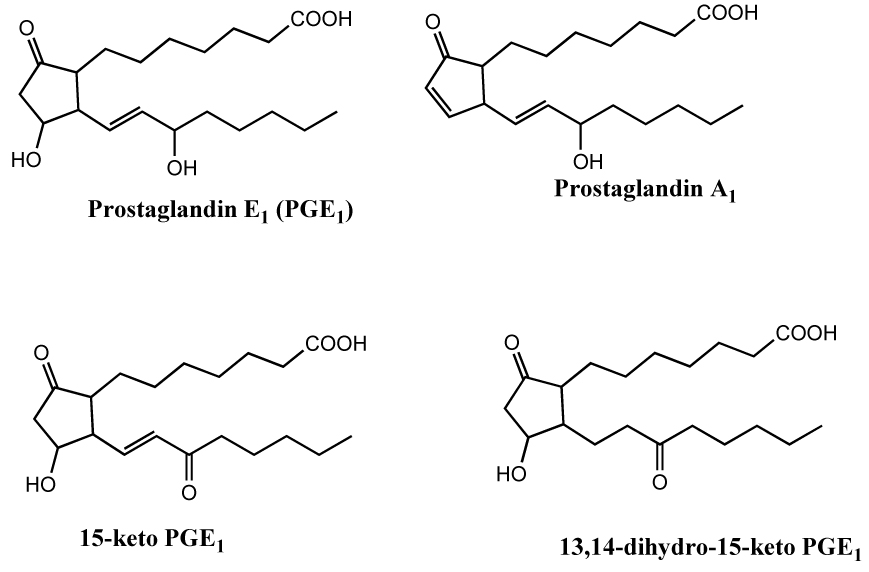
Prostaglandin E1 and its potential degradation products. In vivo metabolism of PGE1 results in the formation of 13,14-dihydro-15-keto PGE1. PGA1 is a non-enzymatic decomposition product of PGE1. While 15-keto PGE1 is readily formed from PGE1 in vivo, its formation in vitro requires strong oxidizing agents.
Although the stability of aqueous PGE1 solutions has been studied extensively, there is little data on the stability of PGE1 in aerosol following nebulization. Jet nebulization results in a large surface area of the solution being exposed to and becoming saturated with the driving gas (typically oxygen) under high pressure. Under these conditions, it is, at least, theoretically possible that PGE1 could undergo oxidative degradation resulting in a lower emitted dose. In addition to the chemical stability, aerodynamic particle size distribution (APSD) is an important determinant of pulmonary drug deposition and an essential component of marketing authorization for aerosol formulations. However, PGE1 aerosol obtained by jet nebulization has not been characterized.
The aim of the present study is to evaluate the chemical stability and emitted dose of PGE1 following continuous jet nebulization in a neonatal ventilator circuit using the highly sensitive and selective high performance liquid chromatography with mass spectrometry (LC-MS) technique. An additional goal is to characterize the APSD following jet nebulization of PGE1 in a neonatal ventilator circuit using the low flow MiniHeart nebulizer designed for continuous aerosol delivery to infants.
Materials and Methods
This in vitro study was exempt from IRB review as no human or animal subjects were involved.
Drug Preparation
PGE1 (500 µg/ml of ethanol) was diluted in normal saline to a final concentration of ~20 µg/ml. Physicochemical properties of the PGE1 solution were characterized. Freshly diluted solutions of PGE1 were dispensed by the pharmacy just prior to the start of continuous aerosolization and every 24 hours thereafter for 72 hours. Samples were collected at 0 and 24 hours from the dispensed solution and stored at −80 °C.
Mechanical ventilation
Conventional mechanical ventilation (CMV) was initiated with a pressure-limited ventilator (V.I.P. Bird®, Viasys® Healthcare) at a breath rate of 42 bpm, FiO2 of 1.0, peak inspiratory pressure of 20 cm H2O, end expiratory pressure of 4 cm H2O and duty cycle of 35% to simulate clinical use in moderate to severe NHRF. High frequency ventilation (HFV) was initiated with the SensorMedics 3100A High Frequency Oscillatory Ventilator (Viasys® Healthcare) at a mean airway pressure of 20 cm H2O, amplitude of 35, frequency of 10 Hz and duty cycle of 33%. Gas flow in the heated humidified ventilator circuit was 8 and 28 LPM for CMV and HFV, respectively. A 3.5 mm ID endotracheal tube (ETT) connected to the ventilator was kept open to a closed glass container (capacity 25 ml) to collect the condensate (Figure 2). A nebulizer was placed in the inspiratory limb of the ventilator circuit ~50 cm from the ETT for CMV and ~35 cm from the ETT for HFV. Condensed aerosol in the glass container at the end of ETT was transferred at regular intervals to clean glass vials and stored at −80 °C. Samples were collected every 30 min for the first 6 h followed by every 6 h for the next 66 hours during CMV. For HFV experiments, condensate samples were collected every 30 min for 8 hours.
Figure 2.
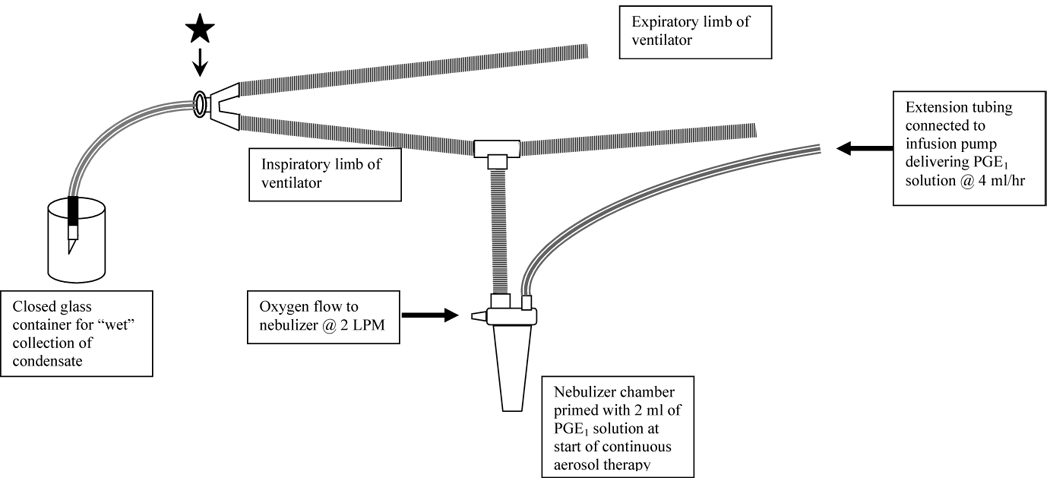
Ventilator and nebulizer circuit. The star represents the place where the cascade impactor was connected with an adaptor.
Administration of Continuous aerosol
Aerosols of PGE1 were generated with a jet nebulizer (low flow, MiniHeart, Westmed Inc., Tucson, AZ) driven by blended oxygen at a flow rate of 2 LPM. At the start of aerosol therapy, the nebulizer chamber was primed with 2 ml of PGE1 solution for aerosolization followed by continuous delivery into the nebulizer chamber at 4 ml/h. Residual solution in the nebulizer was sampled at the end of the experiment.
LC-MS setup for resolution and identification of PGE1 and its potential degradation products
At the time of analyses, the samples were thawed, diluted with HPLC mobile phase and placed in the autosampler that was maintained at 0–5 °C. Samples were routinely injected using autoinjector and the typical injection volume was 10 µl. Resolution of PGE1 and its potential degradation product PGA1 along with the less likely oxidation product 15-keto PGE1 was achieved by the HPLC using Synergi, Hydro-RP column (150×2 mm, 4 µ, 80 Å, Phenomenex, Torrance, CA) with acetonitrile:water:acetic acid (45:55:0.1 v/v) as mobile phase at a flow rate of 400 µl/min on Alliance 2695 liquid chromatograph equipped with an autoinjector (Waters Corporation, Milford, MA). The eulate was monitored by MS/MS on a Micromass QuattroLC controlled by Masslynx software (Waters Corporation, Milford, MA). Optimum mass spectrometry conditions for monitoring PGE1, PGA1, and 15-keto PGE1 were as follows: Needle voltage, 2.8 kV; Cone voltage, 20 V; solvent block temperature, 150 °C; desolvation temperature, 300 °C; Collision voltage 16 kV, and collision gas pressure 3.4×10⁻⁴ mBar. Multiple Reaction Monitoring (MRM) method was employed to detect PGE1 (m/z 353→235), 15-keto PGE1 (m/z 351→333), and PGA1 (m/z 335→235) (Figure 3).
Figure 3.
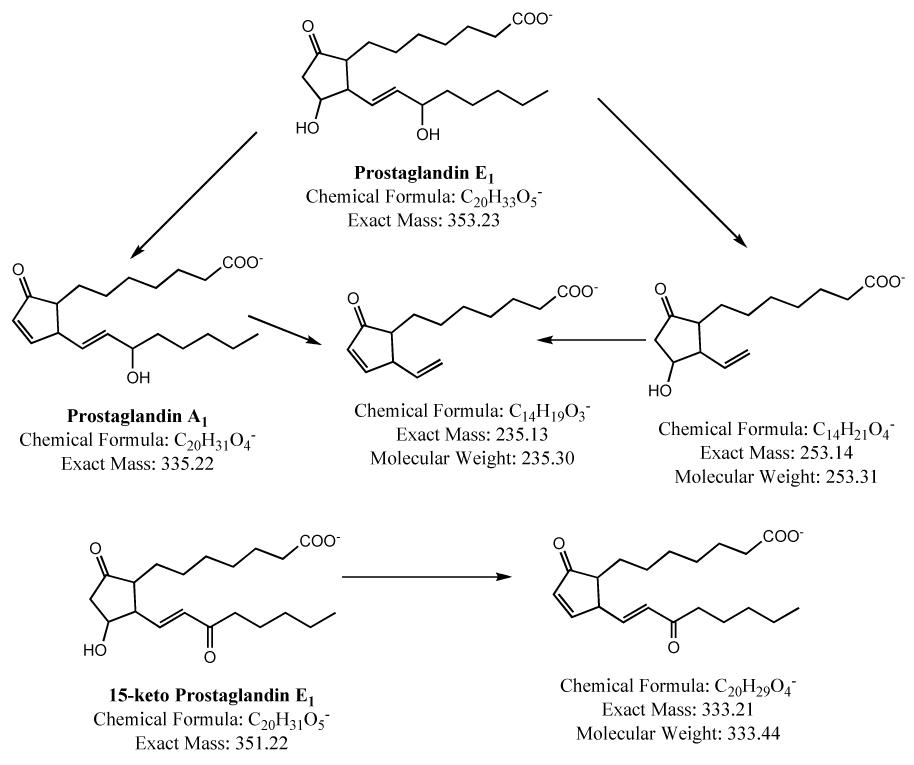
Mass spectral fragmentation pattern of prostaglandin E1 and its metabolites.
External standard method of quantitation was used for the assay of PGE1 content in the condensates of nebulized PGE1 solutions. For this method of quantitation, gravimetric standards prepared from crystalline PGE1 (obtained from Cayman Chemical Company, Ann Arbor, MI) were used. An accurately weighed sample of PGE1 (1–1.5 mg) was dissolved in reagent grade acetonitrile to give a 1 mg/ml solution. This stock solution was diluted to 100 µg/ml in the HPLC mobile phase described above. A 50 µl aliquot of this diluted stock was further diluted with 950 µl of the HPLC mobile phase to give the highest concentration standard, 5 µg/ml, for the standard curve. This standard was serially diluted to give standards of concentration 0.05, 0.1, 0.5, and 1 µg/ml. A five point standard curve was constructed by injecting 10 µl of each of the standards.
Statistical Analyses
Descriptive statistical analyses were used to summarize interval scale sample characteristics. The volume output from the nebulizer, PGE1 concentration and cumulative emitted dose of PGE1 were plotted against time to evaluate trends during the experiment. The linear mixed model procedure was used to assess the change in cumulative emitted dose of PGE1 considering effects from the repeated measurement of these variables and their changes over time. Two-tailed significance level was set at 0.05. Statistical analyses were performed using the SPSS® statistical package, version 15.0.1 (SPSS Inc., Chicago, IL, USA) and SAS/STAT® software, Version 9.1.3 (SAS Institute Inc., Cary, NC, USA).
Aerodynamic Particle Size Distribution
PGE1 solution for aerosolization was prepared from synthetic PGE1 and aerosolized in the conventional mechanical ventilation circuit as described above. Aerosol samples were taken at the beginning of the endotracheal tube (Figure 2). The aerosol particle size was determined using a 6-stage cascade impactor (QCM Cascade Impactor, California Instruments, Model IMPAQ AS-6) with cutoff stages at greater than 8, 4, 2, 1, 0.5, 0.3, and a filter at 0.25 µm. The IMPAQ AS-6 operates at a flow rate of 12.5 liters/minute and is suitable for the determination of aerosol APSD in mechanically ventilated neonates in whom the ventilator flow rate of 8–10 LPM closely approximates the flow rate in the cascade impactor. It is equipped with a diaphragm type vacuum pump capable of generating a maximum vacuum of 24 inHg. PGE1 deposited on each stage of the impactor at the end of 5 seconds was collected on glass slides. The glass slides were rinsed with 0.5mL of normal saline solution. The extraction efficiency of the PGE1 from the impactor plates was > 95%. The filter was rinsed with 2 mL of normal saline solution. All tests were done at room temperature and under ambient conditions of humidity. Each cutoff stage solution was analyzed by LC-MS for PGE1 and its potential degradation products (PGA1, 15-keto-PGE1) as described above. The official method described in the U.S. Pharmacopoeia to determine MMAD and GSD from cascade impactor data involves manual plotting of the cumulative percent of mass smaller than the stated diameter (ordinate) versus diameter (abscissa), on log probability paper (9). As manual plotting of the cascade impactor data is tedious, the use of linear regression with conversion of cumulative percent smaller than the stated diameter into standard deviation units (ordinate) and the logarithm of the effective cutoff diameters (abscissa) have been suggested as a reasonable approach. For this report, the cascade impactor data was plotted by both methods, but only the latter has been presented.
Results
The surface tension of the PGE1 solution, measured with an optical contact angle tensiometer at a temperature of 299 K (78.8°F; 26° C) and an ambient pressure of 1 atmosphere, was 60.8 ±0.3 mN/m. The viscosity, measured using a Canon Fenske Routine viscometer under similar conditions, was 0.9815 and 0.9820 centipoise (cP) in two different runs.
LC-MS resolution and identification of PGE1 and its potential degradation products
Baseline resolution of PGE1 and its potential degradation product PGA1 along with the less likely oxidation product 15-keto PGE1 was achieved by HPLC (Figure 4). Retention times of PGE1, 15-keto PGE1, and PGA1 were 2.2, 3.3, and 5.9 min, respectively, under the standard LC-MS conditions described above. Intra-day variation of the retention times is less than 0.1 min and inter-day variation is less than 0.3 min. Typical peak widths at half height were about 25 s.
Figure 4.
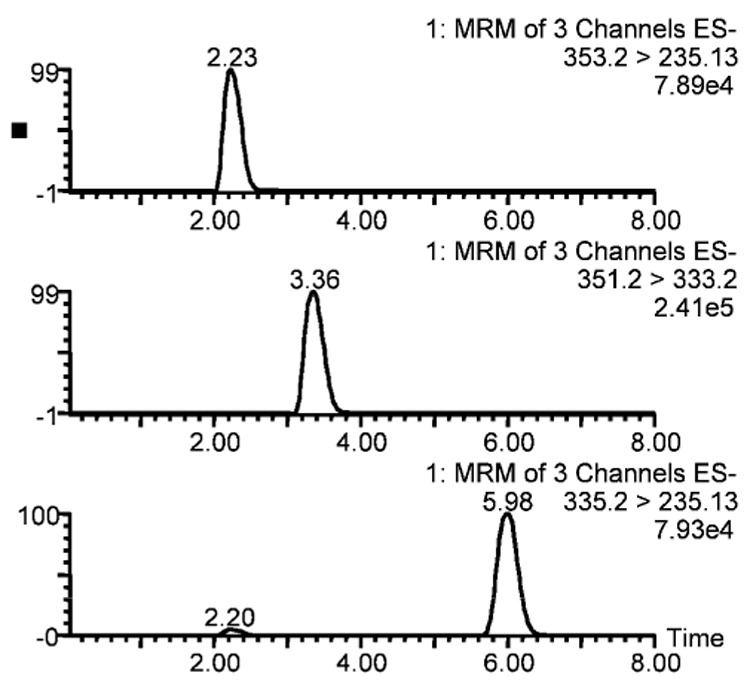
LC-MS chromatograms of a mixture of prostaglandin E1 and its potential metabolites (prostaglandin A1 and 15-keto prostaglandin E1). The three panels represent PGE1, 15-keto PGE1, and PGA1 from top to bottom. A small peak observed at the same retention time as PGE1 (2.25 min) in the PGA1 chromatogram (bottom panel) is the PGA1 derived from PGE1 in the ion source of the mass spectrometer.
The standard curve showed less than 5% variation in the peak areas of three injections of each standard (Figure 5). Standard curves run at the beginning and end of each set of experimental samples (~23–30 samples) were comparable indicating consistency of mass spectrometer response over the duration of the experiment. In addition, quality control standards injected for every 10 sample injections, gave a response identical to the standard curve indicating lack of instrument response drift. Under the standard conditions the Limit of Detection (LOD) for both PGE1 and its potential metabolites (PGA1 and 15-keto PGE1) is 0.0025 µg/ml and the Limit of Quantitation (LOQ) is 0.03 µg/ml.
Figure 5.
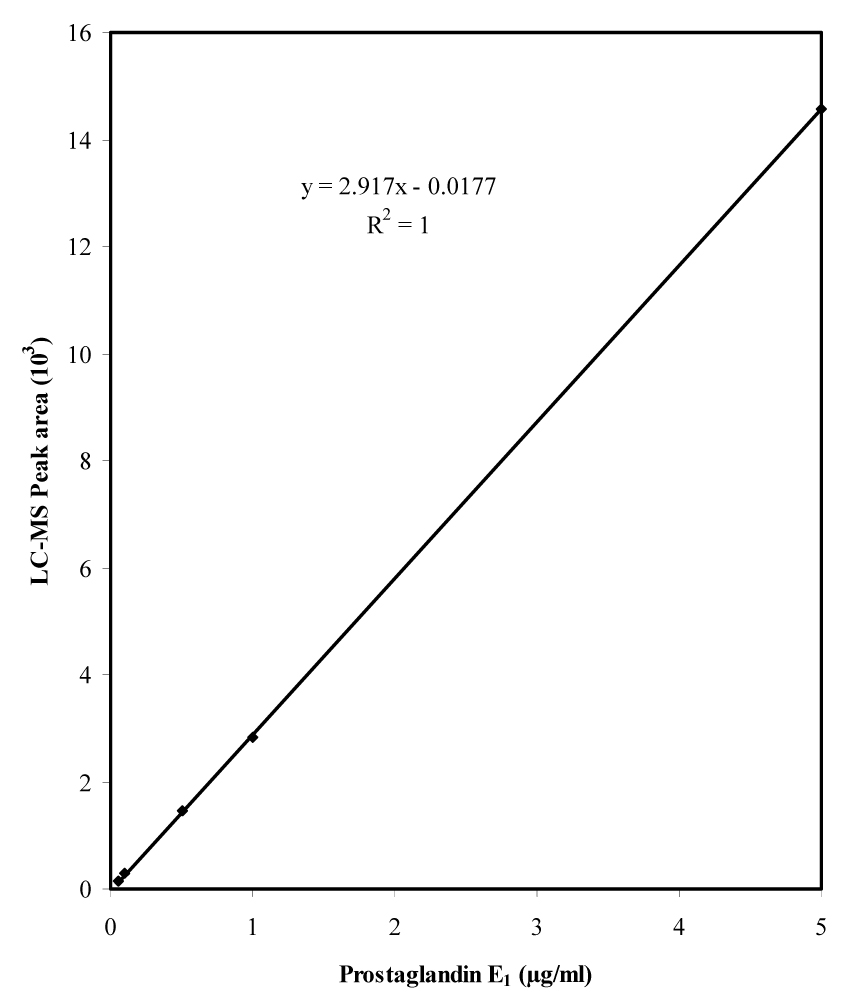
Typical standard curve of prostaglandin E1 analyzed by LC-MS. The standards range from 0.05 to 5 µg/ml (0.05, 0.1, 0.25, 0.5, 1, and 5 µg/ml); 10 µl of each standard was injected on to the HPLC column. Thus the actual amount of PGE1 injected on to the column ranges from 0.5 to 50 ng. Each data point represents the average of three independent chromatographic runs.
Stability and Emitted Dose
Four experiments were performed with continuous jet nebulization in a CMV circuit for 72 hours and two with HFV for 8 hours. All experiments were performed in the Neonatal Intensive Care Unit at the Children’s Hospital of Michigan at ambient temperature and relative humidity.
Stability of PGE1 following jet nebulization during mechanical ventilation
No significant degradation of PGE1 was observed in samples collected from the dispensed PGE1, residual solution in nebulizer, or condensate at the ETT during either mode of ventilation (Figure 6). Average PGA1 levels in the PGE1 solution dispensed by the pharmacy were 2.0±0.5% of the PGE1 levels at baseline and increased 0.2% over 24 hours (2.2±0.7%). Average PGA1 levels in the condensate samples were 2.7±0.9% of the PGE1. To rule out the possibility of degradation of PGE1 to some other unforeseen product, several of the condensate as well as nebulizer samples were scanned between m/z 150–450 in the full scan mode in addition to the MRM mode for the three compounds (i.e. PGE1, 15-keto PGE1, and PGA1). No other molecular species was detected in the Total Ion Chromatograms of the full scans (Figure 7).
Figure 6.
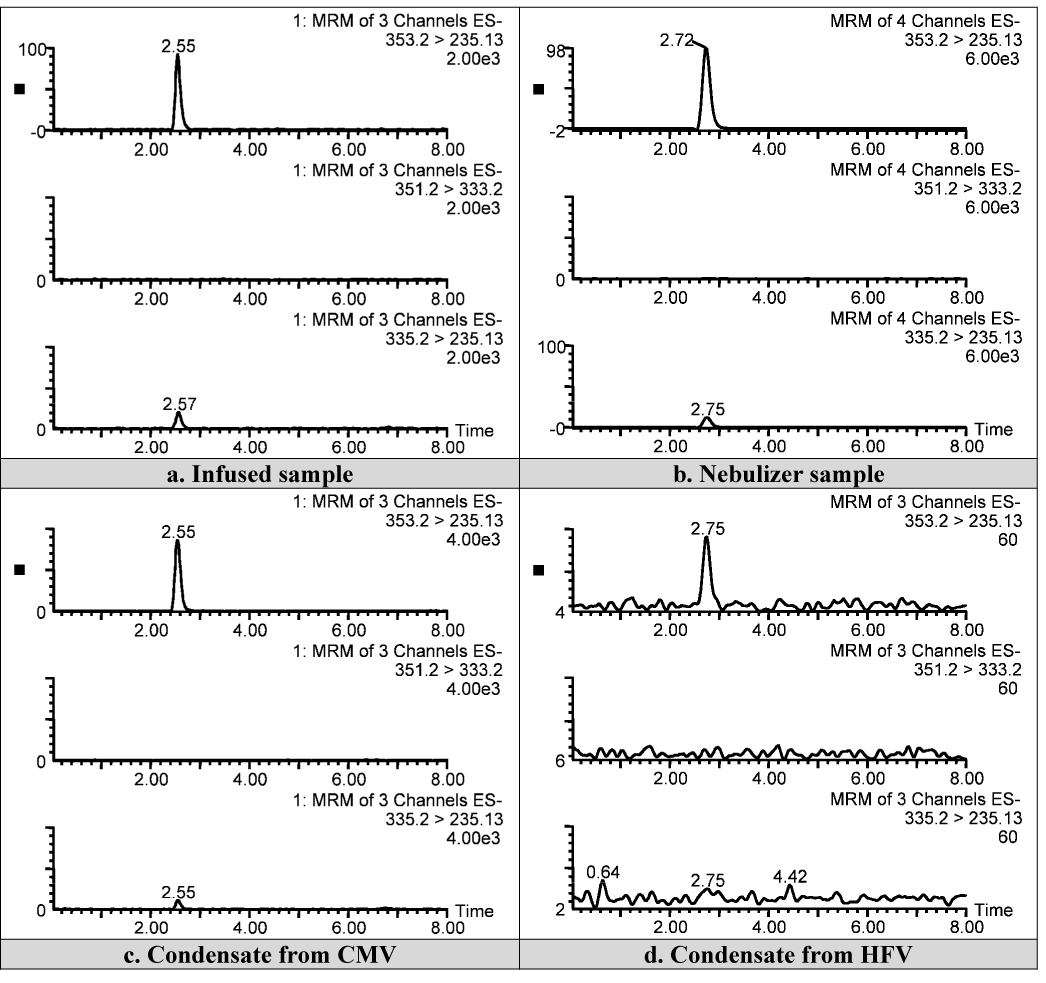
Representative LC-MS chromatograms from dispensed PGE1 solution (a), residual solution in nebulizer during HFV (b), condensate collected during CMV (c) and condensate collected during HFV (d).
Figure 7.
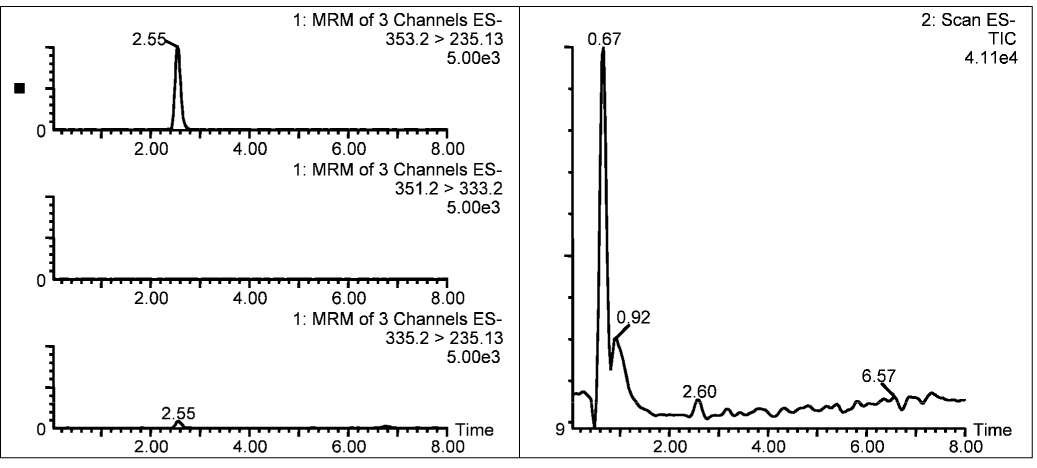
Total Ion Chromatogram (right panel) of a typical condensate scanned from m/z 150–450 along with MRM scans (left panel) for PGE1 (top), 15-keto PGE1 (second from top), and PGA1 (third from top). The large peak at the void volume in the Total Ion Chromatogram is due to the sodium chloride present in the condensate sample.
Concentration of PGE1 in dispensed PGE1 solution, and residual solution in nebulizer
Concentration of PGE1 in the solution dispensed by the pharmacist was determined at the start of infusion and 24 hours later. There was high correlation between PGE1 concentration at baseline and 24 hours later (r=0.891, p<0.05) in six paired samples (Table 1) suggesting chemical stability. Residual volume in the nebulizer was < 3 ml during CMV and ~10 ml during HFV. PGE1 concentration in the solution collected from the nebulizer during HFV was comparable to that of the infused solution (Table 4, p>0.1) indicating little degradation of PGE1.
Table 1.
Concentration of PGE1 at the beginning and end of a 24 h period in the sample solution that was infused into the nebulizer.
| Sample | PGE1 (µg/ml) | |
|---|---|---|
| at 0 h | at 24 h | |
| Syringe 1 | 20.9 | 19.8 |
| Syringe 2 | 15.4 | 15.4 |
| Syringe 3 | 20.9 | 20.9 |
| Syringe 4 | 18.7 | 17.6 |
| Syringe 5 | 17.6 | 18.7 |
| Syringe 6 | 22.0 | 20.9 |
Table 4.
Emitted dose of PGE1.
| CMV | HFV | |||||
|---|---|---|---|---|---|---|
| Expt.1 | Expt.2 | Expt.3 | Expt.4 | Expt.5 | Expt.6 | |
| Mean Conc. of PGE1 in infused soln. (µg/ml)a | 20.4±0.8 | 16.5±1.6 | 20.9±1.2 | 17.2±1.5 | 23.7 | 25.4 |
| Mean Conc. of PGE1 in condensate (µg/ml)b | 11.9±5.6 | 9.0±3.3 | 10.9±3.5 | 8.3±2.9 | 0.26±0.07 | 0.19±0.04 |
| Dilution factor | 1.6 | 1.7 | 1.9 | 2.1 | 92 | 137 |
| Volume of PGE1 infused (ml/hr) | 4 | 4 | 4 | 4 | 4 | 4 |
| Volume of PGE1 collected at ETT (ml/hr) | 2.7±1.0 | 2.8±1.1 | 2.5±1.6 | 3.3±1.3 | 0.42±0.11 | 0.79±0.18 |
| % Emitted dosec | 40 | 39 | 32 | 40 | 0.1 | 0.1 |
| PGE1 in residual solution in the nebulizer (µg/ml) | n/d | n/d | n/d | n/d | 23.9 | 26.6 |
Average of three batches of PGE1 (each infused for 24 h) used over 72 h in experiments 1–4. Experiments 5 & 6 were conducted with one batch each of PGE1 for 8 h.
ratio of total PGE1 collected in the condensate versus the infused amount per hour.
d no significant residual volume collected in the nebulizer for CMV experiments to quantify PGE1.
Emitted dose of PGE1 following continuous aerosol delivery in a humidified ventilator circuit
Condensate at the end of the ETT was collected at 23 time points during CMV over 72 h and 16 time points during HFV over 8 h (Table 2 and Table 3). The condensate recovered represented ~50–71% of the infused volume (4 ml/h) in the experiments using CMV and 10–20% of the infused volume in experiments using HFV. Concentration of PGE1 in the condensate collected at the ETT was lower than that in the dispensed PGE1 solution. Condensate volume and PGE1 concentration reached the mean values for the experiment by the second hour in all experiments. Over the 72 hour experiments, variability in the form of reciprocal cyclical trends were noted in the condensate volume and PGE1 concentration with periods of increased volume output being associated with decreased PGE1 concentration. We suspect that this variability may result from fluctuations in ambient temperature and relative humidity in the NICU, inherent variability in the performance of the nebulizers over time, and/or inaccuracies in sample collection although every precaution was taken at every step to keep experimental conditions constant. The emitted dose of PGE1 in each of the six experiments was calculated from the condensate volume and concentration of PGE1 for each sample and expressed as a percent of the nominal dose infused into the nebulizer chamber (Table 4). The emitted dose was 32–40% of the nominal dose for CMV and 0.1% for HFV. The cumulative dose of delivered PGE1 at the ETT end of the circuit showed a statistically significant linear increase with time indicating consistent drug delivery (Figure 8).
Table 2.
Volume and Concentration of PGE1 in the condensates collected at the end of endotracheal tube during CMV
| Time (h) | Expt. 1 | Expt. 2 | Expt. 3 | Expt. 4 | ||||
|---|---|---|---|---|---|---|---|---|
| Vol. (ml) | PGE1 (µg/ml) | Vol. (ml) | PGE1 (µg/ml) | Vol. (ml) | PGE1 (µg/ml) | Vol. (ml) | PGE1 (µg/ml) | |
| 0.5 | 0.0 | 0.0 | 0.0 | 0.0 | 0.3 | 6.6 | 0.7 | 6.6 |
| 1.0 | 0.5 | 6.6 | 1.3 | 7.7 | 0.2 | 8.8 | 1.3 | 6.6 |
| 1.5 | 1.2 | 12.1 | 0.9 | 8.8 | 0.9 | 8.8 | 1.6 | 7.7 |
| 2.0 | 1.4 | 14.3 | 2.1 | 8.7* | 2.3 | 11.0 | 2.2 | 8.8 |
| 2.5 | 1.1 | 16.5 | 1.7 | 9.9 | 1.3 | 9.9 | 1.2 | 8.8 |
| 3.0 | 1.4 | 16.5 | 1.5 | 11.0 | 2.6 | 12.1 | 3.2 | 8.8 |
| 3.5 | 2.6 | 17.6 | 2.0 | 11.0 | 2.9 | 9.9 | 3.1 | 7.7 |
| 4.0 | 1.7 | 17.6 | 1.8 | 8.8 | 0.6 | 15.4 | 2.0 | 8.8 |
| 4.5 | 2.0 | 14.3 | 2.0 | 7.7 | 1.5 | 14.3 | 2.1 | 9.9 |
| 5.0 | 1.6 | 17.6 | 1.4 | 9.9 | 2.8 | 14.3 | 2.6 | 9.9 |
| 5.5 | 1.4 | 17.6 | 1.3 | 9.9 | 1.7 | 12.1 | 0.8 | 9.9 |
| 6.0 | 1.1 | 17.6 | 1.6 | 12.1 | 0.7 | 11.0 | 1.8 | 11.0 |
| 12 | 11.2 | 16.5 | 18.3 | 4.4 | 14.0 | 15.4 | 17.0 | 7.7 |
| 18 | 19.9 | 6.6 | 21.2 | 4.4 | 10.0 | 5.5 | 14.0 | 3.3 |
| 24 | 20.6 | 7.7 | 21.0 | 11.0 | 16.4 | 5.5 | 21.2 | 9.9 |
| 30 | 16.9* | 9.5* | 16.3* | 9.2* | 16.1 | 5.5 | 18.8 | 2.2 |
| 36 | 13.6 | 16.5 | 22.2 | 4.4 | 17.8 | 15.4 | 18.2 | 11.0 |
| 42 | 20.2 | 3.3 | 8.6 | 6.6 | 8.2 | 15.4 | 9.0 | 7.7 |
| 48 | 21.0 | 7.7 | 21.1 | 12.1 | 14.4 | 4.4 | 14.8 | 12.1 |
| 54 | 17.0 | 5.5 | 19.4 | 11.0 | 17.8 | 12.1 | 18.2 | 13.2 |
| 60 | 15.6 | 16.5 | 17.2 | 12.1 | 9.2 | 11.0 | 17.8 | 3.3 |
| 66 | 15.4 | 11.0 | 4.2 | 12.1 | 2.0 | 12.1 | 17.0 | 11.0 |
| 72 | 16.0 | 4.4 | 11.4 | 14.3 | 4.8 | 13.2 | 21.2 | 4.4 |
| Mean±SDa | 2.7±1.0 | 11.9±5.6 | 2.8±1.1 | 9.0±3.3 | 2.5±1.6 | 10.9±3.5 | 3.3±1.3 | 8.3±2.9 |
Missing sample due to broken vial. Data estimated using mean imputation.
Condensate volume averages are computed as ml/h.
Table 3.
Volume and Concentration of PGE1 in the condensates collected at the end of endotracheal tube during HFV
| Time (h) | Expt. 5 | Expt. 6 | ||
|---|---|---|---|---|
| Vol. (ml) | PGE1 (µg/ml) | Vol. (ml) | PGE1 (µg/ml) | |
| 0.5 | 0.10 | 0.22 | 0.20 | 0.12 |
| 1 | 0.15 | 0.27 | 0.32 | 0.10 |
| 1.5 | 0.18 | 0.32 | 0.40 | 0.14 |
| 2 | 0.28 | 0.28 | 0.44 | 0.19 |
| 2.5 | 0.17 | 0.18 | 0.43 | 0.19 |
| 3 | 0.18 | 0.20 | 0.40 | 0.18 |
| 3.5 | 0.19 | 0.18 | 0.28 | 0.21 |
| 4 | 0.20 | 0.16 | 0.38 | 0.21 |
| 4.5 | 0.18 | 0.20 | 0.33 | 0.19 |
| 5 | 0.32 | 0.25 | 0.39 | 0.19 |
| 5.5 | 0.25 | 0.24 | 0.46 | 0.19 |
| 6 | 0.27 | 0.42 | 0.36 | 0.18 |
| 6.5 | 0.23 | 0.30 | 0.50 | 0.20 |
| 7 | 0.21 | 0.26 | 0.58 | 0.22 |
| 7.5 | 0.25 | 0.28 | 0.43 | 0.19 |
| 8 | 0.18 | 0.38 | 0.41 | 0.25 |
| Average | 0.42±0.11 | 0.26±0.07 | 0.79±0.18 | 0.19±0.04 |
a Condensate volume averages are computed as ml/h.
Figure 8.
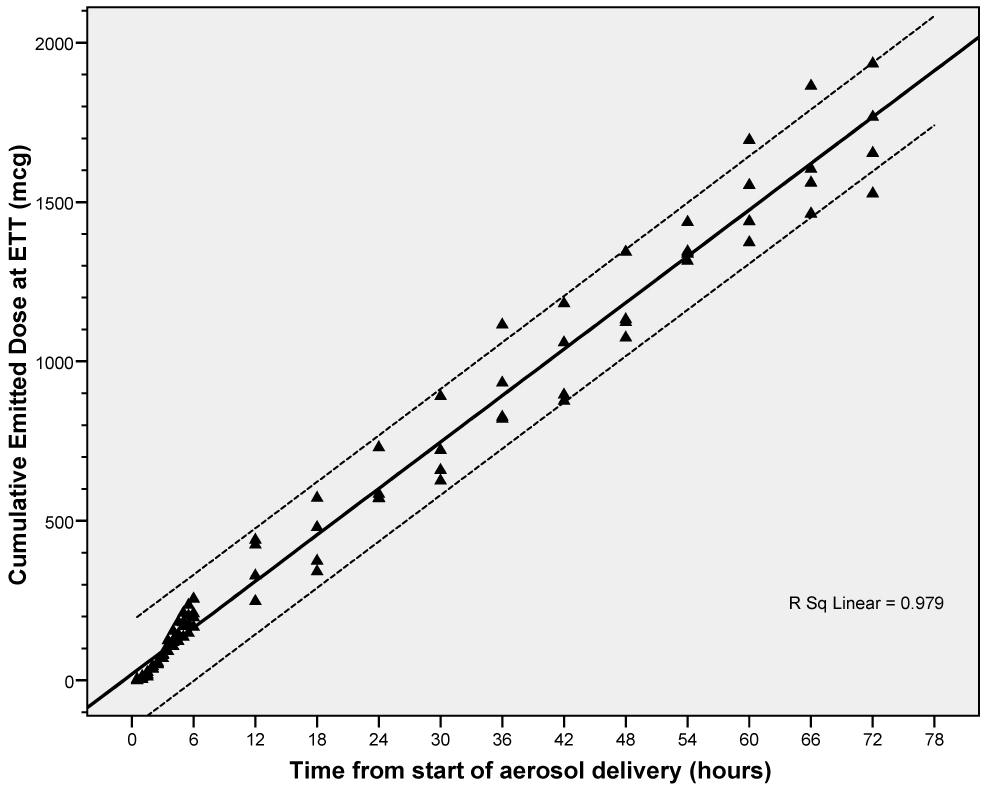
Cumulative emitted dose of PGE1 during CMV. Solid line represents best-fitting line for the data. Dotted lines represent 95% confidence intervals of the individual observations.
Aerodynamic Particle Size Distribution
Cascade impactor analysis was performed on 5 different samples and the results of the five trials averaged. LC-MS chromatographic profile of samples collected from cascade impactor revealed no detectable degradation of PGE1 (data not shown). The distribution of drug captured in the cascade impactor showed a deposition peak at 1.0 µm (35%) (Table 5). Ninety percent of the particles were <4.0 µm in diameter and 88% of the particles <2.0 µm. The cumulative percent of mass less than the stated diameter, was plotted on the ordinate after conversion to units of standard deviation (z scores) versus the logarithm of the particle diameter on the abscissa to obtain a rational approximation of the log probability graph, the official method described in the USP for determination of particle size (Figure 9) (9, 10). A logarithmic regression curve was fitted to determine the particle size at 50% of the accumulated deposition (mass median aerodynamic diameter, MMAD). Geometric standard deviation (GSD) was calculated as the MMAD divided by the particle size at 16% deposition. The PGE1 aerosol had a MMAD of 1.4 µm with a GSD of 2.9. R² for this relationship was greater than 0.9 in this series of experiments. On the basis of the low MMAD, and large proportion (90%) of particles <4.0µm, one can predict predominantly alveolar deposition of aerosolized PGE1.
Table 5.
Aerosol Particle Size Distribution
| Cascade impactor stage (µm) | Depositiona (%) | Cumulative depositiona (%) |
|---|---|---|
| 0.25 | 5.5 | 5.5 |
| 0.3 | 8.5 | 14.0 |
| 0.5 | 24.5 | 38.6 |
| 1 | 35.1 | 73.7 |
| 2 | 14.3 | 88.1 |
| 4 | 2.1 | 90.1 |
| > 8 | 9.9 | 100 |
Calculated from the PGE1 values obtained by LC-MS
Figure 9.
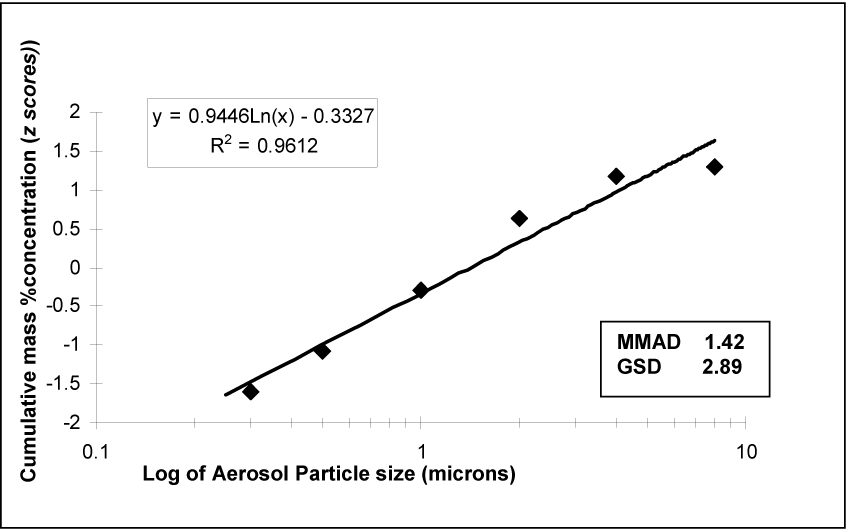
Cumulative Log-Probability Plot of particle size distribution. The best-fit line is from logarithmic linear regression.
Discussion
Targeted delivery of drugs to the site of action is preferable not only for enhanced efficacy but also to reduce systemic exposure and potential toxicity. Intravenous PGE1, a potent vasodilator used empirically in the treatment of NHRF, is associated with systemic hypotension and worsening of oxygenation due to increased venous admixture (11–15). This has led investigators to explore the delivery of PGE1 directly to the lungs as an inhalation, thus minimizing systemic effects and achieving selective pulmonary vasodilation (2–4). In this study, we have demonstrated for the first time that PGE1 can be nebulized safely during neonatal mechanical ventilation. The nebulizer set up is simple to use and results in rapid nebulization of the drug without altering the chemical structure of PGE1. We have also characterized, for the first time, the APSD specific to PGE1 aerosol generated using the low flow MiniHeart jet nebulizer. The pulmonary deposition of aerosolized medications depends on several nebulizer and patient related factors of which APSD is perhaps the most important (16). For convenience, many studies in the past have used salbutamol or tracer materials to characterize the APSD for a given nebulizer (16, 17). However, nebulizer performance is affected by the solution used. Therefore it is important to characterize the aerosol for a particular drug-nebulizer combination (18).
Selectivity and specificity of LC-MS method for PGE1 quantitation
PGE1 is usually measured by HPLC after derivatization with a chromophore (19). While this method is effective at high concentrations (~500 µg/ml), it is not suitable for the present study where the concentration in the final sample is expected to be <25–30 µg/ml. Moreover, the UV-HPLC method is not suitable for the identification of unknown degradation products that could be produced during nebulization in a positive pressure ventilator circuit with high FiO2. HPLC resolution of PGE1 and its potential degradation products combined with mass spectrometric identification and quantitation used in this study offers unsurpassed selectivity and excellent sensitivity with a LOD of 0.0025 µg/ml, LOQ of 0.03 µg/ml and a dynamic range of 0.03–5 µg/ml. This technique can be further optimized to detect lower concentrations of PGE1 if necessary.
Stability of PGE1 during nebulization
Despite exposure to high oxygen tension during nebulization, PGE1 is stable as evidenced by the absence of any degradation products in the total ion chromatograms of the condensate samples other than PGE1 and PGA1 (Figure 7). The molecular weight range of the scan was chosen to encompass molecular species that could result from the addition of several molecules of oxygen under the hyperbaric conditions of the experiment as well as smaller fragments that could result from the oxidative degradation of PGE1.
Emitted dose of PGE1
We used a modification of the wet nebulization method for aerosol collection because it is relatively accurate and avoids the drying or reconstitution steps involved in filter paper collection which may mask or add to changes occurring during the aerosolization process (20–23). The condensate collected at the ETT represented ~50–71% of the volume infused into the nebulizer during CMV and 10–20% of the infused volume during HFV. Variations in condensate volumes over time reflect inherent variability of nebulizers, changes in ambient conditions, angulation of ventilator tubing, and evaporation. Similar variability has been reported by other investigators (21, 24). However, inspite of variations in volume, there was consistent delivery PGE1 over time.
The concentration of PGE1 in the condensate collected at the ETT was lower than that in the dispensed PGE1 solution. The lower concentration of PGE1 in the condensate reflects dilution due to condensation of water vapor from the humidified gas flowing through the ventilator at a high rate. The water content of gas with 100% humidity at 35.7 °C is estimated to be 41 mg/L (25, 26). At a flow rate of 8 LPM through CMV and 28 LPM through HFV, the volume of water in the form of vapor is ~28 and ~78 ml/h, respectively. This water contributes to dilution of the condensate resulting in lower PGE1 concentration. As expected, this dilution is significantly more pronounced in the HFV experiments because of the higher gas flow rate. After adjustment for the dilution factor, the emitted dose is nearly 100%.
The emitted dose of 32–40% during CMV and 0.1% during HFV in the current report is an under-estimate for several reasons. First, it was not possible to collect the entire aerosol at the ETT because of the high gas flow rate in the ventilator as discussed above. Second, we did not collect the aerosol adhering to the ventilator circuit or entering the expiratory tubing. Third, the closed glass container is a poor substitute for the respiratory system of the neonate with intrinsic compliance, branching airways, numerous alveolar interfaces and alveolar-capillary gradient. Fourth, the heated and humidified ventilator circuit in this report may have decreased the emitted dose (21, 27, 28). Although additional measures such as a condenser or negative pressure in the circuit have been used to enhance aerosol recovery, we tried to simulate the clinical condition as closely as possible (23). Underestimation of delivered dose raises the concern of potential overdose in neonates undergoing aerosol therapy with the set up described in this report. However, this was not substantiated by animal toxicity studies with inhaled PGE1 (unpublished data) and the Phase I/II study of inhaled PGE1 in neonatal hypoxemic respiratory failure (5)
The emitted dose in this report is lower than that reported in adult (57–81%) but higher than that reported in pediatric ventilation studies (0.3–10%) (17, 21, 29–32). These discrepancies are related to differences in delivery systems, administration techniques and nebulizer design (28).
The significant difference in the emitted dose during CMV and HFV is a reflection of the inherent differences in principles of operation of the two ventilators; limited understanding of aerosol deposition during HFV and consequent inability to accurately assess drug delivery during HFV by in vitro methods (33–35). It is remarkable that condensate was obtained as soon as 30 min after the onset of nebulization during HFV and that PGE1 was present in the condensate at this time. In the only other report of aerosol therapy during HFV, Dijk et al. have shown similar deposition (~10%) following jet nebulization of comparable doses of surfactant during CMV and HFV (36). Clinical experience also suggests that inhaled drugs like albuterol, and inhaled nitric oxide are effective during CMV and HFV at comparable doses.
Aerodynamic Particle Size Distribution
Physicochemical properties of drug solution may affect particle size and consequently lung deposition (37). It has previously been shown that during jet nebulization, the droplet-size is inversely proportional to viscosity (in the range 0.5 – 20 cP). However, increase in viscosity is associated with a decrease in aerosol output. Thus, the least viscous fluids produce aerosols with the highest respirable fraction. Although a lower surface tension has been reported to be associated with increased aerosol output, this has not been confirmed by other investigators. The PGE1 solution prepared in 0.9% normal saline in this study had a viscosity comparable to that of water and surface tension lower than that of water making it ideal for generating aerosols.
Particle sizes from nebulizers are classified according to aerodynamic diameter which accounts for both the density and irregular shape of drug particles and more accurately predicts the behavior of the aerosol (18). The proportion of the aerosol that can penetrate beyond terminal bronchioles to gas exchange regions is called the respirable fraction (RF) (38). The RF in adults and older children consists of particles < 5 µm in diameter, although recent studies suggest that a particle size closer to 2.5 µm is more accurate in predicting alveolar deposition especially in infants (16, 39, 40). In this study, the PGE1 aerosol had a high respirable fraction with 90% of the particles < 4.0 µm and 88% of the particles < 2.0 µm.
Despite the important findings described in this study, there are potential deficiencies. Limitations of our study include the relative inefficiency of the aerosol collecting system and our inability to mimic the complex anatomy of the neonatal respiratory system and the effect of disease state on aerosol drug delivery. Although we have evaluated for the first time the APSD of the PGE1 aerosol generated by jet nebulization, the effects of other nebulizer-, ventilator- and patient-related factors need to be investigated further. It is important to recognize that cascade impactor data may not reflect in vivo conditions (18, 41–43). The hygroscopic particles of most therapeutic aerosols are subject to evaporation in the cascade impactor, while the particles delivered into the lungs are exposed to a much more humid environment thus increasing their size and altering their aerodynamic behavior (41). Moreover, drug concentration and particle size can change over the course of nebulization; this was not evaluated in the study. However, earlier studies have shown that there is little variation in aerosol particle size during continuous nebulization despite changes in temperature, drug concentration, viscosity and surface tension (37, 41).
Conclusions
Our study is unique in several aspects. We have shown for the first time that PGE1 can be nebulized safely and delivered efficiently in a neonatal CMV or HFV circuit. The nebulizer set up is simple to use and results in rapid nebulization of the drug without altering the chemical structure of PGE1. In addition, we have developed a LC-MS method for the quantification of PGE1 in physiological saline that is sensitive, reproducible, selective for the analyte, and has a wide dynamic range of quantitation. The emitted dose determined during CMV and HFV is probably an underestimation. Better aerosol capturing techniques are needed to more accurately determine emitted dose. We have also demonstrated that the APSD of PGE1 following jet nebulization in a neonatal ventilator circuit is characterized by a small MMAD and large GSD with majority of the partcles < 4 µm in size that would favor alveolar deposition. Further studies are needed to evaluate actual lung deposition in vivo following jet nebulization of PGE1, effect of nebulizer-, ventilator-, and patient-related factors on drug delivery, its relation to response and linkage with receptor sites.
Acknowledgements
This research was funded by Grant 1 K23 HD41423-01 from the National Institute of Child Health and Human Development and supported by grants from the Sarnaik Endowment Fund, Children’s Research Center of Michigan. Dr Sandro R. P. da Rocha is gratefully acknowledged for help in surface tension and viscosity measurements. We are grateful to Bill Chiang, President of California Measurements, Sierra Madre, CA, for technical expertise with the cascade impactor analysis.
ABBREVIATIONS
- APSD
aerodynamic particle size distribution
- CMV
conventional mechanical ventilation
- ETT
endotracheal tube
- FIO2
Fractional inspired oxygen concentration
- GSD
geometric standard deviation
- HFV
High frequency ventilation
- HPLC
High performance liquid chromatography
- INO
inhaled nitric oxide
- LC-MS
liquid chromatography - mass spectrometry
- MRM
Multiple reaction monitoring
- MMAD
mass median aerodynamic diameter
- NHRF
neonatal hypoxemic respiratory failure
- PGE1
prostaglandin E1
- RF
respirable fraction
- SPV
selective pulmonary vasodilator
Footnotes
Publisher's Disclaimer: This is a PDF file of an unedited manuscript that has been accepted for publication. As a service to our customers we are providing this early version of the manuscript. The manuscript will undergo copyediting, typesetting, and review of the resulting proof before it is published in its final citable form. Please note that during the production process errors may be discovered which could affect the content, and all legal disclaimers that apply to the journal pertain.
REFERENCES
- 1.NINOS. Inhaled nitric oxide in full-term and nearly full-term infants with hypoxic respiratory failure. The Neonatal Inhaled Nitric Oxide Study Group. N Engl J Med. 1997;336:597–604. doi: 10.1056/NEJM199702273360901. [DOI] [PubMed] [Google Scholar]
- 2.Walmrath D, Schermuly R, Pilch J, Grimminger F, Seeger W. Effects of inhaled versus intravenous vasodilators in experimental pulmonary hypertension. Eur Respir J. 1997;10:1084–1092. doi: 10.1183/09031936.97.10051084. [DOI] [PubMed] [Google Scholar]
- 3.Meyer J, Theilmeier G, Van Aken H, Bone HG, Busse H, Waurick R, Hinder F, Booke M. Inhaled prostaglandin E1 for treatment of acute lung injury in severe multiple organ failure. Anesth Analg. 1998;86:753–758. doi: 10.1097/00000539-199804000-00015. [DOI] [PubMed] [Google Scholar]
- 4.Putensen C, Hormann C, Kleinsasser A, Putensen-Himmer G. Cardiopulmonary effects of aerosolized prostaglandin E1 and nitric oxide inhalation in patients with acute respiratory distress syndrome. Am J Respir Crit Care Med. 1998;157:1743–1747. doi: 10.1164/ajrccm.157.6.9609017. [DOI] [PubMed] [Google Scholar]
- 5.Sood BG, Delaney-Black V, Aranda JV, Shankaran S. Aerosolized PGE1: A Selective Pulmonary Vasodilator in Neonatal Hypoxemic Respiratory Failure Results of a Phase I/II Open Label Clinical Trial. Pediatr Res. 2004;56:579–585. doi: 10.1203/01.PDR.0000139927.86617.B6. [DOI] [PMC free article] [PubMed] [Google Scholar]
- 6.Youngerand EW, Szabo RM. The stability of prostaglandin E1 in dilute physiological solutions at 37 degrees C. Prostaglandins. 1986;31:923–927. doi: 10.1016/0090-6980(86)90024-9. [DOI] [PubMed] [Google Scholar]
- 7.Krakoff LR, Vlachakis N, Mendlowitz M, Stricker J. Differential effect of prostaglandin A1 in hypertensive patients with low, normal and high renin. Clinical science and molecular medicine. 1975;2:311s–313s. doi: 10.1042/cs048311s. [DOI] [PubMed] [Google Scholar]
- 8.Peskar BA, Cawello W, Rogatti W, Rudofsky G. On the metabolism of prostaglandin E1 administered intravenously to human volunteers. J Physiol Pharmacol. 1991;42:327–331. [PubMed] [Google Scholar]
- 9.Thiel CG. Cascade impactor data and the lognormal distribution: nonlinear regression for a better fit. J Aerosol Med. 2002;15:369–378. doi: 10.1089/08942680260473443. [DOI] [PubMed] [Google Scholar]
- 10.USP. General Chapter (601) Aerosols. Rockville, MD: United States Pharmacopeial Convention; 2000. p. 1912. [Google Scholar]
- 11.Awad JA, Soteriou MC, Drougas JG, Stokes KA, Roberts LJ, 2nd, Pinson CW. Plasma prostaglandin E1 concentrations and hemodynamics during intravenous infusions of prostaglandin E1 in humans and swine. Transplantation. 1996;61:1624–1629. doi: 10.1097/00007890-199606150-00013. [DOI] [PubMed] [Google Scholar]
- 12.Drummond WH, Gregory GA, Heymann MA, Phibbs RA. The independent effects of hyperventilation, tolazoline, and dopamine on infants with persistent pulmonary hypertension. J Pediatr. 1981;98:603–611. doi: 10.1016/s0022-3476(81)80775-5. [DOI] [PubMed] [Google Scholar]
- 13.Graves ED, 3rd, Redmond CR, Arensman RM. Persistent pulmonary hypertension in the neonate. Chest. 1988;93:638–641. doi: 10.1378/chest.93.3.638. [DOI] [PubMed] [Google Scholar]
- 14.Radermacher P, Santak B, Becker H, Falke KJ. Prostaglandin E1 and nitroglycerin reduce pulmonary capillary pressure but worsen ventilation-perfusion distributions in patients with adult respiratory distress syndrome. Anesthesiology. 1989;70:601–606. doi: 10.1097/00000542-198904000-00008. [DOI] [PubMed] [Google Scholar]
- 15.Walsh-Sukys MC, Tyson JE, Wright LL, Bauer CR, Korones SB, Stevenson DK, Verter J, Stoll BJ, Lemons JA, Papile LA, Shankaran S, Donovan EF, Oh W, Ehrenkranz RA, Fanaroff AA. Persistent pulmonary hypertension of the newborn in the era before nitric oxide: practice variation and outcomes. Pediatrics. 2000;105:14–20. doi: 10.1542/peds.105.1.14. [DOI] [PubMed] [Google Scholar]
- 16.Sangwan S, Condos R, Smaldone GC. Lung deposition and respirable mass during wet nebulization. J Aerosol Med. 2003;16:379–386. doi: 10.1089/089426803772455631. [DOI] [PubMed] [Google Scholar]
- 17.Siobal MS, Kallet RH, Pittet JF, Warnecke EL, Kraemer RW, Venkayya RV, Tang JF. Description and evaluation of a delivery system for aerosolized prostacyclin. Respir Care. 2003;48:742–753. [PubMed] [Google Scholar]
- 18.Hess D, Fisher D, Williams P, Pooler S, Kacmarek RM. Medication nebulizer performance. Effects of diluent volume, nebulizer flow, and nebulizer brand. Chest. 1996;110:498–505. doi: 10.1378/chest.110.2.498. [DOI] [PubMed] [Google Scholar]
- 19.US Pharmacopoeia. Rockville: United States Pharmacopeial Convention; 2000. pp. 65–67. [Google Scholar]
- 20.Dennis JH. Standardization issues: in vitro assessment of nebulizer performance. Respir Care. 2002;47:1445–1455. discussion 1455–1448. [PubMed] [Google Scholar]
- 21.Coleman DM, Kelly HW, McWilliams BC. Determinants of aerosolized albuterol delivery to mechanically ventilated infants. Chest. 1996;109:1607–1613. doi: 10.1378/chest.109.6.1607. [DOI] [PubMed] [Google Scholar]
- 22.Tandon R, McPeck M, Smaldone GC. Measuring nebulizer output. Aerosol production vs gravimetric analysis. Chest. 1997;111:1361–1365. doi: 10.1378/chest.111.5.1361. [DOI] [PubMed] [Google Scholar]
- 23.Ip AY, Arakawa T, Silvers H, Ransone CM, Niven RW. Stability of recombinant consensus interferon to air-jet and ultrasonic nebulization. Journal of pharmaceutical sciences. 1995;84:1210–1214. doi: 10.1002/jps.2600841013. [DOI] [PubMed] [Google Scholar]
- 24.Newman SP, Pitcairn GR, Hooper G, Knoch M. Efficient drug delivery to the lungs from a continuously operated open-vent nebulizer and low pressure compressor system. Eur Respir J. 1994;7:1177–1181. [PubMed] [Google Scholar]
- 25.Awberyand JH, Inst FP. The water content of saturated air at temperatures up to 100°C. Proc Phy Soc. 1932;44:143–150. [Google Scholar]
- 26.CRC Handbook of Chemistry and Physics. Boca Raton: CRC Press, Inc.; 1985. [Google Scholar]
- 27.Dhand R. Aerosol Therapy during Mechanical Ventilation: Getting Ready for Prime Time. Am J Respir Crit Care Med. 2003;168:1148–1149. doi: 10.1164/rccm.2309008. [DOI] [PubMed] [Google Scholar]
- 28.Fink JB, Dhand R, Grychowski J, Fahey PJ, Tobin MJ. Reconciling in vitro and in vivo measurements of aerosol delivery from a metered-dose inhaler during mechanical ventilation and defining efficiency-enhancing factors. Am J Respir Crit Care Med. 1999;159:63–68. doi: 10.1164/ajrccm.159.1.9803119. [DOI] [PubMed] [Google Scholar]
- 29.Di Paolo ER, Pannatier A, Cotting J. In vitro evaluation of bronchodilator drug delivery by jet nebulization during pediatric mechanical ventilation. Pediatr Crit Care Med. 2005;6:462–469. doi: 10.1097/01.PCC.0000162452.68144.27. [DOI] [PubMed] [Google Scholar]
- 30.Dijk PH, Heikamp A, Piers DA, Weller E, Bambang Oetomo S. Surfactant nebulisation: safety, efficiency and influence on surface lowering properties and biochemical composition. Intensive Care Med. 1997;23:456–462. doi: 10.1007/s001340050358. [DOI] [PubMed] [Google Scholar]
- 31.McPeck M, Tandon R, Hughes K, Smaldone GC. Aerosol delivery during continuous nebulization. Chest. 1997;111:1200–1205. doi: 10.1378/chest.111.5.1200. [DOI] [PubMed] [Google Scholar]
- 32.Pelkonen AS, Nikander K, Turpeinen M. Jet nebulization of budesonide suspension into a neonatal ventilator circuit: synchronized versus continuous nebulizer flow. Pediatric pulmonology. 1997;24:282–286. doi: 10.1002/(sici)1099-0496(199710)24:4<282::aid-ppul7>3.0.co;2-m. [DOI] [PubMed] [Google Scholar]
- 33.Briant JK, Frank DD, James AC, Eyler LL. Numerical simulation of aerosol particle transport by oscillating flow in respiratory airways. Annals of biomedical engineering. 1992;20:573–581. doi: 10.1007/BF02368606. [DOI] [PubMed] [Google Scholar]
- 34.Schererand PW, Haselton FR. Convective exchange in oscillatory flow through bronchial-tree models. Journal of applied physiology: respiratory, environmental and exercise physiology. 1982;53:1023–1033. doi: 10.1152/jappl.1982.53.4.1023. [DOI] [PubMed] [Google Scholar]
- 35.Coates AL, Allen PD, MacNeish CF, Ho SL, Lands LC. Effect of size and disease on estimated deposition of drugs administered using jet nebulization in children with cystic fibrosis. Chest. 2001;119:1123–1130. doi: 10.1378/chest.119.4.1123. [DOI] [PubMed] [Google Scholar]
- 36.Dijk PH, Heikamp A, Oetomo SB. Surfactant nebulization versus instillation during high frequency ventilation in surfactant-deficient rabbits. Pediatr Res. 1998;44:699–704. doi: 10.1203/00006450-199811000-00012. [DOI] [PubMed] [Google Scholar]
- 37.McCallion ON, Taylor KM, Thomas M, Taylor AJ. Nebulization of fluids of different physicochemical properties with air-jet and ultrasonic nebulizers. Pharm Res. 1995;12:1682–1688. doi: 10.1023/a:1016205520044. [DOI] [PubMed] [Google Scholar]
- 38.Katz SL, Adatia I, Louca E, Leung K, Humpl T, Reyes JT, Coates AL. Nebulized therapies for childhood pulmonary hypertension: an in vitro model. Pediatr Pulmonol. 2006;41:666–673. doi: 10.1002/ppul.20431. [DOI] [PubMed] [Google Scholar]
- 39.Barryand PW, O'Callaghan C. An in vitro analysis of the output of salbutamol from different nebulizers. Eur Respir J. 1999;13:1164–1169. doi: 10.1034/j.1399-3003.1999.13e37.x. [DOI] [PubMed] [Google Scholar]
- 40.Schuepp KG, Jauernig J, Janssens HM, Tiddens HA, Straub DA, Stangl R, Keller M, Wildhaber JH. In vitro determination of the optimal particle size for nebulized aerosol delivery to infants. J Aerosol Med. 2005;18:225–235. doi: 10.1089/jam.2005.18.225. [DOI] [PubMed] [Google Scholar]
- 41.Clay MM, Pavia D, Newman SP, Clarke SW. Factors influencing the size distribution of aerosols from jet nebulisers. Thorax. 1983;38:755–759. doi: 10.1136/thx.38.10.755. [DOI] [PMC free article] [PubMed] [Google Scholar]
- 42.Berlinskiand A, Waldrep JC. Four hours of continuous albuterol nebulization. Chest. 1998;114:847–853. doi: 10.1378/chest.114.3.847. [DOI] [PubMed] [Google Scholar]
- 43.Stapleton KW, Finlay WH. Errors in characterizing nebulized particle size distributions with cascade impactors. J Aerosol Med. 1998;11 Suppl 1:S80–S83. [PubMed] [Google Scholar]


