Abstract
Adoptive therapy with antigen-specific T cells is a promising approach for the treatment of infectious diseases and cancer. However, cloning of antigen-specific T cells by the traditional approach of limiting dilution is a time-consuming, laborious, and inefficient process. Here, we describe a novel flow cytometric strategy for rapid isolation of human tumor antigen-specific T-cell clones by using T-cell receptor (TCR) Vβ antibodies in combination with carboxyfluorescein succinimidyl ester (CFSE)-based proliferation assay. The CFSE dilution following antigen stimulation identified proliferating antigen-specific T cells, and the TCRVβ antibodies allowed distinguishing T cells at the clonal level from a heterogeneous T-cell population. This method of TCR Vβ/CFSE dilution was used for the isolation of four different human lymphoma and melanoma-specific CD4+ and CD8+ T-cell clones reactive against defined and undefined tumor antigens. Isolated tumor-specific T-cell clones could be expanded to large numbers ex vivo while maintaining phenotype, function, and tumor antigen specificity. The method was simple, efficient, and reproducible, and may have potential application for the development of adoptive immunotherapeutic strategies.
Keywords: T cells, cloning, TCR, Vbeta, tumor, human, cancer, melanoma, lymphoma
INTRODUCTION
Adoptive T-cell therapy with antigen-specific T cells is a promising approach for the treatment of certain infectious diseases and cancer. However, isolation of antigen-specific T-cell clones from a heterogeneous T-cell population by the traditional approach of limiting dilution is often challenging.1–5 First, it is labor-intensive and inefficient. Second, it is time-consuming and requires a minimum of several weeks to generate adequate numbers of T cells. Third, reproducible isolation of a T-cell clone from a heterogeneous T-cell population is difficult.
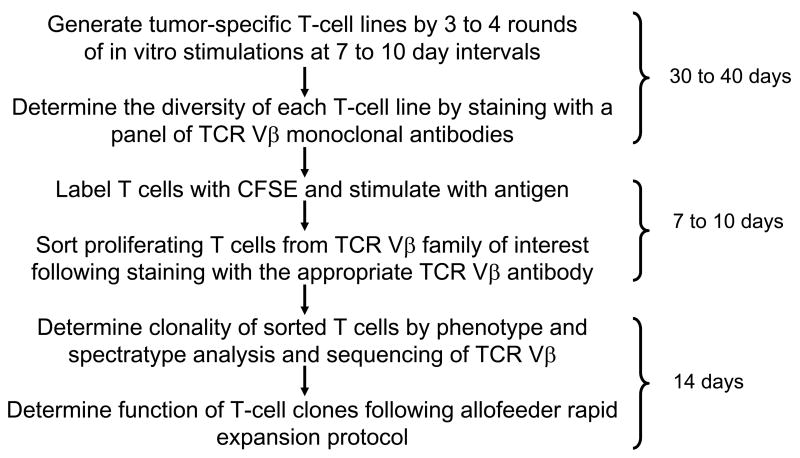
To address these obstacles, we developed a novel flow cytometric strategy for isolation of antigen-specific T-cell clones using T-cell receptor (TCR) Vβ antibodies in combination with carboxyfluorescein succinimidyl ester (CFSE)-based proliferation assay (Fig. 1). The CFSE dilution following antigen stimulation identifies proliferating antigen-specific T cells,6–8 and the TCRVβ antibodies allows for distinguishing T cells at the clonal level. Here, we demonstrate that this method of TCRVβ/CFSE dilution can be used for the rapid isolation of human tumor-specific CD4+ and CD8+ T-cell clones from a heterogeneous T-cell population. Using this method, we successfully cloned lymphoma- and melanoma-specific T cells from both peripheral blood and tumor-infiltrating lymphocyte (TIL) populations. As compared with the traditional limiting dilution approach, this method is simple, efficient, and highly reproducible.
Figure 1. Schema for isolation of tumor-specific T-cell clones using the TCR Vβ/CFSE dilution method.
The time required for each step is shown on the right side of the figure.
MATERIALS AND METHODS
Patient samples
All patient and normal donor samples were obtained after informed consent on an institutional review board-approved clinical or laboratory protocol. Lymph node biopsies obtained from patients with follicular lymphoma at the time of initial diagnosis were processed into a single cell suspension and cryopreserved. Peripheral blood mononuclear cells (PBMC) were isolated from peripheral blood by density gradient separation with Ficoll-Isopaque (ICN Biomedicals Inc., Aurora, OH) and cryopreserved.
Generation of lymphoma-reactive T-cell lines
To generate T-cell lines, resident T cells were isolated from cryopreserved lymph node specimens by B-cell depletion using CD19 magnetic beads (Miltenyi Biotec, Auburn, CA) according to the manufacturer’s instructions. T cells were also isolated from PBMC using pan-T cell isolation kit (Miltenyi Biotech). Lymphoma tumor cells were enriched from cryopreserved cells from the lymph node biopsy specimen by depletion of T cells with CD3 microbeads over a magnetic column (Miltenyi Biotec). Normal B cells and monocytes were isolated from autologous PBMC by magnetic cell separation using a B-cell isolation kit or monocytes isolation kit (Miltenyi Biotec). The purity of the isolated tumor cells, B cells, monocytes, and T cells was greater than 95%. Tumor cells were activated for 3 days with recombinant human soluble CD40 ligand trimer (800 ng/ml) (sCD40L - Amgen, Thousand Oaks, CA) and recombinant human IL-4 (2 ng/ml) (Peprotech, Rocky Hill, NJ) prior to co-culture with T cells as previously described.9 To generate tumor-reactive T-cell lines, T cells were stimulated four times in vitro with CD40L-activated autologous tumor cells at ten-day intervals. Cells were cultured in RPMI 1640 medium supplemented with 5% human AB serum (Gemini Bio-Products, Sacramento, CA), 10 mM HEPES, 1× Glutamax, 50 μM β-mercaptoethanol (Sigma, St. Louis, MO), 1 mM sodium pyruvate (Gibco), 100 U/ml penicillin+100 μg/ml streptomycin, 10 μg/ml gentamicin (Gibco), 10 IU/ml recombinant human IL-2 (National Cancer Institute Biological Research Branch Pre-Clinical Repository, Frederick, MD), and 10 ng/ml recombinant human IL-15 (Peprotech) at 37°C and 5% CO2 in air.9
Generation of melanoma-reactive T-cell lines from TIL
Tumor-infiltrating lymphocytes (TIL) from melanoma were processed as previously described.10 Briefly, single tumor fragments (1–2 mm diameter) were cultured in 24-well tissue culture plates in 2 ml of complete medium (CM) supplemented with 10% human AB serum (Valley Biomedical, Winchester, VA) plus 6000 IU/ml of recombinant human (rh) IL-2 (Chiron Corp., Emeryville, CA). CM consisted of RPMI 1640 (Invitrogen, Frederick, MD), 25 mM HEPES pH 7.2, 100 U/ml penicillin, 100 μg/ml streptomycin (Invitrogen), and 2 mM L-glutamine (Invitrogen, Carlsbad, CA). The cells were maintained at 37°C and 5% CO2 in air and half of the medium was replaced in all wells no later than 1 week after culture initiation. Subsequently, the cultures were split to maintain a cell density of 0.8 to 2 × 10⁶ cells/ml, or half of the media was replaced twice weekly.
Generation of MART-1 specific T cell lines from PBMC
PBMC were obtained from normal donors who expressed HLA-A*0201. Dendritic cells (DCs) were generated by culturing adherent cells from thawed PBMC in CM supplemented with 10% human AB serum (Valley Biomedical) plus 800 U/ml rhGM-CSF and 1,000 U/ml rhIL-4 (R & D Systems). After 6 days of culture, 10 ng/ml rhIL-1β, 10 ng/ml rhTNF-α, 15 ng/ml rhIL-6 (R&D Systems) and 1 μg/ml prostaglandin E2 (Sigma) were added for 2 days to obtain mature DCs. Activated B cells were generated by stimulation of autologous PBMC with 3T3-CD40L fibroblasts for 5 days in the presence of 200 U/ml rhIL-4, 10 ng/ml insulin, and 1.2 μM cyclosporine A. Activated B cells were further stimulated twice in vitro every 3 to 4 days with 3T3-CD40L cells to expand B cells. MART-1-reactive T cells were generated by sequential stimulation of thawed donor PBMC once with HLA-A2-restricted melanoma peptide antigen MART-1(27-35)-pulsed DCs (5 μg/ml) and twice with CD40L-activated autologous B cells at weekly intervals. PBMC and DC were cocultured at a ratio of 10: 1 and T-cells and CD40L activated B cells were cocultured at a ratio of 1: 1. T cells were fed with 300 U/ml rhIL-2 after each stimulation. MART-1 specific T cells were tested by MART-1 tetramer (BD/Pharmingen) staining after the second and third stimulation.
Cytokine induction assay
To test reactivity of lymphoma-reactive T-cell lines or clones, T cells (1 × 10⁶/well) were cultured in a 48-well plate in the absence or presence of autologous tumor cells or autologous normal B cells or monocytes (1 × 10⁶/well each) in 1 ml of culture medium. Supernatants were harvested after 24 hours of incubation at 37°C in 5% CO2, and cytokine production (IFN-γ and GM-CSF) was measured by ELISA using coupled antibody pairs (Endogen, Woburn, MA).9, 11 For MHC blocking experiments, autologous tumor cells were incubated for 2 hours with 10 μg/ml of monoclonal antibodies against MHC class I or II or HLA-DP, DQ or DR antibodies or isotype-matched control antibodies (BD Pharmingen, San Diego, CA) prior to coculturing with T cells.9, 11
To test reactivity of melanoma-reactive T-cell lines, T cells (1 × 10⁵/well) were incubated with 1 × 10⁵/well stimulator cells in 96-well plates with 200 μl/well CM. The stimulator cells were as follows: 2 HLA-A2-negative (Mel 888 and Mel 938) and 2 HLA-A2-positive (Mel 526 and Mel 624) melanoma cell lines, and 2 HLA-A2 gene-transduced melanoma cell lines (Mel 888/A2, Mel 938/A2), all expressing MART-1. T cells were also stimulated with the TAP-deficient T2 cell line which had been pulsed with titrated MART-1(27-35) peptide. After 24 hrs, supernatants were collected and IFN-γ release was measured by ELISA.
Intracellular cytokine assay
For lymphoma-reactive T-cell lines, T cells (0.5 × 10⁶) were cultured with either medium alone or autologous tumor cells (0.5 × 10⁶) in 96-well V-bottom plates for 14 hours. Brefeldin A (5 μg/ml) (Sigma-Aldrich, St. Louis, MO) was added for the last 12 hours.9 For melanoma-reactive T-cell lines or clones, 0.2 × 10⁶ T cells were incubated in the presence of 0.2 × 10⁶ target cells (Mel 938/A2, Mel 938, T2, T2 pulsed with MART-1(27-35)) and 1 μl/ml GolgiPlug (BD/Pharmingen) for 4h. After the incubation period, cells were harvested, fixed, permeabilized, and stained for surface markers and intracellular cytokines by fluorochrome-labeled monoclonal antibodies. FACS permeabilization solution, anti-human CD3 fluorescein isothiocyanate (FITC), anti-human tumor necrosis factor-α (TNF-α) phycoerythrin (PE), anti-human IFN-γ PE, anti-human CD4 PerCP-Cy 5.5, anti-human CD8 APC, anti-human CD3-APC, and anti-human CD69-APC were obtained from Becton Dickinson (Palo Alto, CA).
CD107a staining
CD8 T cells (0.2 × 10⁶) were incubated in the presence of 0.2 × 10⁶ target cells in 100 μl of CM supplemented with 5% human AB serum with 1:40 anti-CD107a PE (Becton Dickinson) in a 96-well U bottom plate for 4 h at 37°C in 5% CO2. After the incubation, cells were harvested, stained for other surface markers, and analyzed by FACS Calibur (Becton Dickinson Immunocytometry Systems, San Jose, CA) as previously described.12
TCR Vβ staining
T-cell lines were stained with TCR Vβ antibody panel IOTest Beta Mark (Beckman Coulter, Miami, FL), which contains a set of monoclonal antibodies against 24 members of the human TCRVβ family, and analyzed by FACS Calibur (BD). Optimal compensation and gain settings were determined for each experiment based on unstained and single-stained samples according to the manufacturer’s guidelines. Monoclonal TCRVβ antibodies labeled with PE (Beckman Coulter) were used for sorting of T cells.
CFSE labeling and sorting of proliferating T cells
T cells were harvested and resuspended in PBS at a concentration of 5 to 10 × 106/ml, and labeled with CFSE (Molecular Probes, Eugene, OR) to a final concentration of 5 μM for 10 min at room temperature. Labeling was terminated by adding prewarmed complete medium and cells were incubated at 37°C for 5 min. CFSE-labeled T cells were stimulated with antigenic stimulus as described above and after 7 to 10 days of expansion in the presence of IL-2, T cells were harvested and stained with anti-human CD4-APC or CD8-APC and anti-human monoclonal antibody-PE against the TCRVβ family of interest (Beckman Coulter) for each T-cell line. Proliferating CD4+/TCRVβ+ or CD8+/TCRVβ+ T cells were identified based on CFSE dilution (CFSEdim) and were sorted on a FACS Aria (BD Immunocytometry Systems). Sorted T cells were expanded by a rapid expansion protocol (REP) with allo-feeder PBMCs and EBV-transformed B cells in the presence of rhIL-2 at 6,000 U/ml and OKT3 as previously described.10, 13
TCRVβ cloning
Polymerase chain reaction (PCR) was performed using a panel of optimized primers specific for 24 members of the TCRVβ family. Briefly, RNA was extracted from 1 × 10⁶ T cells using Trizol (Invitrogen, Carlsbad, CA) according to the manufacturer’s instructions. The extracted RNA (1 μg) was treated with DNAse (Ambion, Austin, TX) to remove contaminating genomic DNA. All of the DNAse-treated RNA was used to synthesize cDNA by reverse transcription using the manufacturer’s protocol with the SuperScript™ III Reverse Transcriptase (Invitrogen). PCR was then performed by combining 0.5 μM of one Vβ primer for each of the different TCR-Vβ families with 0.5 μM of a Cβ primer, which was used for each of the 24 reactions. The PCR products were visualized on an agarose gel. Dominant bands were excised and purified using the Qiaquick gel extraction kit (Qiagen, Valencia, CA). Purified PCR products were cloned into the pCR 2.1 vector and expressed in E. coli using the Original TA Cloning Kit (Invitrogen). Colonies were randomly selected and DNA was obtained by miniprep using the Qiaprep miniprep kit (Qiagen) according to the manufacturer’s instructions. DNA from randomly selected colonies was sequenced using M13 primers and an ABI 377 DNA Sequencer (Perkin Elmer).
TCRVβ spectratype analysis
For TCRVβ spectratype analysis, PCR products were diluted in nuclease-free water so that 1.5 ng of the PCR product from each TCR Vβ family was subjected to capillary electrophoresis using a 310 Genetic Analyzer single capillary electrophoresis machine (Perkin Elmer, Fremont, CA), and then analyzed using Genescan software (Perkin Elmer). Because the positions of the 5′Vβ and the 3′Cβ primers are fixed, variation in length of the PCR fragments within any TCR Vβ family is due to differences in length of the CDR3 regions. Genescan data are presented as fluorescence intensity versus DNA fragment length. The TCR Vβ10 and Vβ19 families are pseudogenes and were therefore excluded from analysis.
RESULTS
Tumor antigen reactivity of CD4+ and CD8+ T-cell lines
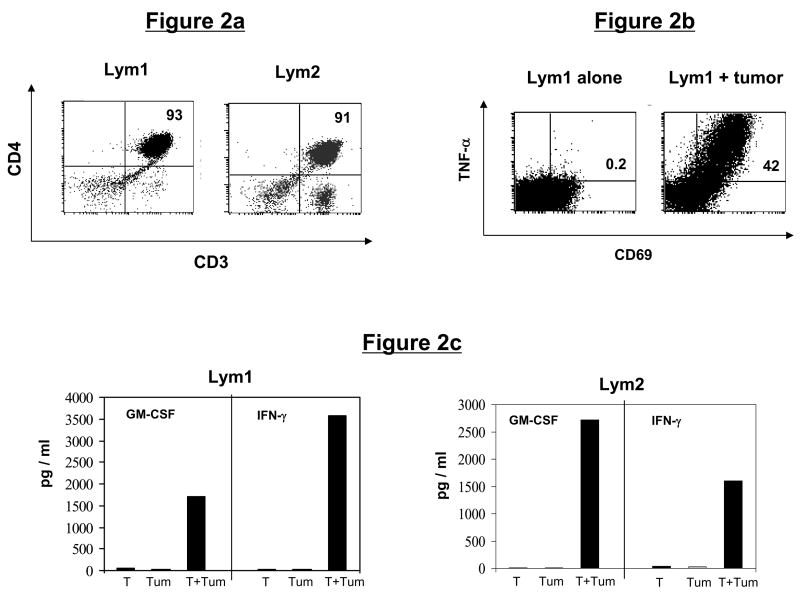
We initially generated multiple tumor-reactive CD4+ and CD8+ T-cell lines reactive against primary follicular lymphoma cells or against a defined melanoma tumor antigen, MART-1. The CD4+ T-cell lines were generated from tumor-infiltrating lymphocytes (TIL) or peripheral blood mononuclear cells (PBMC) from two different patients with follicular lymphoma (Lym). Phenotypically, the Lym1 line (derived from TIL) and Lym2 line (derived from PBMC) consisted of 93% and 91% CD4+ T cells, respectively (Fig. 2a). Both T-cell lines produced significant amounts of TNF-α, GM-CSF, and/or IFN-γ in response to stimulation with autologous lymphoma cells (Figs. 2b and c), and greater than 40% of the CD4+ T cells in the Lym1 line were tumor-reactive, as measured by intracellular cytokine staining and CD69 upregulation (Fig. 2b).
Figure 2. Phenotype and tumor reactivity of CD4+ T-cell lines.
(a) Phenotype of lymphoma-specific T-cell lines. Follicular lymphoma (Lym)-specific T-cell lines were generated from TIL (Lym1) or PBMC (Lym 2) and analyzed by flow cytometry for CD3, CD4, and CD8 expression. (b and c) Tumor reactivity of lymphoma-specific T-cell lines. (b) Lym1 T cells were stimulated with autologous lymphoma tumor cells and assessed for intracellular TNF-α production. (c) Lym1 and Lym2 T-cells were stimulated for 24 hours with autologous tumor cells (Tum) and cell supernatants were analyzed for specific secretion of cytokines GM-CSF and IFN-γ by ELISA.
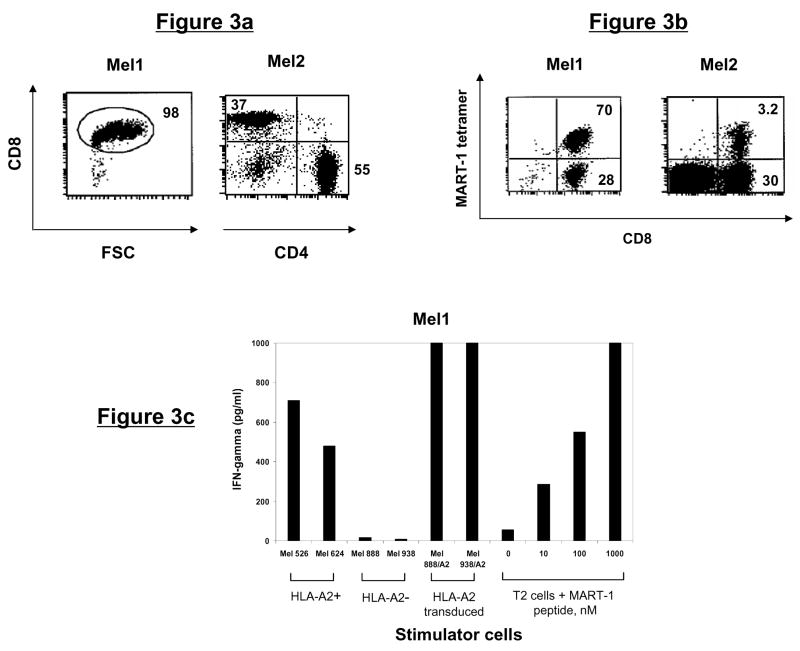
Similarly, melanoma-specific CD8+ T-cell lines were generated either from TIL derived from an HLA-A2+ patient with metastatic melanoma (Mel1), or PBMC from an HLA-A2+ healthy donor (Mel2, refer to Methods). Phenotypically, the Mel1 and Mel2 lines consisted of 98% and 37% CD8+ T cells, respectively (Fig. 3a). To determine whether these T-cell lines were specific for known tumor antigens, we stained with HLA-A2 tetramers specific for melanoma antigens MART-1 or gp100. We observed that 70.2% of the T cells from Mel1 line and 3.2% of the T cells from Mel2 line were MART-1 tetramer-reactive (Fig. 3b). The Mel1 line produced significant amounts of IFN-γ in response to stimulation with HLA-A2+ MART-1-positive melanoma cells Mel 526 and Mel 624. Furthermore, recognition of HLA-A2-transduced Mel 888/A2 and Mel 938/A2 melanoma cells but not the parental HLA-A2-negative tumor cells suggested that HLA-A2 was the restriction element (Fig. 3c). To confirm the antigen specificity of the Mel1 line, we tested their reactivity against MART-1(26-35) peptide (EAAGIGILTV) pulsed onto T2 cells. The Mel1 cells produced significant amounts IFN-γ with as little as 10 nM of peptide (Fig. 3c). Taken together, these results demonstrated that the Mel1 line specifically recognized MART-1(27-35) peptide in the context of HLA-A2 molecules.
Figure 3. Phenotype and tumor antigen reactivity of CD8+ T-cell lines.
(a) Phenotype of melanoma-specific T-cell lines. Melanoma (Mel)-specific T-cell lines were generated from TIL (Mel1) or PBMC (Mel 2) and analyzed by flow cytometry for CD3, CD4, and CD8 expression. (b) Mel1 and Mel2 T-cell lines were stained with HLA-A2/MART-1 tetramer and analyzed by flow cytometry. (c) Mel1 T cells were stimulated overnight with HLA-A2 matched or mismatched melanoma cell lines, HLA-A2 transduced melanoma cells, or T2 cells pulsed with MART-1 peptide at varying concentrations. Specific IFN-γ secretion was then determined by analyzing cell supernatants by ELISA.
T-cell receptor Vβ repertoire of CD4+ and CD8+ T-cell lines
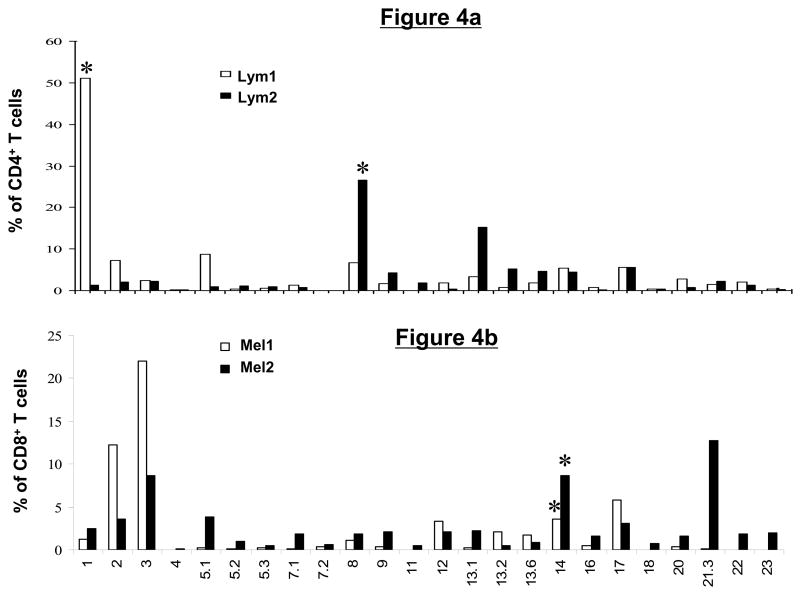
To determine the diversity within each T-cell line, we assayed with a panel of TCRVβ monoclonal antibodies that allow determination of approximately 70% of known Vβ specificities belonging to 24 Vβ subfamilies. We observed that certain Vβ subfamilies were overrepresented in each T-cell line. In the Lym1 line, 51% of the CD4+ T cells were Vβ1 positive and in the Lym2 line, 27% and 15% of the CD4+ T cells reacted with Vβ8 and Vβ13.2, respectively (Fig. 4a). In the Mel1 line, Vβ3 and Vβ2 were the most prevalent Vβ subtypes, staining 22% and 12% of the CD8+ T cells, respectively. In the Mel2 line, Vβ21.3, Vβ14, and Vβ3 were the most abundant, representing 14%, 8.7%, and 8% of CD8+ T cells, respectively (Fig. 4b).
Figure 4. Tumor-reactive CD4+ and CD8+ T-cell lines have a diverse T-cell receptor Vβ repertoire.
Tumor-reactive T-cell lines were stained with a set of monoclonal antibodies specific for 24 members of the human TCR Vβ family and analyzed by flow cytometry. Shown is a summary graph depicting the percentage of total T cells represented by each Vβ family member in the lymphoma (a) and melanoma (b)-reactive T-cell lines. Asterisks indicate the subset of T cells that were subsequently sorted and cloned based on Vβ expression and CFSE dilution following tumor stimulation.
Isolation of tumor antigen-specific T-cell clones
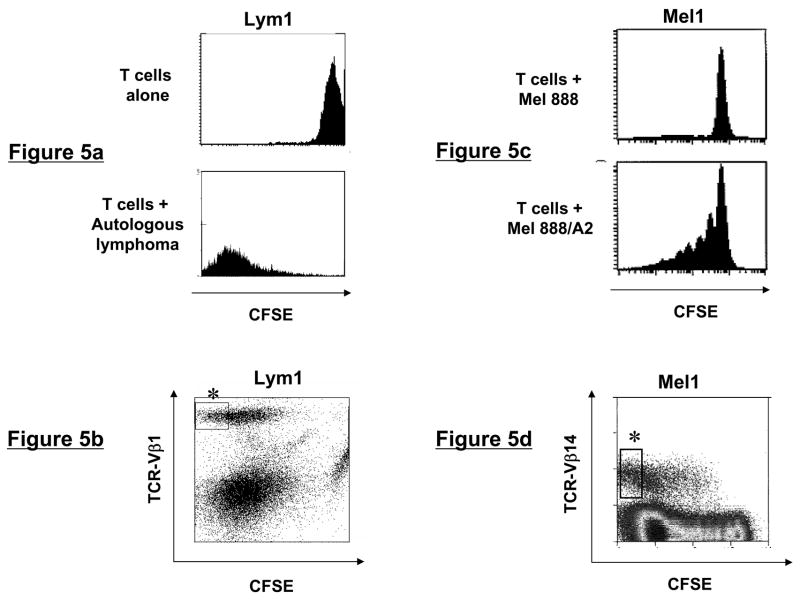
To isolate lymphoma-specific CD4+ T-cell clones, T cells from Lym1 and Lym2 lines were CFSE labeled and stimulated with autologous CD40L-activated lymphoma cells. After seven days of culture in the presence of IL-2 and IL-15, T cells were surface stained against the overrepresented TCRVβ families identified in each T-cell line (Fig. 4a). Proliferating CD4+ T cells in the TCRVβ1 and Vβ8 positive subsets from Lym1 and Lym2 lines respectively were identified by their CFSE dilution and sorted by flow cytometry (Figs. 5a and b and data not shown).
Figure 5. Flow cytometric sorting of tumor-reactive T-cells using TCR Vβ/CFSE dilution.
(a and c) CFSE dilution of T-cell lines following tumor stimulation. Lymphoma- and melanoma-specific T-cell lines were CFSE labeled and stimulated for one week with autologous lymphoma or allogeneic HLA-transduced melanoma tumor cells, respectively, then analyzed by flow cytometry. (b and d) Sorting strategy for TCRVβ+CFSEdim T cells. Following CFSE labeling and stimulation with tumor cells for 7 days, T cells were stained with the appropriate TCRVβ-specific antibodies and analyzed by flow cytometry. Shown are CD4-gated (Lym1) or CD8-gated (Mel1) T cells, with asterisks indicating the subpopulation of proliferating, CFSEdim cells that were sorted.
Similarly, isolation of tumor antigen-specific CD8+ T-cell clones from Mel1 and Mel2 lines was accomplished by CFSE labeling and stimulation with HLA-A2+MART-1+ melanoma cells or MART-1(27-35) peptide-pulsed dendritic cells, respectively. Mel1 cells proliferated specifically in response to Mel 888/A2 cells but not parental Mel 888 cells (Fig. 5c). As described above, Vβ3 and Vβ21.3 were the most overrepresented Vβ families in the Mel1 and Mel2 lines, respectively (Fig 4b) suggesting that they proliferated in response to in vitro antigenic stimulation. However, to demonstrate that this approach can be used to successfully isolate T-cell clones from subdominant Vβ families, we sorted proliferating TCRVβ14+ T cells from the Mel1 and Mel2 lines, where these cells represented only 4% and 9% of the CD8+ T cells, respectively (Fig. 5d and data not shown). Analysis of sorted T cells from all four T-cell lines demonstrated that their purity was greater than 99% for their respective TCRVβ subtype (data not shown).
Clonality of the sorted T cells
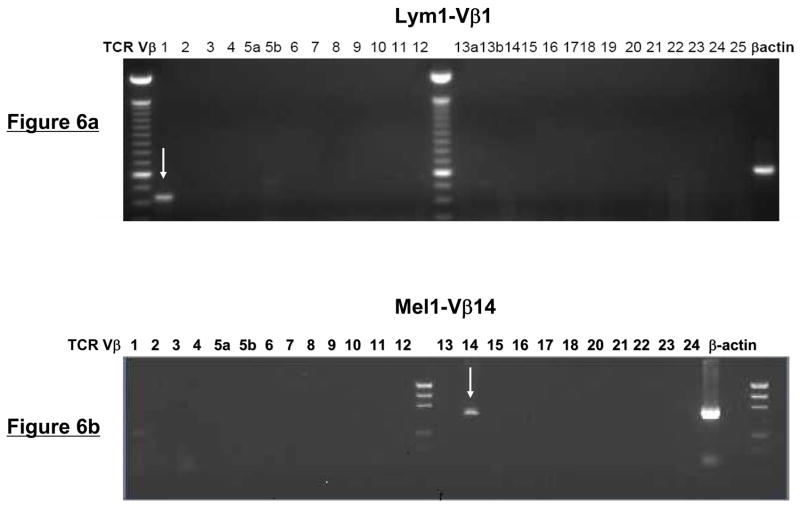
To determine whether the sorted Vβ+ T cells were clonal, we performed PCR amplification of the Vβ genes using a panel of optimized primers specific for 24 members of the TCRVβ family. Analysis of the PCR products demonstrated the presence of a single band in the appropriate Vβ subfamily within each of the four T-cell lines (Fig. 6a and b and data not shown). Spectratype analysis of the PCR products of the TCRVβ genes also showed a single dominant peak corresponding to the appropriate Vβ sorted from each of the four T-cell lines (Fig. 6c and d). Notably, no spectratype peaks were observed in any of the remaining TCRVβ families, including members that were highly overrepresented in the original T-cell lines (Fig. 6c and d and data not shown).
Figure 6. TCR Vβ/CFSE dilution isolated tumor-reactive T cells are clonal.
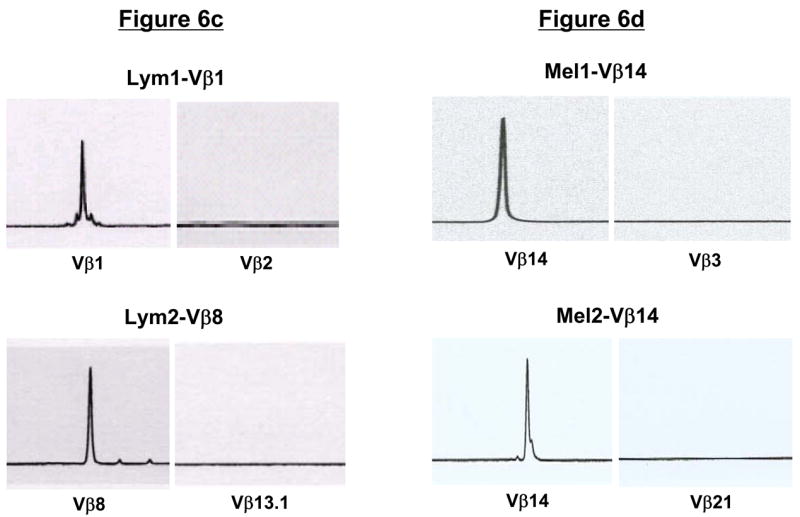
(a and b) PCR-based TCRVβ analysis of sorted, tumor-reactive T cells. Using a panel of optimized primers specific for 24 members of the TCRVβ family, PCR was performed on sorted Lym1 and Mel1 cells as a test of clonal purity. As indicated by arrows, PCR products were detected with only a single primer set corresponding to the appropriate FACSorted TCRVβ subtype. (c and d) TCRVβ spectratype analysis of sorted T cells. Following FACSorting, lymphoma- and melanoma-specific T cells were analyzed by TCRVβ spectratyping to confirm clonality of the sorted cells. Only the sorted TCRVβ subtypes (Vβ1, Vβ8, and Vβ14) were detected using this analysis, with no spectratype peaks detected for other Vβ subtypes that were prevalent within the T-cell populations prior to cell sorting.
To further confirm clonality, TCRVβ PCR products from the sorted Lym1-Vβ1 and Lym2-Vβ8 T-cells were cloned into a pCR2.1 vector. Following bacterial transformation and plasmid isolation, we found that 27 out of 27 plasmid clones from the Lym1-sorted T cells and 17 of 17 plasmid clones from the Lym2-sorted T cells had identical TCRVβ sequences (data not shown). Taken together, these results suggested that the T cells isolated by this novel approach were monoclonal. These results were shown to be reproducible by repeating the procedure three times for each of the four T-cell lines.
Phenotype and function of expanded CD4+ T-cell clones
We were able to expand the CD4+ T-cell clones to large numbers (>108) by using the allofeeder rapid expansion protocol (REP)10, 13 (Table 1 and data not shown). Phenotypic analysis of the CD4+ T-cell clones post-REP, demonstrated that greater than 99% of the T cells from Lym1-Vβ1 clone were CD4+Vβ1+ and greater than 98% of the T cells from Lym2-Vβ8 clone were CD4+Vβ8+ (Fig. 7a).
Table 1.
Characteristics of isolated T cell clones
| T-cell line | Sorted TCR Vβ subtype | T-cell line Vβ (%) | Sorted Vβ+ CFSE dim cells (%) | Fold expansion during REP | Post REP Vβ (%) | HLA restriction | Tumor antigen specificity | Confirmation of clonality |
|---|---|---|---|---|---|---|---|---|
| Lym1 | Vβ1 | 51 | 11.5 | 127 | 99 | DR | Lymphoma, undefined | Vβ spectratyping
Vβ sequencing |
| Lym2 | Vβ8 | 27 | 5.6 | 100 | 98 | DR | Lymphoma, undefined | Vβ spectratyping
Vβ sequencing |
| Mel1 | Vβ14 | 4 | 7.5 | 69 | 99 | A*0201 | Melanoma, MART-1(27-35) | Vβ spectratyping |
| Mel2 | Vβ14 | 9 | 1.8 | 60 | 99 | A*0201 | Melanoma, MART-1(27-35) | Vβ spectratyping |
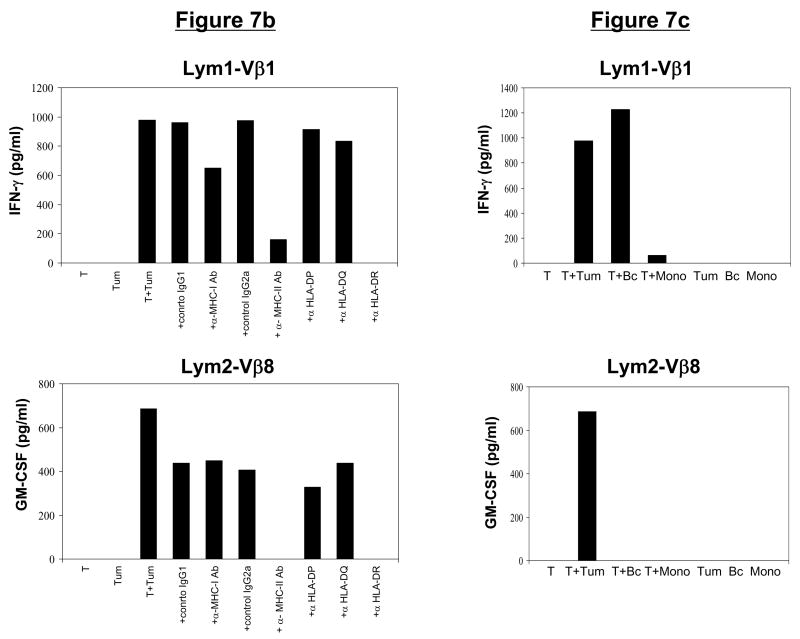
Figure 7. CD4+ T-cell clones maintain phenotype, function, and tumor-specificity following in vitro expansion.

(a) Phenotype of post-REP CD4+ T-cell clones. Following FACsorting and rapid expansion, CD4+ T-cell clones demonstrated a high level of purity, as determined by CD3, CD4, and Vβstaining. (b) Function of post-REP CD4+ T-cell clones. Lym1-Vβ1 and Lym2-Vβ8 T-cell clones produced IFN-γ or GM-CSF in response to stimulation with autologous lymphoma tumor cells. This cytokine secretion was blocked by antibodies specific for MHC class II or HLA-DR. (c) Specificity of post-REP CD4+ T-cell clones. Expanded Lym1-Vβ1 and Lym2-Vβ8 T-cell clones secreted cytokines IFN-γ or GM-CSF in response to autologous lymphoma tumor cells. While Lym2-Vβ8 reactivity was tumor-specific, Lym1-Vβ1 also reacted against autologous normal B cells, but not monocytes.
Both CD4+ T-cell clones, Lym1-Vβ1 and Lym2-Vβ8, produced significant amounts of GM-CSF and IFN-γ in response to stimulation with autologous lymphoma cells. The inhibition of cytokine production by anti-HLA class II and HLA-DR blocking antibodies but not by anti-HLA class I, HLA-DP, HLA-DQ or isotype control antibodies showed that both CD4+ T-cell clones were restricted by HLA-DR (Fig. 7b). To analyze specificity, we tested the reactivity of the T-cell clones against autologous normal B cells and monocytes isolated from the PBMC of each patient. The recognition of autologous tumor cells and autologous normal B cells but not autologous monocytes by the Lym1-Vβ1 T-cell clone suggested that it may recognize a B-cell lineage-specific antigen (Fig. 7c). In contrast, the recognition by the Lym2-Vβ8 T-cell clone of autologous tumor cells, but not autologous normal B cells or monocytes, suggested that it may recognize a lymphoma-specific antigen (Fig. 7c).
Phenotype and function of expanded CD8+ T-cell clones
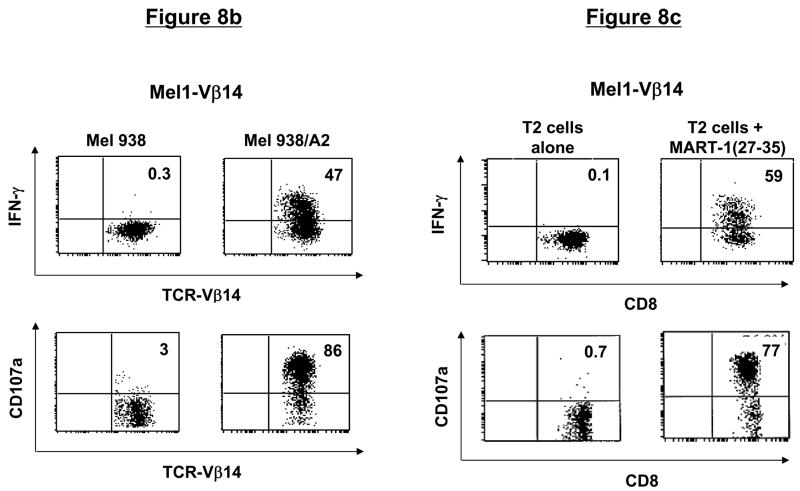
Similar to the CD4+ T-cell clones, CD8+ T-cell clones could be expanded greater than 60-fold using the allofeeder REP (Table 1). Phenotypically, >99% of the post-REP T cells from Mel1-Vβ14 and Mel2-Vβ14 clones were CD8+Vβ14+ and MART-1 tetramer-reactive (Fig. 8a). The Mel1-Vβ14 T-cell clone recognized Mel 938/A2 melanoma cells but not parental Mel 938 tumor cells, as evidenced by intracellular production of IFN-γ and degranulation detected by surface mobilization of CD107a (Fig. 8b). The specificity of this T-cell clone was further confirmed by demonstrating recognition of MART-1(27-35) peptide-pulsed, but not unpulsed, T2 cells (Fig. 8c). Similar results of tumor and peptide reactivity were obtained with the Mel2-Vβ14 T-cell clone (data not shown).
Figure 8. CD8+ T-cell clones maintain phenotype, function, and tumor antigen-specificity following in vitro expansion.
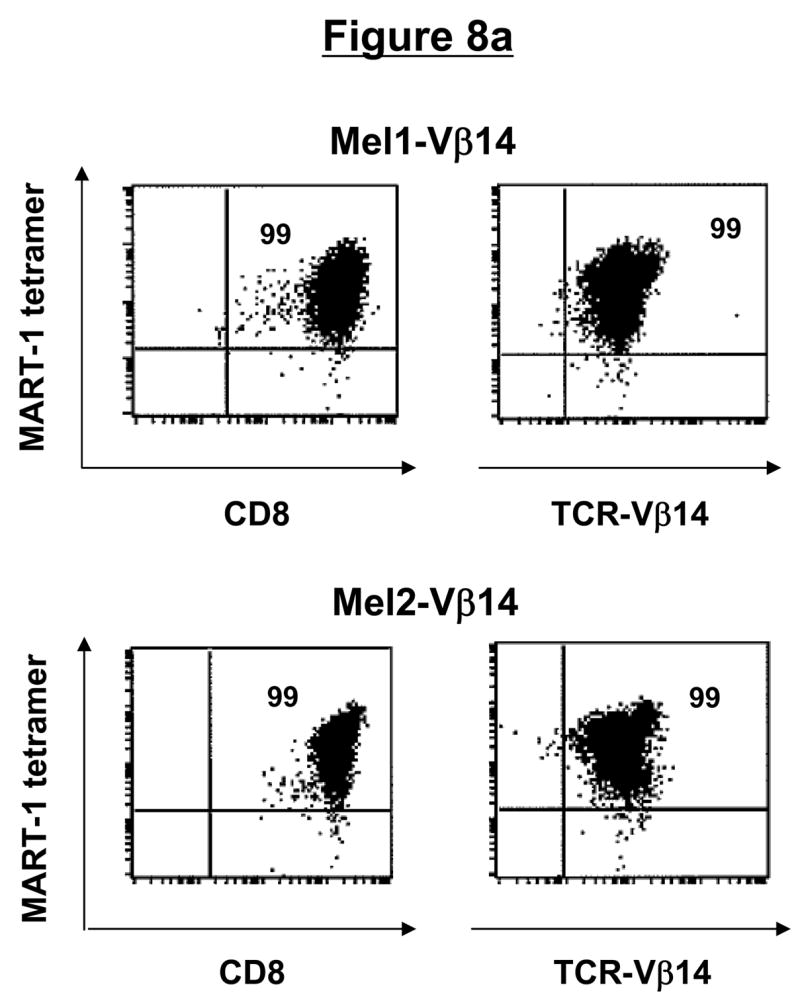
(a) Phenotype of post-REP CD8+ T-cell clones. Following FACsorting and rapid expansion, CD8+ T-cell clones demonstrated a high level of purity, as determined by CD3, CD8, Vβ, and tetramer staining. (b) Function of post-REP CD8+ T-cell clone. Melanoma-specific T-cell clone, Mel1-Vβ14 showed specific cytokine secretion and degranulation in response to HLA-A2-transduced, but not untransduced, melanoma cells, as determined by intracellular IFN-γ and CD107a surface staining. (c) Antigen-specificity of post-REP CD8+ T-cell clones. Expanded, melanoma-specific T-cell clone Mel1-Vβ14 showed specific IFN-γ secretion and CD107a degranulation in response to stimulation with MART-1(27-35) peptide-pulsed, but not unpulsed, T2 cells.
Taken together, these results suggest that the CD4+ and CD8+ T-cell clones isolated using this approach maintain tumor antigen-specificity, phenotype, and function following in vitro expansion.
DISCUSSION
Our results demonstrate that flow cytometry-based sorting of proliferating T cells within individual TCRVβ subfamilies can result in the rapid isolation of antigen-specific T-cell clones from a heterogeneous T-cell population. Compared with the traditional cloning method of limiting dilution, this approach is highly efficient, simple, and reproducible but may be more expensive due to the requirement for a sterile sorting facility and TCRVβ monoclonal antibodies for immunophenotyping and sorting. Using this strategy, tumor-specific T-cell clones that were present at low frequencies (<5%) could be isolated from a heterogeneous T-cell population within 7 to 10 days, as opposed to several weeks required with limiting dilution. However, we acknowledge that similar to limiting dilution, a four to six-week period is required to generate tumor or antigen-specific T-cell lines prior to isolation of T-cell clones. The isolated T-cell clones could be expanded to large numbers (>108) by an additional 14-day in vitro expansion protocol. If more T cells are desired, the procedure could be easily repeated to isolate the same clone from the starting T-cell population.
Mannering et al. recently described a CFSE-based method to clone human autoantigen-specific CD4+ T cells.14 Proliferating, antigen-responsive CD4+ T cells were identified by their reduction in CFSE staining, and single cells were sorted into separate wells to isolate antigen-specific T-cell clones. Similar to limiting dilution, it is difficult to reproducibly isolate the desired T-cell clone with this approach. Furthermore, generation of large numbers of the T-cell clones is time consuming from single cells. In contrast, our approach was demonstrated to be useful for isolation of both CD4+ and CD8+ T-cell clones and the use of TCR Vβ antibodies allows us to reproducibly isolate the desired T-cell clone. Moreover, our approach does not require single cell sorting and therefore offers an efficient process to generate large numbers of cells for each T-cell clone within a short period of time.
Single cell sorting of tetramer-reactive T cells can also result in rapid isolation of antigen-specific T-cell clones.15–19 However, our approach offers several advantages compared with tetramer-based sorting. First, it does not require knowledge of the precise nature of the antigen or the T-cell peptide epitope that is necessary for tetramer sorting. Second, it is broadly applicable and can be used with various forms of antigen such as peptides, proteins, whole tumor cells, and potentially bacteria and viruses. Third, it can be used to isolate T-cell clones from any HLA type as opposed to HLA types limited by tetramer availability. Fourth, this method can be used for isolation of both CD4+ and CD8+ T-cell clones in contrast with tetramer-based sorting, which is used primarily for CD8+ T cells. Fifth, the use of TCRVβ antibodies in this approach allows repeated isolation of the same T-cell clone from a heterogeneous T-cell population. Finally, this approach isolates functional antigen-specific T-cell clones based on their proliferative capacity, as opposed to tetramer-based isolation, which identifies T cells based only on their antigen specificity, and not functional capacity.
Despite the advantages compared with traditional methods of cloning, this approach does have some limitations. The TCRVβ antibody panel used in this study detects only ~70% of the T-cell repertoire and therefore cannot be used for isolation of all T-cell clones. Although not observed in our study, it is possible that if the antibodies are cross-reactive with multiple TCRVβ subfamilies, then a monoclonal T-cell population may not be obtained by this approach. However, these limitations may largely be overcome when additional and more specific antibodies become available in the future.
In addition to tumor-specific T-cell clones, this approach may also be used for the isolation of antigen-specific T-cell clones against HIV and other infectious pathogens. While the use of CFSE identifies antigen-specific T-cell clones with proliferative function,7, 8 this approach may be used to isolate T-cell clones with other desired functions by combining TCR Vβ staining with assays such as cytokine capture and/or degranulation based on CD107a surface expression.12 It may also be combined with surface staining for T-cell maturation markers to isolate antigen-specific T-cell clones of preferred effector or memory phenotype20. Rapid isolation of such antigen-specific T-cell clones would facilitate the development of adoptive T-cell therapy strategies against infectious diseases and cancer and allow investigation of the tumor immunity at the cellular and molecular level. Furthermore, cloning of the alpha and beta chains of the T-cell receptor of isolated antigen-specific T cells would facilitate the development of genetically engineered lymphocytes for adoptive immunotherapy.21, 22
Acknowledgments
We thank A. Woo for editorial assistance and S. El-Bereir for technical assistance.
Research Support: This research was supported by National Institutes of Health grants PO1-CA49639 (to J.J. Molldrem), RO1-CA85843 (to J.J. Molldrem), and 1K23 CA123149-01A1 (to S.S. Neelapu), Cancer Treatment Research Foundation grant P-06-039 (to L.W. Kwak), Multiple Myeloma Research Foundation grant 22-06 (to L.W. Kwak), Leukemia and Lymphoma Society Specialized Center of Research Program 7262-08 (to L.W. Kwak), by The University of Texas M. D. Anderson Cancer Center Cancer Center Support Grant CA16672. S.S. Neelapu was a recipient of the American Society of Clinical Oncology Career Development Award and American Society of Hematology Junior Faculty Scholar Award in Clinical/Translational Research.
Footnotes
Author Contributions: Designed research (STL, SL, LR, PH, YJL, LWK, GL, SSN), performed research (STL, SL, PS, EDW, GL, SSN), analyzed data (STL, SL, LR, JJM, EDW, PH, LWK, GL, SSN), wrote paper (STL, SL, LWK, GL, SSN).
Conflict of interest: None
References
- 1.Pawelec G, Wernet P. Restimulation properties of human alloreactive cloned T-cell lines. Dissection of HLA-D-region alleles in population studies and in family segregation analysis. Immunogenetics. 1980;11:507–519. doi: 10.1007/BF01567819. [DOI] [PubMed] [Google Scholar]
- 2.Fonteneau JF, et al. Generation of high quantities of viral and tumor-specific human CD4+ and CD8+ T-cell clones using peptide pulsed mature dendritic cells. J Immunol Methods. 2001;258:111–126. doi: 10.1016/s0022-1759(01)00477-x. [DOI] [PubMed] [Google Scholar]
- 3.Malissen B, Charmot D, Mawas C. Expansion of human lymphocyte populations expressing specific immune reactivities. III. Specific colonies, either cytotoxic or proliferative, obtained from a population of responder cells primed in vitro. Preliminary immunogenetic analysis. Hum Immunol. 1981;2:1–13. doi: 10.1016/0198-8859(81)90002-1. [DOI] [PubMed] [Google Scholar]
- 4.Spits H, Borst J, Terhorst C, de Vries JE. The role of T cell differentiation markers in antigen-specific and lectin-dependent cellular cytotoxicity mediated by T8+ and T4+ human cytotoxic T cell clones directed at class I and class II MHC antigens. J Immunol. 1982;129:1563–1569. [PubMed] [Google Scholar]
- 5.Spits H, Ijssel H, Terhorst C, de Vries JE. Establishment of human T lymphocyte clones highly cytotoxic for an EBV-transformed B cell line in serum-free medium: isolation of clones that differ in phenotype and specificity. J Immunol. 1982;128:95–99. [PubMed] [Google Scholar]
- 6.Lyons AB, Parish CR. Determination of lymphocyte division by flow cytometry. J Immunol Methods. 1994;171:131–137. doi: 10.1016/0022-1759(94)90236-4. [DOI] [PubMed] [Google Scholar]
- 7.Angulo R, Fulcher DA. Measurement of Candida-specific blastogenesis: comparison of carboxyfluorescein succinimidyl ester labelling of T cells, thymidine incorporation, and CD69 expression. Cytometry. 1998;34:143–151. [PubMed] [Google Scholar]
- 8.Schneider S, et al. Simultaneous cytometric analysis of (auto)antigen-reactive T and B cell proliferation. Immunobiology. 2002;206:484–495. doi: 10.1078/0171-2985-00196. [DOI] [PubMed] [Google Scholar]
- 9.Neelapu SS, et al. Human autologous tumor-specific T-cell responses induced by liposomal delivery of a lymphoma antigen. Clin Cancer Res. 2004;10:8309–8317. doi: 10.1158/1078-0432.CCR-04-1071. [DOI] [PubMed] [Google Scholar]
- 10.Neelapu SS, et al. Vaccine-induced tumor-specific immunity despite severe B-cell depletion in mantle cell lymphoma. Nat Med. 2005;11:986–991. doi: 10.1038/nm1290. [DOI] [PubMed] [Google Scholar]
- 11.Dudley ME, Wunderlich JR, Shelton TE, Even J, Rosenberg SA. Generation of tumor-infiltrating lymphocyte cultures for use in adoptive transfer therapy for melanoma patients. J Immunother. 2003;26:332–342. doi: 10.1097/00002371-200307000-00005. [DOI] [PMC free article] [PubMed] [Google Scholar]
- 12.Rubio V, et al. Ex vivo identification, isolation and analysis of tumor-cytolytic T cells. Nat Med. 2003;9:1377–1382. doi: 10.1038/nm942. [DOI] [PubMed] [Google Scholar]
- 13.Riddell SR, Greenberg PD. The use of anti-CD3 and anti-CD28 monoclonal antibodies to clone and expand human antigen-specific T cells. J Immunol Methods. 1990;128:189–201. doi: 10.1016/0022-1759(90)90210-m. [DOI] [PubMed] [Google Scholar]
- 14.Mannering SI, et al. An efficient method for cloning human autoantigen-specific T cells. J Immunol Methods. 2005;298:83–92. doi: 10.1016/j.jim.2005.01.001. [DOI] [PubMed] [Google Scholar]
- 15.Dunbar PR, et al. Direct isolation, phenotyping and cloning of low-frequency antigen-specific cytotoxic T lymphocytes from peripheral blood. Curr Biol. 1998;8:413–416. doi: 10.1016/s0960-9822(98)70161-7. [DOI] [PubMed] [Google Scholar]
- 16.Dunbar PR, et al. Cutting edge: rapid cloning of tumor-specific CTL suitable for adoptive immunotherapy of melanoma. J Immunol. 1999;162:6959–6962. [PubMed] [Google Scholar]
- 17.Crawford F, Kozono H, White J, Marrack P, Kappler J. Detection of antigen-specific T cells with multivalent soluble class II MHC covalent peptide complexes. Immunity. 1998;8:675–682. doi: 10.1016/s1074-7613(00)80572-5. [DOI] [PubMed] [Google Scholar]
- 18.Yee C, Savage PA, Lee PP, Davis MM, Greenberg PD. Isolation of high avidity melanoma-reactive CTL from heterogeneous populations using peptide-MHC tetramers. J Immunol. 1999;162:2227–2234. [PubMed] [Google Scholar]
- 19.Busch DH, Pamer EG. T cell affinity maturation by selective expansion during infection. J Exp Med. 1999;189:701–710. doi: 10.1084/jem.189.4.701. [DOI] [PMC free article] [PubMed] [Google Scholar]
- 20.Klebanoff CA, Gattinoni L, Restifo NP. CD8+ T-cell memory in tumor immunology and immunotherapy. Immunol Rev. 2006;211:214–224. doi: 10.1111/j.0105-2896.2006.00391.x. [DOI] [PMC free article] [PubMed] [Google Scholar]
- 21.Morgan RA, et al. Cancer regression in patients after transfer of genetically engineered lymphocytes. Science. 2006;314:126–129. doi: 10.1126/science.1129003. [DOI] [PMC free article] [PubMed] [Google Scholar]
- 22.Greenberg PD, et al. Genetic modification of T-cell clones for therapy of human viral and malignant diseases. Cancer J Sci Am. 1998;4(Suppl 1):S100–105. [PubMed] [Google Scholar]


