Abstract
The localization of a single tryptophan to the N-terminal domain and six tyrosines to the C-terminal domain of TBP allows intrinsic fluorescence to separately report on the structures and dynamics of the full-length TATA binding protein (TBP) of Saccharomyces cerevisiae and its C-terminal DNA binding domain (TBPc) as a function of self-association and DNA binding. TBPc is more compact than the C-terminal domain within the full-length protein. Quenching of the intrinsic fluorescence by DNA and external dynamic quenchers shows that the observed tyrosine fluorescence is due to the four residues surrounding the “DNA binding saddle” of the C-terminal domain. TBP’s N-terminal domain unfolds and changes its position relative to the C-terminal domain upon DNA binding. It partially shields the DNA binding saddle in octameric TBP, shifting upon dissociation to monomers to expose the saddle to DNA. Structure–energetic correlations were obtained by comparing the contribution that electrostatic interactions make to DNA binding by TBP and TBPc; DNA binding by TBPc is more hydrophobic than that by TBP, suggesting that the N-terminal domain either interacts with bound DNA directly or screens a part of the C-terminal domain, diminishing its electronegativity. The competition between divalent cations, K+, and DNA is not straightforward. Divalent cations strengthen binding of TBP to DNA and do so more strongly for TBPc. We suggest that divalent cations affect the structure of the bound DNA perhaps by stabilizing its distorted conformation in complexes with TBPc and TBP and that the N-terminal domain mimics the effects of divalent cations. These data support an autoinhibitory mechanism in which competition between the N-terminal domain and DNA for the saddle diminishes the DNA binding affinity of the full-length protein.
The initiation of gene transcription in eukaryotes requires assembly of a multiprotein pre-initiation complex (PIC)1 that recruits RNA polymerase to a promoter. The binding of the TATA binding protein (TBP) to a TATA box sequence is a key step in PIC assembly at many promoters (1). Crystallographic and solution studies have established the formation of a 1:1 complex of TBP and TATA box (e.g., refs 2–5). TBP consists of a 180-residue C-terminal domain (TBPc) that is ~80% identical in sequence among all eukaryotes and a N-terminal domain that varies in both length and sequence (2). The shortest N-terminal domain consists of four residues in Pyrococcus woesei TBP (6) with the 158 residues of human TBP being the longest (7). The crystal structures of yeast, human, Arabidopsis, and archael TBP molecules that have been determined either lack or have rudimentary N-terminal domains (6, 8–10).
In contrast to the large DNA conformation changes observed upon TBP or TBPc binding (11), little change is seen in the crystal structures of the C-terminal domain (6, 8, 9, 12). Only a small reorientation of the two subdomains relative to the 2-fold axis is observed in a manner independent of the sequence variations of the bound DNA (2, 13). Studies of the intrinsic fluorescence of TBP showed that the C-terminal domain has the same compact and rigid structure in free monomers and octamers and monomers complexed with DNA (4). Left unresolved was reconciliation of the high average tyrosine anisotropy with the demonstration by molecular dynamics of substantial mobility of two of the six tyrosine residues within the C-terminal domain (4).
Although cells are viable when TBPc replaces TBP, the N-terminal domains of yeast and human TBP function in autoinhibition of DNA binding, binding of other transcription factors (14–18), and mediating self-assembly of the protein. Human and yeast TBPc dimerize in solution with equilibrium association constants and dissociation rates that vary greatly with the experimental conditions (19, 20). In contrast, TBP self-associates to tetramers and octamers (21, 22). Self-association and DNA binding are linked processes; only monomeric TBP–TATA box complexes are observed. While octamers rapidly equilibrate during DNA binding (23), equilibration of dimers can be slow (19, 20). The role of the N-terminal domain in mediating TBP self-association is highlighted by the ability of the isolated domain to itself self-associate (24).
Limited information about the structure of the N-terminal domain of TBP and its relationship to the C-terminal core is available. Fluorescence spectroscopy was used to show that the structure of the N-terminal domain is different in the TBP–DNA complex, TBP monomers, and TBP octamers (4, 22, 25). This conclusion is consistent with hydroxyl radical protein footprinting of TBP and its complex with DNA, indicating that the N-terminal domain binds to the saddle of the core domain and is displaced upon DNA binding (5). The work presented here continues our exploration of the interdomain interactions by extending the fluorescence analysis of TBP structure and by directly comparing solution structural properties of TBP and TBPc. This study shows that the N-terminal domain undergoes structural changes and is an active participant in binding of the TATA box by the conserved C-terminal core domain. Properties of the C-terminal domain affected by the attached N-terminal domain include its DNA binding affinity and structural dynamics. An unexpected result is that binding of both TBPc and TBP is stabilized by divalent cations, albeit by different degrees. In general, the binding of TBPc to the TATA box sequence is more hydrophobic than that of TBP. We explore the hypothesis that the N-terminal domain of TBP functions as a TAF by undergoing structural and functional transformations necessary for formation of the promoter pre-initiation complex.
EXPERIMENTAL PROCEDURES
Protein, DNA, and Other Reagents
Full-length Saccharomyces cerevisiae TBP and the C-terminal core domain (TBPc) were expressed in Escherichia coli and purified as described elsewhere2. Extinction coefficients (εM,nat) of 15 180 and 9540 M−1 cm−1 determined for TBP and TBPc, respectively, were used to determine the protein concentrations from the absorbance at 278 nm as described in ref 26. N-Acetyl-L-tyrosine (N-Tyr) and N-acetyl-L-tryptophan (N-Trp) ethyl esters (Sigma) were used as the spectral references for these measurements.
Labeled and unlabeled DNA oligonucleotides were purchased from TriLink Biotechnologies, Inc., and their concentration was optically determined using extinction coefficients calculated from sequence with correction for fluorescein or TAMRA absorption at 260 nm. The oligonucleotide bearing the adenovirus major late promoter (AdMLP), tetramethylrhodamine-5′-(GGGCTATAAAAGGG)duplex-3′-fluorescein, was used to monitor TBP and TBPc binding via fluorescence resonance energy transfer (FRET) (11, 27). An unlabeled oligonucleotide with the same sequence was used in the intrinsic fluorescence studies of the TBP– and TBPc–DNA complexes.
Duplexes of comparable length have been used in crystallographic studies of TBPc complexed with DNA (13) and solution studies analyzed by FRET (11); consistent results were obtained for protein–DNA complexes in these two venues. The duplex used in our studies has a stability of −17.2 kcal/mol under the experimental ionic conditions at 37 °C (28, 29), resulting in <0.1% single-strand oligonucleotides at the 10 nM concentration used in the binding assay. The high GC content of the duplex ends minimizes fraying. The stability of this oligonucleotide probe in binding studies is further confirmed by the equilibrium and kinetic studies conducted using these oligonucleotide duplexes and restriction fragments hundreds of nucleotides in length (11, 30, 31).
Fluorescence and Absorption Spectroscopy
All experiments were performed in buffer containing 25 mM Tris-HCl, 100 mM KCI, 5 mM MgCI2, 1 mM CaCI2, and 2 mM DTT at pH 7.5 and 22 °C except for the salt-induced dissociation experiments, where the concentration of KCl and MgCl2 is specified. Absorption measurements were taken with a Beckman Coulter (Fullerton, CA) DU 7400 spectrophotometer. Fluorescence measurements were taken with a Jobin Yvon (Edison, NJ) Fluoromax-3 spectrofluorometer. The intensity of the Raman scattering band of water was used as the internal standard of fluorometer sensitivity.
Acrylamide (neutral) and iodide (negatively charged) as a potassium salt were used as dynamic fluorescence quenchers. The quencher was added to the solutions containing the protein or protein–DNA complex and the fluorescence measured 3–4 min later. Control experiments were conducted to verify that the protein–DNA complexes did not dissociate upon addition of the quenchers (data not shown). Acrylamide quenching was analyzed with the Stern–Volmer equation
| (1) |
where F0 and F are the protein’s fluorescence intensities in the absence and presence of the quencher (Q), respectively, and KSV is the dynamic collision quenching constant since all the protein’s chromophores are accessible to the quencher (32). The modified Stern–Volmer equation was used to analyze iodide quenching
| (2) |
where dF = F0 − F, F0, F, [Q], and KSV are as in eq 1, and a1 is a portion of the chromophore that is accessible to quencher since only the surface portion of the chromophores is accessible (33).
Fluorescence anisotropy was analyzed by the Perrin equation
| (3) |
where A is the anisotropy, A0 is the limiting anisotropy in the absence of molecular motion, τ is the lifetime, and θ is the rotational correlation time (34). The limiting anisotropy A0 is obtained by plotting 1/A versus F/F0 since the relative change in the lifetime is as follows τ ≡ τrel = τ/τ0 = F/F0.
Fluorescence Resonance Energy Transfer (FRET)
FRET of the doubly labeled oligonucleotide described above was used to follow TBP and TBPc binding and dissociation (11, 35). The efficiency of the energy transfer (E) depends on the distance between a donor and an acceptor according to
| (4a) |
where R is the donor–acceptor distance and Ro is the Förster radius [the distance between the donor and acceptor at which E = 0.5 (32)]. E is measured by
| (4b) |
where FD and FDA are the fluorescence of the donor in the absence and presence of the acceptor, respectively. Combining eqs 4a and 4b yields
| (4c) |
from which the donor–acceptor distance is calculated. The 14 bp length of the oligonucleotide (47.6 Å) and the chosen donor–acceptor pair for which Ro = 59.6 Å under the experimental conditions (36) permit the measurement of the change in FRET efficiency since TBP induces a significant bend in the DNA upon binding (11). Fluorescence emission at 520 (donor) and 580 nm (acceptor) following excitation at 490 nm was measured via FRET experiments. Equation 4a was also used to analyze the quenching of tyrosine fluorescence by DNA.
Equilibrium Binding and Salt-Induced Dissociation Titrations
TBP and TBPc binding isotherms were obtained as described previously (27). Equilibrium titrations were analyzed by
| (5) |
where Pobs, Pmin, and Pmax are the observed, minimum, and maximum values, respectively, of the measured fluorescence intensity or anisotropy. The specific DNA binding activity of each protein preparation used in these studies was determined by stoichiometric titrations as described elsewhere (5).2 For equilibrium binding titrations, Ȳ is determined for the reaction as
| (6) |
where Kd is the equilibrium dissociation constant, Ptot and Otot are the total protein and DNA concentrations, respectively, and nH is the Hill coefficient (27). Equation 6 reduces to the single-site (Langmuir) binding model when nH = 1.
The electrostatic contribution to formation of TBP– and TBPc–DNA complexes was ascertained from the net number of ions (m+ for cations and x− for anions) and waters released
| (7) |
where Kd is the equilibrium dissociation constant, (Kd)o is the value of Kd extrapolated to 1 M salt, and m+ is the cation concentration (37). Usually, m+ ≫ x− due to the polyanionic nature of DNA and polyampholyte nature of proteins. Since the influence of water is negligible at high salt concentrations, SK typically reflects the net cation release or uptake upon formation of protein–DNA complexes.
SK can be conveniently obtained from salt displacement isotherms in which a protein–DNA complex is dissociated by titration with increasing concentrations of salt (38). In these experiments
| (8) |
where
| (9) |
where (Kd)o can be transformed into mp, the salt concentration at which half of the initial protein–DNA complex is dissociated. Equimolar concentrations of TBP or TBPc and unlabeled duplex (250 nM) along with the doubly labeled oligonucleotide at 10 nM were mixed and incubated for 1 h. KCl was then added at the specified concentration and the solution incubated for 1 h prior to measurement of the solution fluorescence. Dissociation of TBP and TBPc from DNA was followed by measurement of the extent of FRET as described above. Nonlinear least-squares fitting of salt titration isotherms to eqs 8 and 9 yields values of mp and SK at any concentration of the macromolecules (38). Inclusion of divalent cations in an analysis of the monovalent cation dependence of a binding assumes that the two are competitive (38). Since divalent cations stabilize the TBP–DNA complex (Figure 7 and Table 2), they cannot be considered as competitors for the DNA phosphates. Therefore, eqs 6–9 provide a relative assessment of TBP–DNA complex stability under the different experimental conditions that were analyzed.
Figure 7.
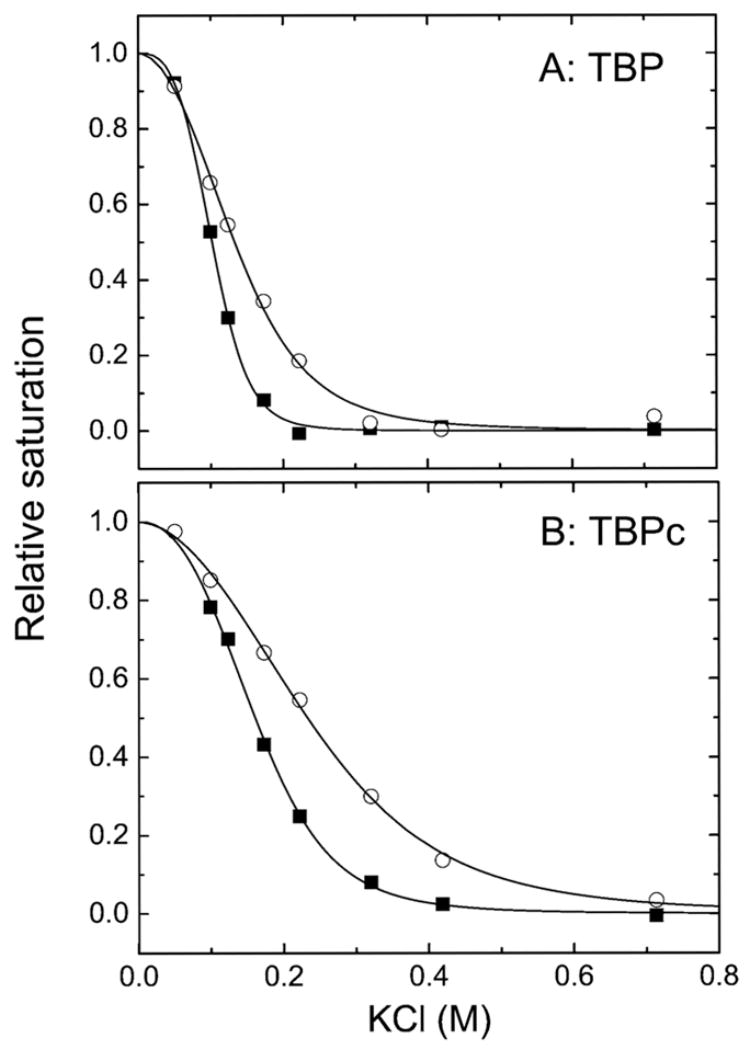
Salt-induced dissociation isotherms for TBP (A) and TBPc (B) bound to 14 bp oligonucleotides at equimolar protein and DNA concentrations (0.25 μM) in buffer containing 25 mM Tris at pH 7.6 and, initially, 50 mM KCl. The added KCl is indicated by the x-axis. The squares depict isotherms determined in the absence of Ca2+ or Mg2+. The circles depict isotherms determined in the presence of 1 mM CaCl2 and 5 mM MgCl2. Dissociation of TBP and TBPc from DNA was followed by measurement of the level of FRET as described in Experimental Procedures.
Table 2.
Thermodynamics of Association of TBP and TBPc with Duplex DNA Bearing the TATA Box Sequence TATAAAGa
| SKb | mpc (mM KCl) | ΔGd (kcal/mol) | ΔGnee (kcal/mol) | ||
|---|---|---|---|---|---|
| 50 mM KCl | TBP | 5.9 ± 0.49 | 101 ± 2 | 10.3 ± 0.12 | 1.3 ± 0.61 |
| TBPc | 4.6 ± 0.53 | 162 ± 8 | 10.1 ± 0.08 | 4.4 ± 0.32 | |
| 50 mM KCl amd 6 mM Mg2+ | TBP | 4.0 ± 0.48 | 143 ± 7 | 10.85 ± 0.06 | 4.7 ± 0.33 |
| TBPc | 4.84 ± 0.46 | 247 ± 8 | 11.28 ± 0.05 | 5.3 ± 0.27 | |
| 50 mM KCl and 6 mM Ca2+ | TBP | 3.9 ± 0.48 | 149 ± 7 | 10.97 ± 0.02 | 4.9 ± 0.36 |
| TBPc | 4.0 ± 0.43 | 245 ± 10 | 11.2 ± 0.14 | 5.95 ± 0.27 | |
| 50 mM KCl, 1 mM Ca2+, and 5 mM Mg2+ | TBP | 3.8 ± 0.5 | 132 ± 7 | 10.94 ± 0.04 | 4.7 ± 0.33 |
| TBPc | 3.47 ± 0.45 | 228 ± 11 | 11.4 ± 0.16 | 4.7 ± 0.33 |
See Experimental Procedures and ref 38 for details for the definitions of the parameters given in the table. The errors reported for all parameters except ΔGne were propagated using the 95% confidence interval. The reported errors for ΔGne were calculated using the 65% confidence interval.
The thermodynamic average of the number of ions released upon DNA binding by TBP. The SK value was obtained from salt displacement experiments as the fitting parameter in eq 9.
The midpoint of a salt displacement dissociation curve such as that shown in Figure 7.
Gibbs free energy of binding of TBP to DNA. The value of ΔG for TBP and TBPc was obtained from equilibrium experiments under the salt conditions given in column 1.
Nonelectrostatic component of the Gibbs free energy of binding of TBP to DNA obtained from salt displacement experiments using the fitting parameter (Kd)o in eq 7.
RESULTS
TBP and TBPc DNA Binding Isotherms
The specific DNA binding activity of the TBP and TBPc preparation used in these studies was >80%. The reported protein concentrations have been corrected for activity. TBPc and TBP bind to the same TATA box sequence embedded with the 14 bp duplex with different affinities; Kd = 12.1 ± 0.3 and 29.4 ± 0.8 nM, respectively (Figure 1). The higher affinity of TBPc observed with the FRET assay is consistent with the results obtained via DNase I footprinting for binding to a longer length of DNA except for the reduced magnitude of the observed difference.2 All of the isotherms reported in this study are best fit with an nH of 1.0 ± 0.1, consistent with binding of a single TBP or TBPc molecule to the single TATA box. The difference in the shape of the TBPc curves in Figure 1 is due the DNA concentration of 10 nM being comparable to the measured Kd of TBPc.
Figure 1.
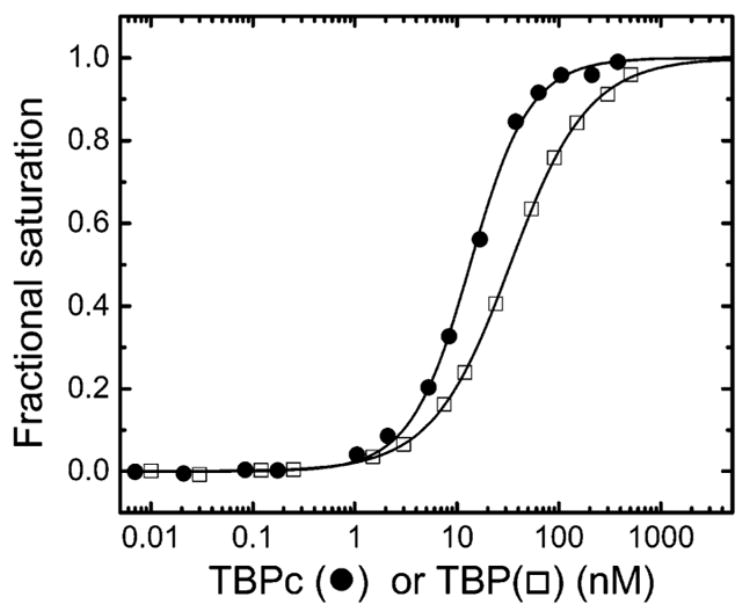
Isotherms for the binding of TBPc (●) and TBP (□) to the 14 bp duplex bearing the TATAAAAG TATA box (AdMLP) obtained by FRET as described in Experimental Procedures. The solid lines represent the best fit to eq 6 with Kd values of 12.1 ± 0.8 and 29.4 ± 0.3 nM, respectively.
Fluorescence Quenching
The structural differences underlying the DNA binding affinities of TBP and TBPc have been probed by fluorescence spectroscopy, taking advantage of tyrosine and tryptophan as unique reporters of the C- and N-terminal domains, respectively (4). Fluorescence quenching is an effective probe of small, local changes in the molecular environment of aromatic amino acids due to protein conformational changes. Negatively charged iodide will quench the fluorescence of only the residues that are located in hydrophilic environments of proteins, particularly on the surface. Neutral acrylamide readily penetrates into the hydrophobic interior and thus quenches fluorescence less discriminately (33, 39).
Both the quantum yield and fluorescence spectrum of TBP change upon DNA binding. The tyrosine component of the spectra (the ~310 nm shoulder) decreases, while the tryptophan component (the ~350 nm shoulder) increases (Figure 2, solid lines). Quenching of the tyrosine fluorescence is due to the migration of energy from the DNA. The increased tryptophan fluorescence quantum yield is due to changes in the structure of the N-terminal domain (4). The spectrum of the free protein returns after dissociation of the TBP–DNA complex at high salt concentrations even though DNA is present (data not shown). Iodide differently quenches the fluorescence of TBP and the TBP–DNA complex; tryptophan is accessible to iodide quenching, while tyrosine is not in the TBP–DNA complex (Figure 2, dotted lines). That the tyrosine fluorescence of the TBP–DNA complex is unchanged in the presence of iodide confirms that the quencher does not induce complex dissociation.
Figure 2.
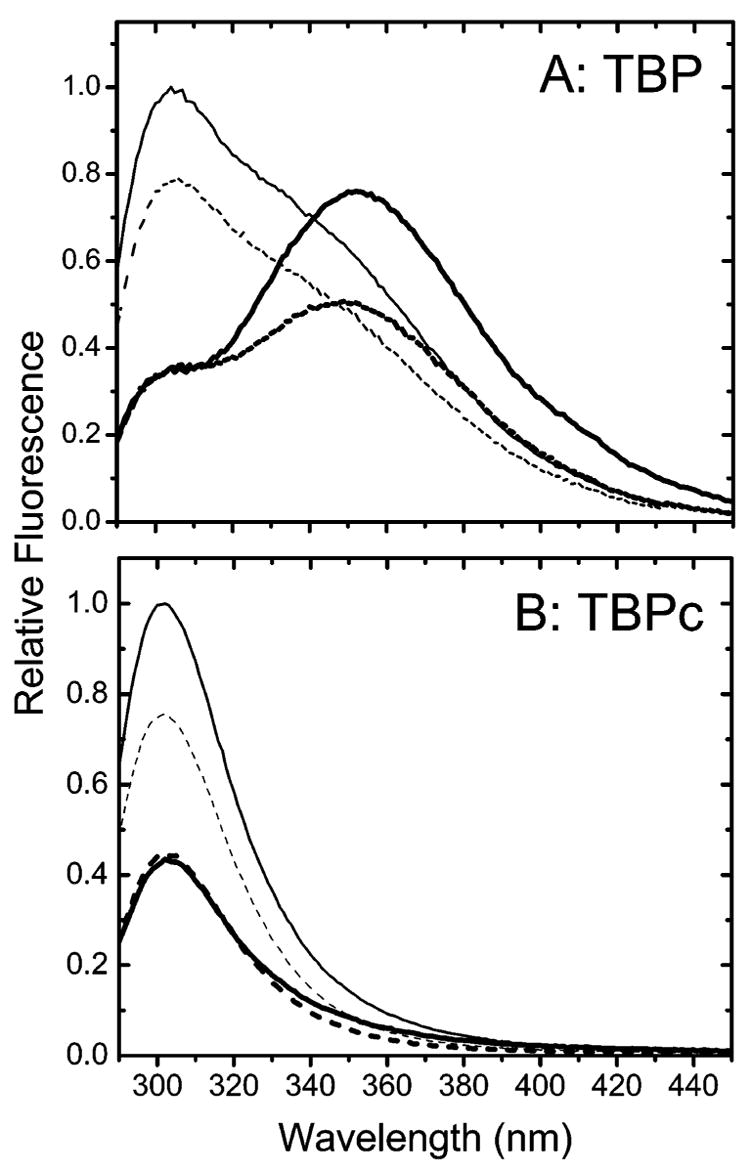
Normalized fluorescence emission spectra of TBP (A) and TBPc (B) obtained following excitation at 275 nm in the absence (—) or presence of 100 mM KI (- - -). The thick lines depict data for the TBP–DNA and TBPc–DNA complexes.
Quantitation of tyrosine fluorescence quenching by acrylamide is visualized in Stern–Volmer plots (Figure 3). Acrylamide quenching is linear for both TBPc and TBP, indicating that all the emitting tyrosines in the C domain of TBP are fully accessible to solvent. Comparable low values of the Stern–Volmer constant relative to the fully accessible control N-Tyr are measured for both the free and DNA-bound protein. Identical results are obtained at protein concentrations of 1 and 6 μM, where free TBP is predominantly monomeric and octameric, respectively (21, 22), and TBPc is dimeric.2 These data show that the accessibility of the emitting tyrosines of the C-terminal domain to acrylamide is the same whether the N-terminal domain is present or absent or whether the proteins are monomeric or oligomeric.
Figure 3.
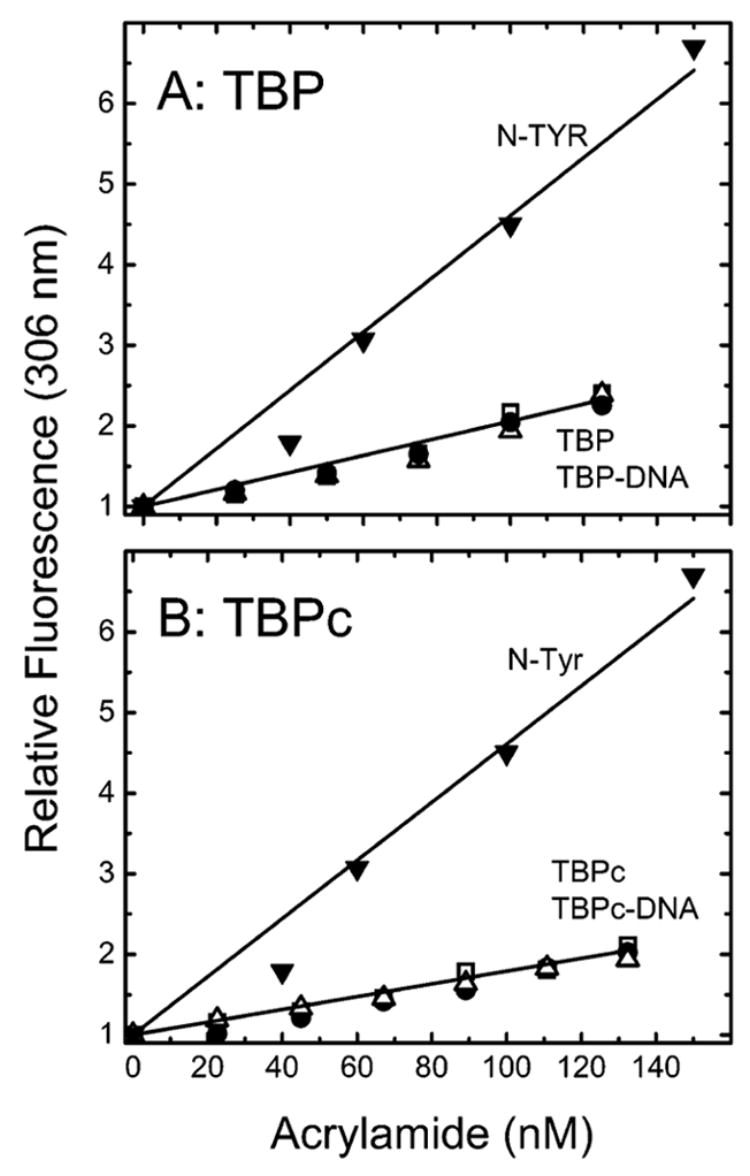
Stern–Volmer plots for the quenching by acrylamide of TBP (A) and TBPc (B) tyrosine fluorescence monitored at 306 nm following excitation at 275 nm. The analyzed solutions are the free proteins at 6 (□) or 1 μM (△) or the protein at 6 μM complexed with DNA (●) or N-acetyl-L-tyrosine ethyl ester (▼).
In contrast to the results obtained with the neutral quencher acrylamide, the emitting tyrosines of both TBP and TBPc are inaccessible to negatively charged iodide when complexed to DNA (data not shown). Stern–Volmer plots (eq 1) of the free protein’s tyrosine fluorescence quenching by iodide curve downward with increasing concentrations of iodide, indicative of the residues residing in a solvent inaccessible hydrophobic environment (data not shown). Therefore, the modified Stern–Volmer formalism (eq 2) was used to quantitate the tyrosine’s fractional accessibility to iodide (Figure 4 and Table 1). The different quenching behaviors of acrylamide and iodide can be ascribed to the greater penetration of a neutral molecule into hydrophobic regions of the proteins.
Figure 4.
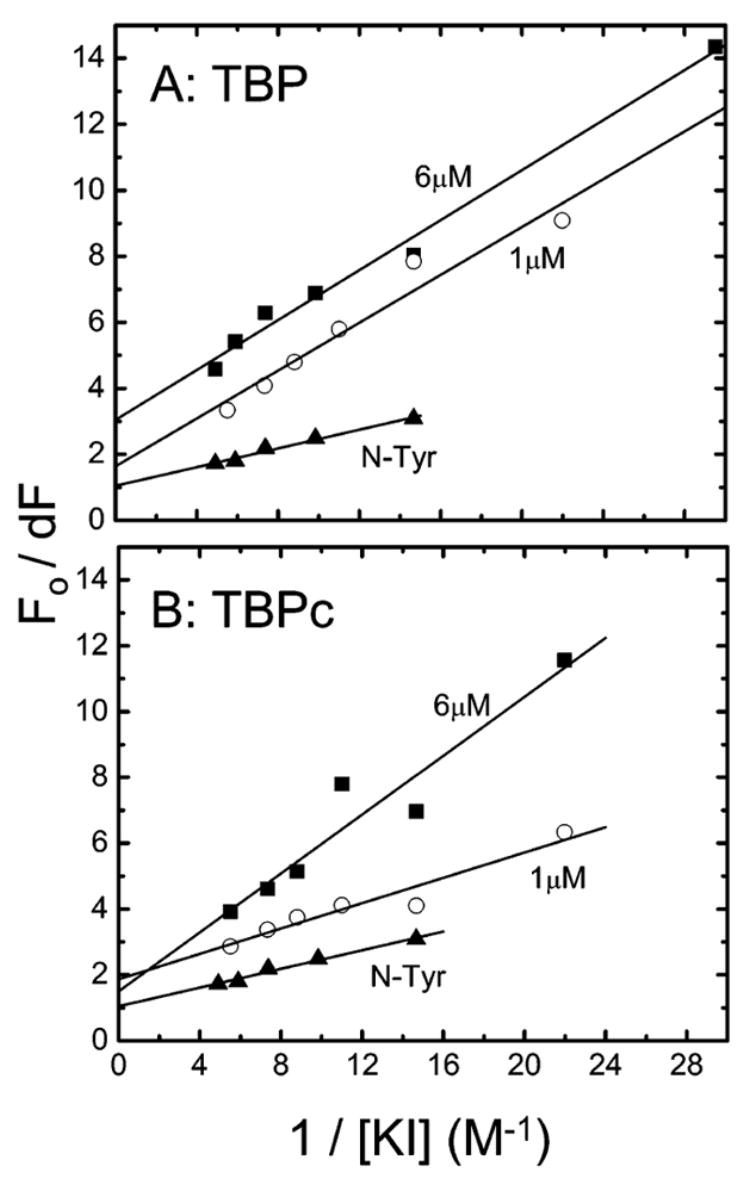
Modified Stern–Volmer plots for the quenching by iodide of TBP (A) and TBPc (B) tyrosine fluorescence monitored at 306 nm following excitation at 275 nm. The analyzed solutions are the free proteins at 6 (■) or 1 μM (○) and N-Tyr (▲). The quantities dF = F0 − F, F0, and F are the protein’s fluorescence intensities in the absence or presence of the quencher KI; see eq 2 (Experimental Procedures).
Table 1.
Global Analysis of Intrinsic Fluorescence Quenching Reveals Structural Differences between TBP and TBPc upon DNA Binding
| Q-rc | 1 μM TBP | 6 μM TBP | TBP with DNA | 1 μM TBPc | 6 μM TBPc | TBPc with DNA | N-Tyrd | N-Trpe | |
|---|---|---|---|---|---|---|---|---|---|
| Tyrosine | |||||||||
| KSVa (M−1) | acryl | 10.6 ± 1.0 | 9.7 ± 1.0 | 9.8 ± 1.0 | 7.2 ± 0.3 | 7.9 ± 0.4 | 7.0 ± 0.4 | 36.1 ± 0.4 | – |
| fractional accessibility | acryl | 100% | 100% | 100% | 100% | 100% | 100% | 100% | – |
| KI | ~60% | ~30% | NAf | ~50% | ~50% | NAf | 100% | – | |
| Aob | acryl | – | 0.191 ± 0.004 | 0.191 ± 0.004 | – | 0.234 ± 0.008 | 0.254 ± 0.008 | – | – |
| KI | – | 0.191 ± 0.009 | NAf | – | 0.258 ± 0.015 | NAf | – | – | |
| Tryptophan | |||||||||
| KSVa (M−1) | acryl | 7.4 ± 0.6 | 7.2 ± 0.6 | 13.9 ± 0.6 | – | – | – | – | 19.9 ± 0.5 |
| KI | 3.6 ± 0.3 | 3.3 ± 0.3 | 7.9 ± 0.3 | – | – | – | – | 8.5 ± 0.6 | |
| fractional accessibility | acryl | 100% | 100% | 100% | – | – | – | – | 100% |
| KI | 100% | 100% | 100% | – | – | – | – | 100% | |
| Aob | acryl | – | 0.237 ± 0.036 | 0.135 ± 0.012 | – | – | – | – | – |
| KI | – | 0.221 ± 0.058 | 0.147 ± 0.014 | – | – | – | – | – | |
N-Tyr provides a reference for full exposure in Figure 4, extrapolating to 1.0 on the y-axis. The tyrosines of TBP and TBPc have almost equal (50–60%) accessibility to iodide at 1 μM protein, evidenced by their extrapolation to 1.9–2.0 on the y-axis of the modified Stern–Volmer plots (Figure 4). The accessibility to iodide decreases to 30% for TBP when the protein concentration is increased to 6 μM; this result contrasts with an absence of an effect for TBPc (Figure 4). Thus, the self-association of TBP from monomers to octamers changes the environment of the tyrosine residues of the C-terminal domain, making them less accessible to the solvent (21, 22). In contrast, TBPc is dimeric at both protein concentrations under the conditions of our study.2 A caveat to these data is the unequal contribution of each of the six tyrosines to the total fluorescence; the fractional accessibility refers to only the residues that contribute to the total fluorescence quantum yield (see below and Discussion).
The N-Terminal Domain Alters the Core Domain’s Structure
The anisotropy of TBP’s tyrosine fluorescence is high and minimally dependent on DNA binding or self-association, and the tyrosine side chains are firmly anchored in the C-terminal domain (4). The studies of TBP are herein extended to TBPc. The effect of quenching on the fluorescence anisotropy was also analyzed to distinguish the mobility of the buried and surface tyrosine side chains (eq 3 and ref 34) since more than half of the emitting residues accessible to acrylamide are also accessible to iodide (Figure 4 and Table 1).
The limiting values of the tyrosine anisotropy (A0) are listed in Table 1. A0 is higher for TBPc than for TBP for both quenchers (Figure 5). DNA binding has no effect on A0 for either TBP or TBPc (Figure 5A and Table 1). While the large decrease in the quantum yield upon DNA binding makes comparison of the correlation times difficult, the invariance of A0 upon DNA binding argues for the tyrosine residues within the C-terminal domain being firmly anchored. For free TBP and TBPc, A0 is close to that obtained for acrylamide when iodide is the quencher (Figure 5B and Table 1). A similar measurement was not made for the DNA-bound complexes since the emitting tyrosines are not accessible to iodide in the complexes (Figure 2). The identical values of A0 measured for the total and surface tyrosine residues (panels A and B of Figure 5, respectively) show that all the emitting residues are well-anchored in the C-terminal domain. The higher values of A0 for TBPc relative to those of TBP show that the C-terminal domain is more compact when the N-terminal domain is not present. The surprising conclusion is that the N-terminal domain is not simply an appendage to the DNA-binding core domain but modulates its structure and thereby presumably its function.
Figure 5.
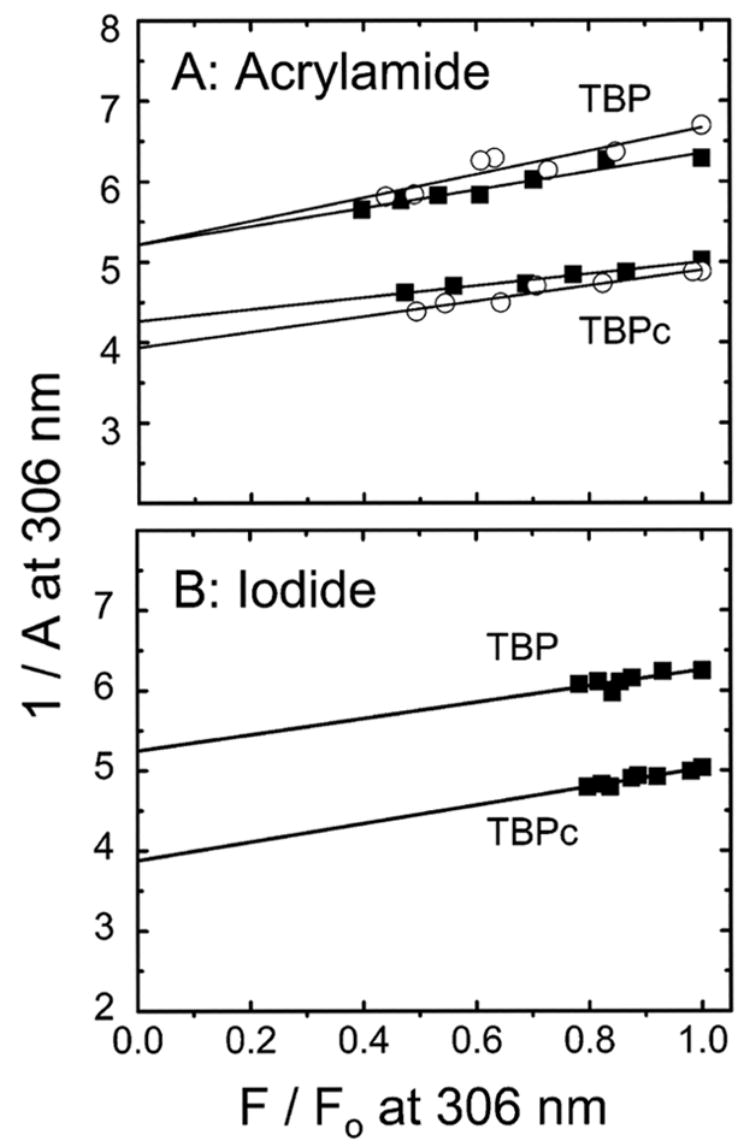
Perrin plots for the quenching-resolved emission anisotropy of tyrosine fluorescence of TBP and TBPc (excitation at 275 nm and emission at 306 nm) by acrylamide (A) and iodide (B): free protein at 6 μM (■) and TBP–DNA complex at 6 μM (○). The data for the TBP–DNA complex are not shown in panel B since its tyrosine fluorescence is inaccessible to iodide. The parameter A is the fluorescence anisotropy (eq 3, Experimental Procedures); F0 and F are defined in the legend of Figure 4.
That the single tryptophan of yeast TBP resides within the N-terminal domain provides a sensitive local reporter of its structure. We extended a previous study of this tryptophan fluorescence (4, 22, 25) to acrylamide and iodide quenching to further explore this domain’s structure. Both probes quench the tryptophan fluorescence. Quenching is weaker for free TBP than for the protein–DNA complex. KSV doubles compared with that of the free protein. Iodide quenching of the complex approaches that of fully exposed N-Trp; acrylamide quenching progresses approximately half as far (Figure 6A,B and Table 1).
Figure 6.
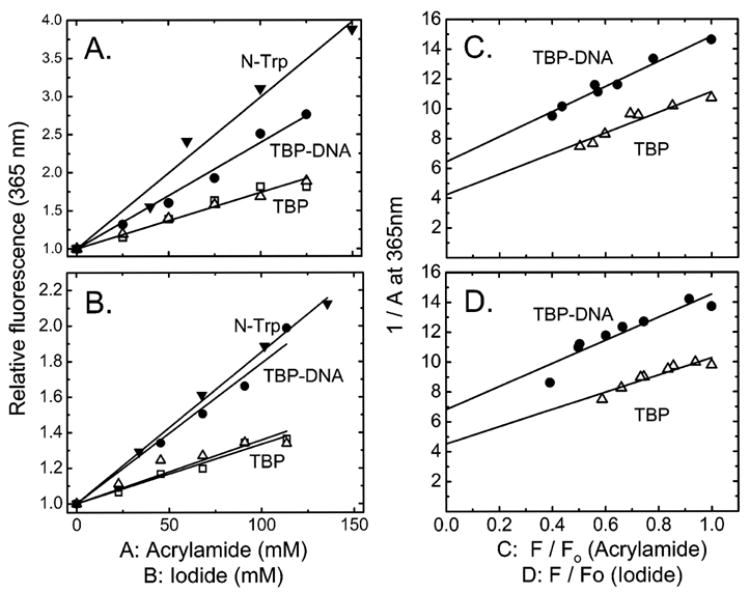
Stern–Volmer plots (A and B) and Perrin plots (C and D) for the quenching of tryptophan fluorescence (excitation at 275 nm and emission at 365 nm) of TBP by acrylamide (A and C) and iodide (B and D). The straight lines represent the best fit to eqs 1 and 3. Conditions: TBP at 1 (□) and 6 μM (△) and TBP at 6 μM complexed with a 1.2-fold molar excess of DNA bearing the sequence TATAAAAG (●) or N-acetyl-L-tryptophan ethyl ester (▼). The parameters A, F0, and F are the same as in Figures 4 and 5.
A change in the solvent exposure of a protein residue is often accompanied by a change in its mobility. Insight into the mobility of the N-terminal domain’s tryptophan was obtained from Perrin plots comparable to those shown for tyrosine in Figure 5; equivalent results were obtained for neutral and negatively charged quenchers (panels C and D of Figure 6, respectively). The A0 value of ~0.23 measured for the free protein decreases to ~0.14 for the TBP–DNA complex. Since A0 depends on the global motion of the protein molecule as well as the internal rotation of the chromophore, the decreased value of A0 must be due to an increased level of segmental motions of the tryptophan residue. These results show that the N-terminal domain’s tryptophan is partly buried in free TBP and becomes solvent-exposed following DNA binding. This conclusion is consistent with the observed red shift of the fluorescence spectrum (Figure 2 and refs 4, 22, and 25).
By separately monitoring the structures of the C-terminal and N-terminal domains of TBP, we have shown that the presence of the structure of the core domain is different in the presence and absence of the N-terminal polypeptide and that the N-terminal domain partly unfolds upon DNA binding. Below we explore the thermodynamic consequences of the structural differences between TBP and TBPc that reveal unexpected differences in the electrostatic contributions to DNA binding by the two proteins.
Electrostatics Contribute Differently to TBP– and TBPc–DNA Binding
The electrostatic contribution to TBP and TBPc binding was quantitated from salt displacement isotherms (Figure 7, Table 2, and eqs 7–9). In the absence of divalent cations, the midpoints (mp) of the dissociation isotherms are 101 ± 2 and 162 ± 8 mM, respectively, for the TBP– and TBPc–DNA complexes, reflecting the higher stability of the TBPc–DNA complex. The relative stability increases when Mg2+ and Ca2+ are present (mp = 132 ± 7 and 228 ± 11 mM, respectively), experimental conditions typical for TBP studies conducted by our laboratory. An identical trend is observed when either Mg2+ or Ca2+ is present (Table 2). Facilitation of DNA binding by monovalent or divalent cations is atypical (38, 40). Thus, divalent cations are not simple competitors with respect to the formation of TBP– and TBPc–DNA complexes.
The nonelectrostatic component of the Gibbs free energy (ΔG°) of the TBP– and TBPc–DNA binding reactions is obtained from the salt displacement isotherms as (Kd)o (Table 2 and eq 7). From these data, the relative contribution of the electrostatic and nonelectrostatic components to binding can be calculated (Table 2 and Figure 8); the electrostatic contribution to DNA binding is significantly greater for TBP than for TBPc independent of the presence or absence of divalent cations. Restated from the opposite point of view, the TBPc–DNA interaction is more hydrophobic, consistent with its higher affinity (Figure 2) and resistance to dissociation by salt (Figure 7).
Figure 8.
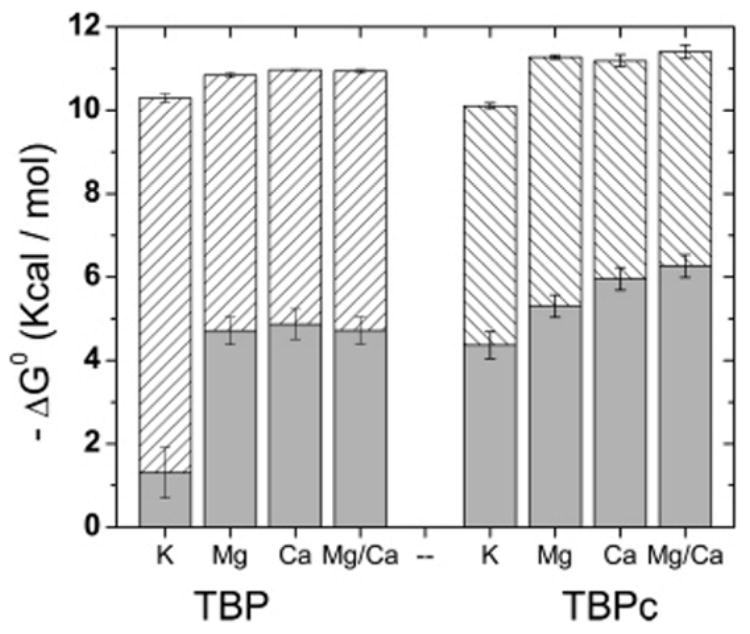
Negative electrostatic (hatched bars) and nonelectrostatic (gray bars) components of the Gibbs free energy of DNA binding by TBP and TBPc in pH 7.6 solutions containing 25 mM Tris-HCl, 50 mM KCl, and the added salt as indicated: K, no added salt; Mg, 6 mM MgCl2; Ca, 6 mM CaCl2; and Mg/Ca, 5 mM MgCl2 and 1 mM CaCl2.
Since the quenching experiments show that TBPc is more compact than the C-terminal domain of TBP, both free and complexed to DNA, we asked whether the protein-induced DNA bend differs between the two complexes. The end-to-end DNA distance within the TBPc–DNA complex was shorter for all the solution conditions that were analyzed (Figure 9). While the difference is not great, the conclusion is robust due to the comparative nature of the measurements. Thus, the presence of the N-terminal domain of TBP affects the structure of TBPc (Figure 5 and Table 1) and results in a less compact complex with the TATA box bearing DNA (Figure 9).
Figure 9.
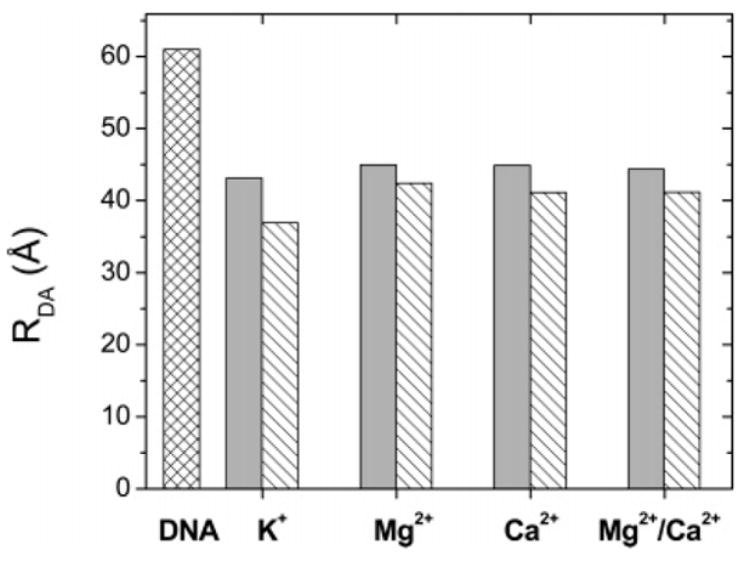
End-to-end distance of the 14 bp duplex free (cross-hatched bars) and in the complex with TBP (solid gray bars) or TBPc (hatched bars) as a function of the indicated chloride salt of the indicated ion or ions present in the buffer. RDA (angstroms) is the end-to-end DNA distance calculated as described in Experimental Procedures. DNA represents the free DNA in all the solutions. The other columns represent the protein–DNA complexes under the same experimental conditions as described in the legend of Figure 8.
DISCUSSION
TBP is the nexus of transcription pre-initiation complexes that result from the coordinated assembly of an array of general and gene-specific proteins. The interactions among the proteins of the TFIID complex are highly conserved. TBPc and its TAFs are among the most evolutionarily conserved proteins (41, 42); many TAFs contain histone-like structural domains that are responsible for the protein–protein interactions within TFIID (43, 44). Although lacking the histone-like fold, TBPc is structurally similar to histones, including an absence of tryptophan residues and the unique microenvironment of its tyrosine residues that is discussed below (45). The structural analogy between TBP and histones can perhaps be extended to both proteins possessing N-terminal “tails”. The greater affinity of TBPc for DNA compared to TBP (Figure 1) and the different mechanisms of TBP and TBPc self-association (20–22) suggest that mediation of assembly reactions is a principal function of TBP’s N-terminal domain (5, 16–18).2
Tyrosine Fluorescence Specifically Reports on the Structure of the DNA-Binding Saddle
The tyrosine fluorescence of TBP and TBPc is statically quenched upon TATA box binding due to the energy transfer with the nucleotide bases (Figure 2 and ref 46). Four of the proteins’ six tyrosine residues are within the DNA binding saddle; the other two are located on the top surface of the H2′ subdomain (Figure 10A and ref 13). The solvent accessibilities of the saddle and surface residues are significantly different (Figure 10B and ref 4). Surface residues Y224 and Y231 are “significantly exposed” with 20–30% accessibility compared with 0–15% accessibility for the tyrosine residues in the saddle. These values are comparable to the 22 and 0–10% accessibilities, respectively, calculated from the crystallized TBPc monomers (8). The accessibility of the surface residues calculated from the TBPc structures is unaffected by DNA binding.
Figure 10.
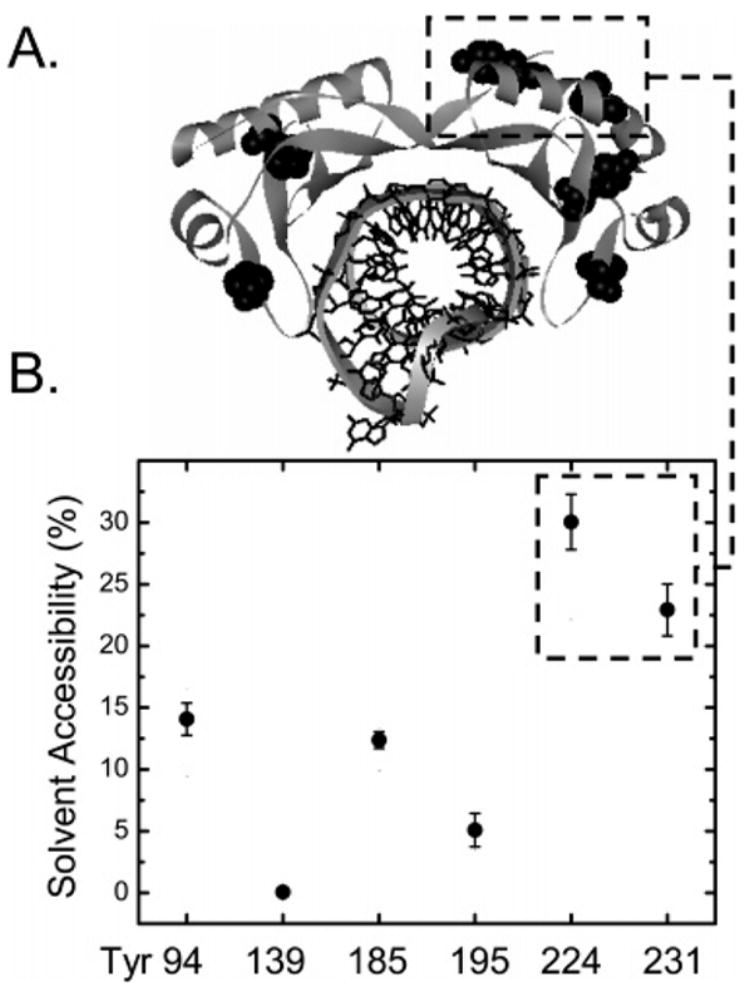
Highly solvent accessible tyrosines are most distal to the DNA binding saddle of TBP. (A) Positions of all six tyrosines as shown crystallographically (13). (B) Solvent accessibility for each particular tyrosine of the C domain of TBP, as shown by molecular dynamic simulations (4).
That Y224 and Y231 are least quenched by DNA follows from their distance from the bound nucleotides (Table 3). These residues are also the most exposed to the solvent (Figure 9B) and therefore should be most accessible to dynamic quenching in TBP–DNA and TBPc–DNA complexes. Since the tyrosine fluorescence of TBP– and TBPc–DNA complexes is insensitive to iodide (Figure 2 and Table 1), the fluorescence quantum yield of Y224 and Y231 must be relatively low and the quantum yield of the four tyrosines surrounding the DNA binding saddle (Y94, Y139, Y185, and Y195) unusually high (4). Thus, the measured tyrosine fluorescence uniquely reports upon the structure of the DNA binding saddle of TBP and TBPc. A low quantum yield for tyrosine fluorescence is typical of proteins (47), with the exception of histones whose tyrosines have unusually high quantum yields (45). We interpret our results to reflect conservation of the microenvironment of the protein fold that stabilizes highly conserved interactions within multiprotein protein–DNA complexes such as the nucleosome and transcription pre-initiation complexes, extending the structural analogy between TBP and histones.
Table 3.
Distances between the Closest Carbon Atoms of the Tyrosine and Nucleotide Ringsa
| residue number | RDA (Å)b | Ec | |
|---|---|---|---|
| Tyr residues surrounding the DNA binding saddle | 94 | 11.7 | 0.82 |
| 139 | 12.8 | 0.72 | |
| 185 | 10.4 | 0.90 | |
| 195 | 13.4 | 0.66 | |
| “out of the saddle” Tyr residues | 224 | 15.7 | 0.43 |
| 231 | 18.0 | 0.25 |
The positions of tyrosines in the TBPc structure are shown in Figure 10.
Donor–acceptor distance.
The effectiveness of Tyr–DNA energy migration (E) was calculated with the equation 1/E = 1 + (RDA/Ro)6, where Ro ≈ 15 Å for the tyrosine–DNA FRET donor–acceptor pair.
Interdomain Interactions
As expected, the binding of TBP and TBPc to the strong AdMLP TATA box sequence renders the saddles of TBP and TBPc equally inaccessible to the negative quencher iodide (Table 1). The negative quencher is particularly informative in that it mimics the charge of DNA. However, the quencher accessibility of the saddle differs between the two proteins when they are free in solution. While the saddles of free monomeric TBP and dimeric TBPc are comparably accessible to the negatively charged quencher, TBP’s saddle is quenched 2-fold less upon assembly of TBP monomers into octamers. In contrast, the quenching of TBPc’s saddle is weak and independent of protein concentration, consistent with the proposed saddle-to-saddle dimerization of TBPc (19) as TBPc is dimeric in the quenching experiments.2 Although the absence of a direct comparison between TBP and TBPc monomers leaves ambiguous the degree to which the N-terminal domain protects the saddle from the negative quencher, the N-terminus could inhibit DNA binding without blocking the tyrosine’s access to solvent. Alternatively, the N-terminal domain might modulate DNA binding by rendering the structure of the C-terminal core less compact and flexible as suggested by the results obtained with the neutral quencher acrylamide (Figures 3 and 5 and Table 1).
The conformation of the N-terminal domain varies with solution conditions, oligomerization and DNA binding converting it from a globular conformation that inhibits DNA binding to a less folded form in TBP–DNA complexes (Figure 6A,B and Table 1). The structural plasticity of the N-terminal domain is in contrast to the rigidity of the C-terminal domain. From the point of view of the C-terminal core, the N-terminal domain of TBP may be considered “just another transcription factor” that modulates its function. The structural changes of the N-terminal domain are comparable to those undergone by some TAFs during assembly of the pre-initiation complex. For example, TAF1 folds from a largely unstructured state to a globular structure that occupies the DNA binding saddle of TBP, thereby inhibiting its DNA binding activity (48). Another example is the N-terminal domain of TAF(II)230, which mimics DNA bound to the concave surface of TBP (49, 50). In addition to modulating the function of TBP, the repositioning and changed conformation of the N-terminal domain is a potential regulatory signal to TAFs that TBP is bound to DNA, consistent with its proposed role as a dynamic regulator of TBP function.
Electrostatics Contributes Differently to DNA Binding by TBPc and TBP
Formation of TBP–DNA complexes is a result of unfavorable enthalpy changes offset by favorable entropy changes, including the release of water and salt (51). A large area of hydrophobic surface is buried when TBPc binds to DNA by bending and deforming the duplex toward an A-like conformation, resulting in a broad, flat hydrophobic surface that is complementary to the hydrophobic surface of the protein’s saddle (2, 13). Even so, electrostatics dominates the binding of TBP to DNA by contributing more than one-half to the net stability of complex formation when divalent cations are not present. The electrostatic contribution is significantly reduced when divalent cations are present, more dramatically for TBP than for TBPc (Figure 8 and Table 2). The larger electrostatic contribution to TBP binding relative to TBPc binding may reflect changes in the binding of the C-terminal domain to the DNA or interactions between the two domains. Evidence for direct interactions between the DNA and the N-terminal domain has not been found. For example, the absence of quenching of the tryptophan fluorescence in the TBP–DNA complex shows that the N-terminal domain is not in the proximity of the DNA (Table 1). Thus, a proper understanding of the thermodynamics of binding of promoter by TBP must include the full-length protein characterized in a solution that appropriately models the cellular milieu.
The net cation displacement measured for formation of the TBPc– and TBP–DNA complexes reflects the sum of sequence-specific and nonspecific contributions that influence different portions of the salt displacement isotherms (Figure 7). The average number of the ions released upon binding (Table 2) mainly reflects the number of nonspecific ionic contacts disrupted upon dissociation of the complexes and thus differs from direct measures of the binding energy in the equilibrium experiments (27, 31). The net four to five cations released upon binding of TBP or TBPc to the 14 bp duplex (Table 2) is comparable to binding measurements made using longer restriction DNA fragments (31). These data taken together with the stability of the 14 bp duplex under experimental conditions (see Experimental Procedures) show that neither long-range interactions nor end effects (52) appear to influence these measurements. The displacement of four to five cations upon the binding of TBPc is much weaker than might be expected on the basis of inspection of the number of phosphates contacted in formation of the complex. Of interest is the observation that monovalent cations can localize within the grooves of duplex DNA (53–60) since TBP binding flattens the grooves of the bound duplex. However, the contribution of these localized cations on DNA structures like AT tract bending or groove narrowing (55, 56, 61) remains uncertain due to average occupancies of just a few percent at particular sites (53, 57).
The divergence of expectation from inspection of structure and thermodynamic reality is common and reflects the multitude of contributions to the formation of protein–DNA complexes (2, 54, 62). Thus, DNA conformation depends not on locally bound monovalent cations but rather on the balance of the competing factors in the electrostatic free energy (63). The contribution from solvation that originates in large measure from counterions is a significant portion of electrostatic free energy. In the TBP–TATA box complex, attractive interactions may be mediated through a delocalized charge potential (13); monovalent delocalized cations influence this potential. The effect of mutations on the salt dependence of TBP–DNA binding has been rationalized by the notion of “spread” cations reducing the electronegativity of the protein and the complex as a whole (64).
The SK values listed in Table 2 reflect a relative thermodynamic measure of the reduction of the electronegativity necessary for complex formation. In contrast, the dissociation midpoints (mp) of the salt displacement titrations reflect both electrostatic and nonelectrostatic contributions to binding. Inspection of these values shows that the enhanced stability of the TBPc–DNA complex over the TBP–DNA complex (mp = 162 ± 8 vs 101 ± 2) is accompanied by only a small change in the number of cations released upon binding [SK = 5.9 ± 0.5 and 4.6 ± 0.5, respectively (Table 2)]. It is interesting that the greater stability of TBPc–DNA relative to TBP–DNA complexes in the presence of Mg2+ and Ca2+ (mp = 228 ± 11 and 132 ± 7, respectively) is also accompanied by only a slight change in the electrostatic contribution under these solution conditions (SK = 3.8 ± 0.5 and 3.47 ± 0.45, respectively).
These studies do not reveal the exact mechanism by which the N-terminal domain modulates the electrostatic contribution to DNA binding or the reason divalent cations differentially affect TBPc and TBP. A Mg2+- and Ca2+-dependent change in the conformation of the C-terminal domain is unlikely in light of the invariance of its structure upon DNA binding (Table 1). We believe that it is more likely that the divalent cations affect the structure of the bound DNA perhaps by minimizing the energy cost of its distortion in the TBPc–DNA and TBP–DNA complexes. This conjecture is consistent with the demonstrated stabilization of distorted DNA duplex structure by Mg2+ (65). It is possible that the N-terminal domain mimics the contribution of the divalent cations by interacting with the bound DNA and/or core domain.
Divalent Cations and TBP–DNA Complex Structure
Salt displacement isotherms such as those shown in Figure 7 would be expected to shift to lower concentrations of the monovalent ions in the presence of divalent cations. However, the opposite is observed. Mg2+ and Ca2+ stabilize TBP and TBPc complexes with DNA against salt-induced dissociation (Figure 7 and Table 2). Since only the DNA is deformed in the TBP–DNA complex (13), it is likely that divalent cations stabilize the distorted DNA. In the absence of specific effects such as those discussed below, monovalent and divalent cations will additively effect the stability of protein–DNA complexes (40).
Divalent cations can have unique effects on DNA structure and protein–DNA complexes. Mg2+ and Ca2+ can be easily distinguished from other solvent densities in high-resolution X-ray structures. These divalent cations are fully hydrated. Their bound waters form hydrogen bonds with bases and phosphate groups of DNA. The bound metal ions generally contribute to the stabilization of the existing conformation (66). Divalent cations can also participate in interactions with the base’s nucleic acids. For example, hydrated Mg2+ located in the major groove of B-DNA appears to partially pull cytosine bases from the helical stack exposing the base ring to positive charge (55). Specific interactions are often mediated through a net of direct or water-mediated hydrogen bonds with DNA and the protein in complexes. Mg2+ has been shown to form ionic bridges between DNA phosphates and RNA polymerase (67) and influence the DNA sequence specificity of the papillomavirus E2 proteins (38).
We hypothesize that Mg2+ and Ca2+ play a similar role in stabilizing the deformed DNA in complexes with TBP and TBPc (33, 68). In this view, the weaker dependence of TBP on divalent cations is due to interdomain interactions and/or the observed N-terminal domain conformation changes. The interdomain interaction in TBP leads to a “loosening” of the structure of the C-terminal core domain alone and complexed with DNA (Figure 5). This property is reflected in both in the intrinsic fluorescence of the tyrosine residues and the greater end-to-end distance of the bound DNA (Figure 9). The greater compactness of TBPc compared with TBP correlates with the greater stability of TBPc complexes in the salt-induced dissociation experiments (Figure 7).
In proposing that Mg2+ and/or Ca2+ preferentially interacts with the DNA within TBP– and TBPc–DNA complexes, we recognize that the net salt balance of these reactions can be dramatically altered by select substitutions of amino acid side chains. Three or four mutations are enough to convert the net cation release of S. cerevisiae TBP to the net cation uptake of the TBP from the hyperthermophilic archeon P. woesei (69). Detailed study of the cation type and concentration dependence of complex formation combined with mutational analysis will be important for fully understanding the mechanism by which divalent cations contribute to transcriptional regulation.
Abbreviations
- PIC
transcription pre-initiation complex
- TBP
TATA binding protein
- TBPc
DNA-binding domain of the TATA binding protein
- N-Tyr
N-acetyl-L-tyrosine ethyl ester
- N-Trp
N-acetyl-L-tryptophan ethyl ester
- AdMLP
adenovirus major late promoter
- FRET
fluorescence resonance energy transfer
Footnotes
This work was supported by Grant GM39929 from the National Institutes of Health.
Gupta, S., Cheng, H. Y., Mollah, A. K., Jamison, E., Morris, S., Chance, M. R., Khrapunov, S., and Brenowitz, M. (2007) DNA and protein footprinting analysis of the modulation of DNA binding by the N-terminal domain of the Saccharomyces cerevisiae TATA Binding Protein (manuscript in preparation).
NOTE ADDED AFTER ASAP PUBLICATION
This paper was originally published March 23, 2007. Table 1 has been revised. The corrected version was published March 30, 2007.
References
- 1.Sanders SL, Garbett KA, Weil PA. Molecular characterization of Saccharomyces cerevisiae TFIID. Mol Cell Biol. 2002;22:6000–6013. doi: 10.1128/MCB.22.16.6000-6013.2002. [DOI] [PMC free article] [PubMed] [Google Scholar]
- 2.Patikoglou GA, Kim JL, Sun L, Yang SH, Kodadek T, Burley SK. TATA element recognition by the TATA box-binding protein has been conserved throughout evolution. Genes Dev. 1999;13:3217–3230. doi: 10.1101/gad.13.24.3217. [DOI] [PMC free article] [PubMed] [Google Scholar]
- 3.Pastor N, Weinstein H, Jamison E, Brenowitz M. A Detailed Interpretation of OH Radical Footprints in a TBP-DNA Complex Reveals the Role of Dynamics in the Mechanism of Sequence-specific Binding. J Mol Biol. 2000;304:55–68. doi: 10.1006/jmbi.2000.4173. [DOI] [PubMed] [Google Scholar]
- 4.Khrapunov S, Pastor N, Brenowitz M. Solution structural studies of the Saccharomyces cerevisiae TATA Binding Protein (TBP) Biochemistry. 2002;41:9559–9571. doi: 10.1021/bi0255773. [DOI] [PubMed] [Google Scholar]
- 5.Rashidzadeh H, Khrapunov S, Chance MR, Brenowitz M. Solution structure and interdomain interactions of the Saccharomyces cerevisiae “TATA binding protein” (TBP) probed by radiolytic protein footprinting. Biochemistry. 2003;42:3655–3665. doi: 10.1021/bi027203f. [DOI] [PubMed] [Google Scholar]
- 6.DeDecker BS, O’Brien R, Fleming PJ, Geiger JH, Jackson SP, Sigler PB. The crystal structure of a hyperthermophilic archaeal TATA-box binding protein. J Mol Biol. 1996;264:1072–1084. doi: 10.1006/jmbi.1996.0697. [DOI] [PubMed] [Google Scholar]
- 7.Hoffmann A, Chiang CM, Oelgeschlager T, Xie X, Burley SK, Nakatani Y, Roeder RG. A histone octamer-like structure within TFIID. Nature. 1996;380:356–359. doi: 10.1038/380356a0. [DOI] [PubMed] [Google Scholar]
- 8.Chasman DI, Flaherty KM, Sharp PA, Kornberg RD. Crystal structure of yeast TATA-binding protein and model for interaction with DNA. Proc Natl Acad Sci USA. 1993;90:8174–8178. doi: 10.1073/pnas.90.17.8174. [DOI] [PMC free article] [PubMed] [Google Scholar]
- 9.Nikolov DB, Hu SH, Lin J, Gasch A, Hoffmann A, Horikoshi M, Chua NH, Roeder RG, Burley SK. Crystal structure of TFIID TATA-box binding protein. Nature. 1992;360:40–46. doi: 10.1038/360040a0. [DOI] [PubMed] [Google Scholar]
- 10.Nikolov DB, Chen H, Halay ED, Hoffman A, Roeder RG, Burley SK. Crystal structure of a human TATA box-binding protein/TATA element complex. Proc Natl Acad Sci USA. 1996;93:4862–4867. doi: 10.1073/pnas.93.10.4862. [DOI] [PMC free article] [PubMed] [Google Scholar]
- 11.Parkhurst KM, Brenowitz M, Parkhurst LJ. Simultaneous binding and bending of promoter DNA by the TATA binding protein: Real time kinetic measurements. Biochemistry. 1996;35:7459–7465. doi: 10.1021/bi9530301. [DOI] [PubMed] [Google Scholar]
- 12.Nikolov DB, Burley SK. 2.1 Å resolution refined structure of a TATA box-binding protein (TBP) Nat Struct Biol. 1994;1:621–637. doi: 10.1038/nsb0994-621. [DOI] [PubMed] [Google Scholar]
- 13.Kim Y, Geiger JH, Hahn S, Sigler PB. Crystal structure of a yeast TBP/TATA-box complex. Nature. 1993;365:512–520. doi: 10.1038/365512a0. [DOI] [PubMed] [Google Scholar]
- 14.Lee M, Struhl K. Multiple functions of the nonconserved N-terminal domain of yeast TATA-binding protein. Genetics. 2001;158:87–93. doi: 10.1093/genetics/158.1.87. [DOI] [PMC free article] [PubMed] [Google Scholar]
- 15.Mittal V, Hernandez N. Role for the amino-terminal region of human TBP in U6 snRNA transcription. Science. 1997;275:1136–1140. doi: 10.1126/science.275.5303.1136. [DOI] [PubMed] [Google Scholar]
- 16.Kuddus R, Schmidt MC. Effect of the non-conserved N-terminus on the DNA binding activity of the yeast TATA binding protein. Nucleic Acids Res. 1993;21:1789–1796. doi: 10.1093/nar/21.8.1789. [DOI] [PMC free article] [PubMed] [Google Scholar]
- 17.Horikoshi M, Yamamoto T, Ohkuma Y, Weil PA, Roeder RG. Analysis of structure-function relationships of yeast TATA box binding factor TFIID. Cell. 1990;61:1171–1178. doi: 10.1016/0092-8674(90)90681-4. [DOI] [PubMed] [Google Scholar]
- 18.Lescure A, Lutz Y, Eberhard D, Jacq X, Krol A, Grummt I, Davidson I, Chambon P, Tora L. The N-terminal domain of the human TATA-binding protein plays a role in transcription from TATA-containing RNA polymerase II and III promoters. EMBO J. 1994;13:1166–1175. doi: 10.1002/j.1460-2075.1994.tb06366.x. [DOI] [PMC free article] [PubMed] [Google Scholar]
- 19.Coleman RA, Taggart AK, Benjamin LR, Pugh BF. Dimerization of the TATA binding protein. J Biol Chem. 1995;270:13842–13849. doi: 10.1074/jbc.270.23.13842. [DOI] [PubMed] [Google Scholar]
- 20.Campbell KM, Ranallo RT, Stargell LA, Lumb KJ. Reevaluation of transcriptional regulation by TATA-binding protein oligomerization: Predominance of monomers. Biochemistry. 2000;39:2633–2638. doi: 10.1021/bi9922998. [DOI] [PubMed] [Google Scholar]
- 21.Daugherty MA, Brenowitz M, Fried MG. The TATA-binding protein from Saccharomyces cerevisiae oligomerizes in solution at micromolar concentrations to form tetramers and octamers. J Mol Biol. 1999;285:1389–1399. doi: 10.1006/jmbi.1998.2427. [DOI] [PubMed] [Google Scholar]
- 22.Daugherty MA, Brenowitz M, Fried MG. Participation of the amino-terminal domain in the self-association of the full-length yeast TATA binding protein. Biochemistry. 2000;39:4869–4880. doi: 10.1021/bi992423n. [DOI] [PubMed] [Google Scholar]
- 23.Masters KM, Parkhurst KM, Daugherty MA, Parkhurst LJ. Native human TATA-binding protein simultaneously binds and bends promoter DNA without a slow isomerization step or TFIIB requirement. J Biol Chem. 2003;278:31685–31690. doi: 10.1074/jbc.M305201200. [DOI] [PubMed] [Google Scholar]
- 24.Adams CA, Kar SR, Hopper JE, Fried MG. Self-association of the amino-terminal domain of the yeast TATA-binding protein. J Biol Chem. 2004;279:1376–1382. doi: 10.1074/jbc.M307867200. [DOI] [PubMed] [Google Scholar]
- 25.Perez-Howard GM, Weil PA, Beechem JM. Yeast TATA binding protein interaction with DNA: Fluorescence determination of oligomeric state, equilibrium binding, on-rate, and dissociation kinetics. Biochemistry. 1995;34:8005–8017. doi: 10.1021/bi00025a006. [DOI] [PMC free article] [PubMed] [Google Scholar]
- 26.Gill SC, von Hippel PH. Calculation of protein extinction coefficients from amino acid sequence data. Anal Biochem. 1989;182:319–326. doi: 10.1016/0003-2697(89)90602-7. [DOI] [PubMed] [Google Scholar]
- 27.Khrapunov S, Brenowitz M. Comparison of the Effect of Water Release on the Interaction of the Saccharomyces cerevisiae TATA Binding Protein (TBP) with “TATA Box” Sequences Composed of Adenosine or Inosine. Biophys J. 2004;86:371–383. doi: 10.1016/S0006-3495(04)74113-2. [DOI] [PMC free article] [PubMed] [Google Scholar]
- 28.SantaLucia J., Jr A unified view of polymer, dumbbell, and oligonucleotide DNA nearest-neighbor thermodynamics. Proc Natl Acad Sci USA. 1998;95:1460–1465. doi: 10.1073/pnas.95.4.1460. [DOI] [PMC free article] [PubMed] [Google Scholar]
- 29.Morrison LE, Stols LM. Sensitive fluorescence-based thermodynamic and kinetic measurements of DNA hybridization in solution. Biochemistry. 1993;32:3095–3104. doi: 10.1021/bi00063a022. [DOI] [PubMed] [Google Scholar]
- 30.Petri V, Hsieh M, Brenowitz M. Thermodynamic and kinetic characterization of the binding of the TATA binding protein to the adenovirus E4 promoter. Biochemistry. 1995;34:9977–9984. doi: 10.1021/bi00031a020. [DOI] [PubMed] [Google Scholar]
- 31.Petri V, Hsieh M, Jamison E, Brenowitz M. DNA sequence-specific recognition by the Saccharomyces cerevisiae “TATA” binding protein: Promoter-dependent differences in the thermodynamics and kinetics of binding. Biochemistry. 1998;37:15842–15849. doi: 10.1021/bi981072u. [DOI] [PubMed] [Google Scholar]
- 32.Lakowicz JR. Principles of Fluorescence Spectroscopy. 2. Kluwer Academic/Plenum; New York: 1999. [Google Scholar]
- 33.Lehrer SS. Solute perturbation of protein fluorescence. The quenching of the tryptophyl fluorescence of model compounds and of lysozyme by iodide ion. Biochemistry. 1971;10:3254–3263. doi: 10.1021/bi00793a015. [DOI] [PubMed] [Google Scholar]
- 34.Eftink M. Quenching-resolved emission anisotropy studies with single and multitryptophan-containing proteins. Biophys J. 1983;43:323–334. doi: 10.1016/S0006-3495(83)84356-2. [DOI] [PMC free article] [PubMed] [Google Scholar]
- 35.Parkhurst LJ. Distance parameters derived from time-resolved Forster resonance energy transfer measurements and their use in structural interpretations of thermodynamic quantities associated with protein-DNA interactions. Methods Enzymol. 2004;379:235–262. doi: 10.1016/S0076-6879(04)79013-8. [DOI] [PubMed] [Google Scholar]
- 36.Parkhurst KM, Parkhurst LJ. Kinetic studies by fluorescence resonance energy transfer employing a double-labeled oligonucleotide: Hybridization to the oligonucleotide complement and to single-stranded DNA. Biochemistry. 1995;34:285–292. doi: 10.1021/bi00001a035. [DOI] [PubMed] [Google Scholar]
- 37.Record MT, Jr, Ha JH, Fisher MA. Analysis of equilibrium and kinetic measurements to determine thermodynamic origins of stability and specificity and mechanism of formation of site-specific complexes between proteins and helical DNA. Methods Enzymol. 1991;208:291–343. doi: 10.1016/0076-6879(91)08018-d. [DOI] [PubMed] [Google Scholar]
- 38.Blakaj DM, Kattamuri C, Khrapunov S, Hegde RS, Brenowitz M. Indirect readout of DNA sequence by papillomavirus e2 proteins depends upon net cation uptake. J Mol Biol. 2006;358:224–240. doi: 10.1016/j.jmb.2006.01.093. [DOI] [PubMed] [Google Scholar]
- 39.Eftink MR, Ghiron CA. Fluorescence quenching studies with proteins. Anal Biochem. 1981;114:199–227. doi: 10.1016/0003-2697(81)90474-7. [DOI] [PubMed] [Google Scholar]
- 40.Record MT, Jr, deHaseth PL, Lohman TM. Interpretation of monovalent and divalent cation effects on the lac repressor-operator interaction. Biochemistry. 1977;16:4791–4796. doi: 10.1021/bi00641a005. [DOI] [PubMed] [Google Scholar]
- 41.Isenberg I. Histones. Annu Rev Biochem. 1979;48:159–191. doi: 10.1146/annurev.bi.48.070179.001111. [DOI] [PubMed] [Google Scholar]
- 42.Tora L. A unified nomenclature for TATA box binding protein (TBP)-associated factors (TAFs) involved in RNA polymerase II transcription. Genes Dev. 2002;16:673–675. doi: 10.1101/gad.976402. [DOI] [PubMed] [Google Scholar]
- 43.Burley SK, Xie X, Clark KL, Shu F. Histone-like transcription factors in eukaryotes. Curr Opin Struct Biol. 1997;7:94–102. doi: 10.1016/s0959-440x(97)80012-7. [DOI] [PubMed] [Google Scholar]
- 44.Gangloff YG, Romier C, Thuault S, Werten S, Davidson I. The histone fold is a key structural motif of transcription factor TFIID. Trends Biochem Sci. 2001;26:250–257. doi: 10.1016/s0968-0004(00)01741-2. [DOI] [PubMed] [Google Scholar]
- 45.Khrapunov SN, Dragan AI, Sivolob AV, Zagariya AM. Mechanisms of stabilizing nucleosome structure. Study of dissociation of histone octamer from DNA. Biochim Biophys Acta. 1997;1351:213–222. doi: 10.1016/s0167-4781(96)00199-6. [DOI] [PubMed] [Google Scholar]
- 46.Helene C, Lancelot G. Interactions between functional groups in protein-nucleic acid associations. Prog Biophys Mol Biol. 1982;39:1–68. doi: 10.1016/0079-6107(83)90013-5. [DOI] [PubMed] [Google Scholar]
- 47.Longworth JW. In: Time-resolved Fluorescence Spectroscopy in Biochemistry and Biology. Cundall RB, Dale RE, editors. Plenum Press; New York: 1983. pp. 651–686. [Google Scholar]
- 48.Mal TK, Masutomi Y, Zheng L, Nakata Y, Ohta H, Nakatani Y, Kokubo T, Ikura M. Structural and functional characterization on the interaction of yeast TFIID subunit TAF1 with TATA-binding protein. J Mol Biol. 2004;339:681–693. doi: 10.1016/j.jmb.2004.04.020. [DOI] [PubMed] [Google Scholar]
- 49.Oelgeschlager T, Chiang CM, Roeder RG. Topology and reorganization of a human TFIID-promoter complex. Nature. 1996;382:735–738. doi: 10.1038/382735a0. [DOI] [PubMed] [Google Scholar]
- 50.Liu D, Ishima R, Tong KI, Bagby S, Kokubo T, Muhandiram DR, Kay LE, Nakatani Y, Ikura M. Solution structure of a TBP-TAF(II)230 complex: Protein mimicry of the minor groove surface of the TATA box unwound by TBP. Cell. 1998;94:573–583. doi: 10.1016/s0092-8674(00)81599-8. [DOI] [PubMed] [Google Scholar]
- 51.Jen-Jacobson L, Engler LE, Jacobson LA. Structural and thermodynamic strategies for site-specific DNA binding proteins. Structure. 2000;8:1015–1023. doi: 10.1016/s0969-2126(00)00501-3. [DOI] [PubMed] [Google Scholar]
- 52.Zhang W, Ni H, Capp MW, Anderson CF, Lohman TM, Record MT., Jr The importance of coulombic end effects: Experimental characterization of the effects of oligonucleotide flanking charges on the strength and salt dependence of oligocation (L8+) binding to single-stranded DNA oligomers. Biophys J. 1999;76:1008–1017. doi: 10.1016/S0006-3495(99)77265-6. [DOI] [PMC free article] [PubMed] [Google Scholar]
- 53.Howerton SB, Nagpal A, Williams LD. Surprising roles of electrostatic interactions in DNA-ligand complexes. Biopolymers. 2003;69:87–99. doi: 10.1002/bip.10319. [DOI] [PubMed] [Google Scholar]
- 54.Tereshko V, Wilds CJ, Minasov G, Prakash TP, Maier MA, Howard A, Wawrzak Z, Manoharan M, Egli M. Detection of alkali metal ions in DNA crystals using state-of-the-art X-ray diffraction experiments. Nucleic Acids Res. 2001;29:1208–1215. doi: 10.1093/nar/29.5.1208. [DOI] [PMC free article] [PubMed] [Google Scholar]
- 55.McFail-Isom L, Sines CC, Williams LD. DNA structure: Cations in charge? Curr Opin Struct Biol. 1999;9:298–304. doi: 10.1016/S0959-440X(99)80040-2. [DOI] [PubMed] [Google Scholar]
- 56.Hud NV, Sklenar V, Feigon J. Localization of ammonium ions in the minor groove of DNA duplexes in solution and the origin of DNA A-tract bending. J Mol Biol. 1999;286:651–660. doi: 10.1006/jmbi.1998.2513. [DOI] [PubMed] [Google Scholar]
- 57.Denisov VP, Halle B. Sequence-specific binding of counterions to B-DNA. Proc Natl Acad Sci USA. 2000;97:629–633. doi: 10.1073/pnas.97.2.629. [DOI] [PMC free article] [PubMed] [Google Scholar]
- 58.Stellwagen NC, Magnusdottir S, Gelfi C, Righetti PG. Preferential counterion binding to A-tract DNA oligomers. J Mol Biol. 2001;305:1025–1033. doi: 10.1006/jmbi.2000.4362. [DOI] [PubMed] [Google Scholar]
- 59.Young MA, Ravishanker G, Beveridge DL. A 5-nanosecond molecular dynamics trajectory for B-DNA: Analysis of structure, motions, and solvation. Biophys J. 1997;73:2313–2336. doi: 10.1016/S0006-3495(97)78263-8. [DOI] [PMC free article] [PubMed] [Google Scholar]
- 60.Soler-Lopez M, Malinina L, Liu J, Huynh-Dinh T, Subirana JA. Water and ions in a high resolution structure of B-DNA. J Biol Chem. 1999;274:23683–23686. doi: 10.1074/jbc.274.34.23683. [DOI] [PubMed] [Google Scholar]
- 61.Hud NV, Polak M. DNA-cation interactions: The major and minor grooves are flexible ionophores. Curr Opin Struct Biol. 2001;11:293–301. doi: 10.1016/s0959-440x(00)00205-0. [DOI] [PubMed] [Google Scholar]
- 62.Ha JH, Capp MW, Hohenwalter MD, Baskerville M, Record MT., Jr Thermodynamic stoichiometries of participation of water, cations and anions in specific and nonspecific binding of lac repressor to DNA. Possible thermodynamic origins of the “glutamate effect” on protein-DNA interactions. J Mol Biol. 1992;228:252–264. doi: 10.1016/0022-2836(92)90504-d. [DOI] [PubMed] [Google Scholar]
- 63.McConnell KJ, Beveridge DL. DNA structure: What’s in charge? J Mol Biol. 2000;304:803–820. doi: 10.1006/jmbi.2000.4167. [DOI] [PubMed] [Google Scholar]
- 64.Bergqvist S, O’Brien R, Ladbury JE. Site-specific cation binding mediates TATA binding protein-DNA interaction from a hyperthermophilic archaeon. Biochemistry. 2001;40:2419–2425. doi: 10.1021/bi002488m. [DOI] [PubMed] [Google Scholar]
- 65.Misra VK, Hecht JL, Sharp KA, Friedman RA, Honig B. Salt effects on protein-DNA interactions. The lambda cI repressor and EcoRI endonuclease. J Mol Biol. 1994;238:264–280. doi: 10.1006/jmbi.1994.1286. [DOI] [PubMed] [Google Scholar]
- 66.Davey CA, Richmond TJ. DNA-dependent divalent cation binding in the nucleosome core particle. Proc Natl Acad Sci USA. 2002;99:11169–11174. doi: 10.1073/pnas.172271399. [DOI] [PMC free article] [PubMed] [Google Scholar]
- 67.Suh WC, Ross W, Record MT., Jr Two open complexes and a requirement for Mg2+ to open the lambda PR transcription start site. Science. 1993;259:358–361. doi: 10.1126/science.8420002. [DOI] [PubMed] [Google Scholar]
- 68.Kim US, Fujimoto BS, Furlong CE, Sundstrom JA, Humbert R, Teller DC, Schurr JM. Dynamics and structures of DNA: Long-range effects of a 16 base-pair (CG)8 sequence on secondary structure. Biopolymers. 1993;33:1725–1745. doi: 10.1002/bip.360331110. [DOI] [PubMed] [Google Scholar]
- 69.O’Brien R, DeDecker B, Fleming KG, Sigler PB, Ladbury JE. The effects of salt on the TATA binding protein-DNA interaction from a hyperthermophilic archaeon. J Mol Biol. 1998;279:117–125. doi: 10.1006/jmbi.1998.1743. [DOI] [PubMed] [Google Scholar]


