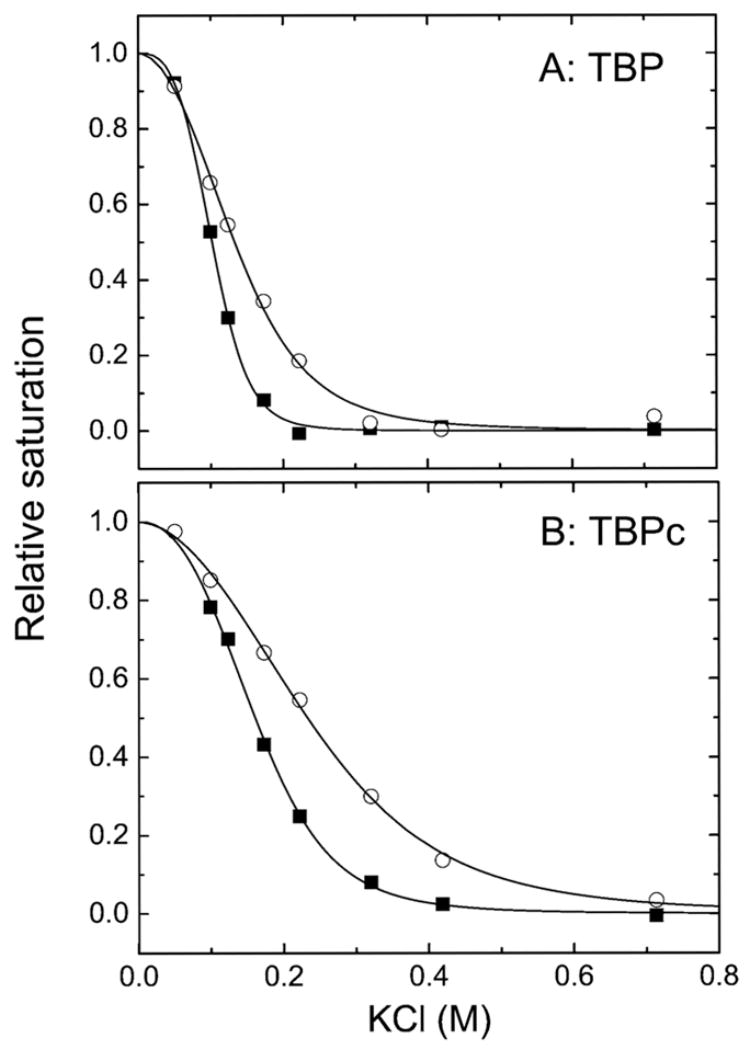
Figure 7.

Salt-induced dissociation isotherms for TBP (A) and TBPc (B) bound to 14 bp oligonucleotides at equimolar protein and DNA concentrations (0.25 μM) in buffer containing 25 mM Tris at pH 7.6 and, initially, 50 mM KCl. The added KCl is indicated by the x-axis. The squares depict isotherms determined in the absence of Ca2+ or Mg2+. The circles depict isotherms determined in the presence of 1 mM CaCl2 and 5 mM MgCl2. Dissociation of TBP and TBPc from DNA was followed by measurement of the level of FRET as described in Experimental Procedures.
