

Abstract
The purpose of our work was to develop heuristics for visualizing and interpreting gene-environment interactions (GEIs) and to assess the dependence of candidate visualization metrics on biological and study-design factors. Two information-theoretic metrics, the k-way interaction information (KWII) and the total correlation information (TCI), were investigated. The effectiveness of the KWII and TCI to detect GEIs in a diverse range of simulated data sets and a Crohn disease data set was assessed. The sensitivity of the KWII and TCI spectra to biological and study-design variables was determined. Head-to-head comparisons with the relevance-chain, multifactor dimensionality reduction, and the pedigree disequilibrium test (PDT) methods were obtained. The KWII and TCI spectra, which are graphical summaries of the KWII and TCI for each subset of environmental and genotype variables, were found to detect each known GEI in the simulated data sets. The patterns in the KWII and TCI spectra were informative for factors such as case-control misassignment, locus heterogeneity, allele frequencies, and linkage disequilibrium. The KWII and TCI spectra were found to have excellent sensitivity for identifying the key disease-associated genetic variations in the Crohn disease data set. In head-to-head comparisons with the relevance-chain, multifactor dimensionality reduction, and PDT methods, the results from visual interpretation of the KWII and TCI spectra performed satisfactorily. The KWII and TCI are promising metrics for visualizing GEIs. They are capable of detecting interactions among numerous single-nucleotide polymorphisms and environmental variables for a diverse range of GEI models.
Epidemiological studies of complex diseases such as cancer have long focused on determining exposures that are associated with increased risk of disease as the basis for preventive interventions. Unfortunately, for most chronic diseases, particularly cancer, there are few instances in which there is one strong key exposure associated with risk. Cancer risk is likely a function of the interactions among a number of factors, both exogenous and endogenous. There is growing evidence that cancer risk can be modified by genetic variants in relevant molecular pathways, such as those related to hormone and growth-factor metabolism, DNA repair, carcinogen activation and detoxification, cell-cycle control, apoptosis, immune factors, and other processes affecting carcinogenesis. Technological improvements have made the detection of genetic variation (particularly SNPs) fast, reliable, and cost-efficient.1–5 Whole-genome association studies employing these high-throughput techniques are being widely implemented. Nonetheless, whole-genome association studies have not generally taken into consideration the role of environmental exposures in modifying the effects of genetic variability on disease outcome.6 To understand carcinogenesis and other similarly complex disease processes, an integrated examination of both exposure data and genetic variants in numerous pathways involved in carcinogenesis is essential.
Techniques have been developed for visualizing multivariate data, but one of the key obstacles of visualizing SNP data from epidemiologic studies is high dimensionality. Typically, for a single participant, the number of SNP variables alone can range from tens to many hundreds thousands. Additional challenges include the limited range of the data values: genotype data are generally limited to either heterozygous or one of two homozygous states. Furthermore, for gene-environment interaction (GEI) analysis, we face the difficulty of combinatorial explosion—that is, the number of interactions increases rapidly because there are nCk ways of selecting a subset of k attributes for assessing interactions from n attributes. The available techniques, such as heat plots, multiple-sequence analysis, and multidimensional scaling, have many weaknesses and severe limitations, and visualization has not been extensively investigated in the context of GEI analysis. Good interactive, multidimensional visualization tools can provide additional perspectives that assist the user in understanding large, multidimensional, GEI data at an intuitive level, facilitate subsequent hypothesis generation, and enhance knowledge discovery.
We have developed a novel visualization approach, VizStruct, for complex, multidimensional data sets and have demonstrated that it is capable of both unsupervised assessment of similarities and differences among cases and of supervised detection of informative variables.7–9 The VizStruct approach is based on the information-theoretic Kullback-Liebler divergence (KLD), and our goal is to extend this strategy to visualizing GEIs. In this study, we developed and compared two specific information-theoretic metrics, the k-way interaction information (KWII) and the total correlation information (TCI), which are related to the KLD, for visualizing GEIs in data sets from epidemiologic studies with large numbers of SNP markers and environmental variables. The purpose of the study was to develop heuristics for visualizing and interpreting GEIs and to assess the dependence of these metrics on biological and study-design factors.
Material and Methods
Terminology and Representation
The KLD approach for GEI visualization was developed on the basis of two complementary information-theoretic approaches, the KWII and the TCI.
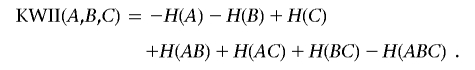
For the three-variable case, the KWII is defined in terms of entropies of the individual variables—H(A), H(B), and H(C)—and the entropies—H(AB), H(AC), H(BC), and H(ABC)—of the combinations of the variables,
 |
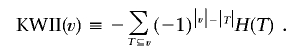
For the n-variable case on the set v={X1,X2,…,Xn}, the KWII can be written succinctly as an alternating sum over all possible subsets T of ν, with use of difference-operator notation. The following definition of KWII follows that of Jakulin10:
 |
For the three-variable case, the TCI11 is defined in terms of entropies of the individual variables H(A), H(B), and H(C) and the entropy of the joint distribution H(ABC),
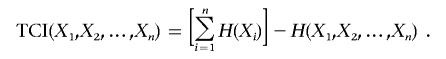
For the n-variable case on the set  , the TCI can be expressed as the difference between the entropies of the individual variables H(Xi) and the entropy of the joint distribution H(X1, X2,…,Xn),
 |
The definition of TCI is that from Watanabe,11 who referred to it as “total correlation.” We use the term “TCI” to emphasize its information-theoretic underpinnings and to distinguish it from statistical correlation measures such as the Pearson correlation.
In our analyses, because genetic and environmental interactions that affect disease status are of primary interest, all variable combinations for which KWII and TCI were computed contained the disease-status variable C.
Interpreting the KWII and TCI
Figure 1 is an information Venn diagram (adapted from the work of Bell12) that illustrates how the KWII and TCI measures complement each other for the case of two SNPs and an environmental variable E. The entire shaded region corresponds to TCI, whereas the darkest region corresponds to the magnitude of the KWII. (Technically, for the three-way interaction shown, the KWII is the negative of the intersection.)
Figure 1. .

Venn diagram highlighting the differences among three-way interaction information (3WII) and the TCI for an environmental variable E, and two SNPs, SNP 1 and SNP 2. The information in the black region corresponds to the magnitude of the 3WII, and the shaded gray and black regions are the TCI (adapted from the work of Bell12).
The KWII represents the gain or loss of information due to the inclusion of additional variables in the model. It quantitates interactions by representing the information that cannot be obtained without observing all k variables at the same time.10,13–15 In the bivariate case, the KWII is always positive, but, in the multivariate case, KWII can be positive or negative. The interpretation of KWII values is intuitive, because positive values indicate synergy between variables, negative values indicate redundancy between variables, and low magnitudes indicate the absence of k-way interactions.
The TCI is the amount of information shared among the variables in the set; equivalently, it can be viewed as a general measure of redundancy or dependency. A TCI value of zero indicates that the variables are independent. The maximal value of TCI occurs when one variable is completely redundant with the others—that is, knowing one variable provides complete knowledge of all the others.
On the basis of these interpretations of the KWII and TCI, our working hypothesis was that the KWII and TCI are capable of identifying those variables that are involved in gene-gene interactions (GGIs) or GEIs. Software for computing the KWII and TCI is available at the CSEBiORG Web site.
Visualization of GEI
The KWII and TCI results were summarized graphically as KWII or TCI “spectra.” These spectra are bar plots with KWII or TCI on the X-axis and with the corresponding variable combinations on the Y-axis. The variable combinations on the Y-axis were grouped according the number of variables involved in the combinations—that is, the one-variable–containing combinations, two-variable–containing combinations, and three-variable–containing combinations were each placed in separate groups. Within each group, the combinations were arranged in ascending order, so that specific variable combinations of interest could be easily found.
Simulations for Case Studies
Graphical representations of the models used for the case studies are shown in figures 2A, 3A, 4A, 5A, and 6A.
Figure 2. .

A, Interaction model (epistasis) used to generate the data for case study 1. The three SNP variables, SNP 1, SNP 2, and SNP 3, interact to determine the coat color phenotype status (black, yellow, and brown coat color phenotypes are denoted by B, Y, and Br, respectively; the comma in 2, 3 indicates the Boolean OR operator). SNP 4, SNP 5, and SNP 6 have no effect on the phenotype. B and C, Corresponding KWII and TCI spectra, respectively. The combinations used for KWII and TCI calculations are indicated on the Y-axes. The error bars in panels A and B represent SDs.
Figure 3. .

A, Interaction model used to generate the data for case study 2. The environmental variable (E with states H, M, and L) interacts with two SNP variables—SNP 1 (with alleles A1 and A2) and SNP 2 (with alleles B1 and B2)—to determine the disease status (controls are indicated by 0, and cases are indicated by 1). The asterisk (*) in a genotype represents a “wild card,” indicating that either allele is allowable. The vertical double bar (∥) indicates the Boolean OR operator. B and C, Corresponding KWII and TCI spectra, respectively. The combinations used for KWII and TCI calculations are indicated on the Y-axes. A representative one-variable–containing interaction peak, P1, and a representative two-variable-containing interaction peak, P2, are highlighted. The error bars in panels A and B represent SDs.
Figure 4. .

A, Interaction model used to generate the data for case study 3. The environmental variable (E with states H, M, and L) interacts with two SNP variables—SNP 1 (with alleles A1 and A2) and SNP 2 (with alleles B1 and B2)—to determine the disease status (controls are indicated by 0, and cases are indicated by 1). The asterisk (*) in a genotype represents a “wild card,” indicating that either allele is allowable. The vertical double bar (∥) indicates the Boolean OR operator, and horizontal overbar indicates the Boolean NOT. B and C, Corresponding KWII and TCI spectra, respectively. The combinations used for KWII and TCI calculations are indicated on the Y-axes. The three-variable–containing interaction peak is highlighted with the label “Q3.” The error bars in panels A and B represent SDs.
Figure 5. .

A, Interaction model used to generate the data for case study 4. The environmental variables E1 (with states H and L) and E2 (with states H, M, and L) independently interact with two-SNP variables—SNP 1 (with alleles A1 and A2) and SNP 2 (with alleles B1 and B2)—to determine the disease status (controls are indicated by 0, and cases are indicated by 1). The asterisk (*) in a genotype represents a “wild card,” indicating that either allele is allowable. B and C, Corresponding KWII and TCI spectra, respectively. All the one-variable–containing combinations and the 20 two-variable and 20 three-variable combinations with the highest KWII values are shown. The environmental variables are shown as E1, E2, E3, and E4; the SNP variables are numbered 1–6; and phenotype is indicated as C. Three representative peaks are labeled M1, M2, and M3. The combinations used for KWII and TCI calculations are indicated on the Y-axes. The error bars in panels A and B represent SDs.
Figure 6. .

A, Interaction model used to generate the data for case study 5. The environmental variables E1 (with states H and L) and E2 (with states H, M, and L) interact with two-SNP variables—SNP 1 (with alleles A1 and A2) and SNP 2 (with alleles B1 and B2)—to determine the disease status (controls are indicated by 0, and cases are indicated by 1). The asterisk (*) in a genotype represents a “wild card,” indicating that either allele is allowable. B and C, Corresponding KWII and TCI spectra, respectively. All one-variable–containing combinations and 20 two-variable and 20 three-variable combinations with the highest KWII values are shown. The environmental variables are shown as E1, E2, E3, and E4; the SNP variables are numbered 1–6; and phenotype is indicated as C. Three representative peaks are labeled N1, N2, and N3. The combinations used for KWII and TCI calculations are indicated on the Y-axes. The error bars in panels A and B represent SDs.
Case study 1, simple epistasis
The model used for this prototypical example of GGIs or epistasis is shown in figure 2A. We generated data sets containing 500 cases each of brown, yellow, and black coat colors (as in Labrador retrievers). The simulated data for case study 1 (fig. 2) consists of two biallelic SNP variables—SNP 1 and SNP 2—and a three-state phenotype variable, C, representing coat color. The alleles of each SNP were assigned an allele frequency of 0.5, and the three possible genotypes were assumed to be in Hardy-Weinberg equilibrium. As an aid to representation and computational coding, the homozygous genotype categories for SNP 1 were assigned values of (A1, A1) and (A2, A2), whereas the heterozygous genotype category was assigned a value of (A1, A2). For SNP 2, the homozygous genotype categories were assigned values of (B1, B1) and (B2, B2), and the heterozygous genotype category was assigned a value of (B1, B2).
Case studies 2 and 3
The underlying GEI models for case studies 2 and 3 are summarized in figures 3A and 4A, respectively. The simulated data for case studies 2 and 3 consisted of a single three-state, environmental variable E and five biallelic SNP variables, SNP 1–5, and binary-valued case-control status variable C. The environmental variable E was assumed to have three states—low exposure (assigned value =L), medium exposure (assigned value =M), and high exposure (assigned value =H)—that were treated as categorical. The percentages of subjects in low-, intermediate-, and high-exposure groups were 25%, 50%, and 25%, respectively. The SNP variables were structured as in case study 1. The disease was modeled to occur for various combinations of exposure to environmental variable E via interactions with the alleles for two SNPs, SNP 1 and SNP 2. SNP 3, SNP 4, and SNP 5 have no effect. A binary phenotype variable, C, representing case (assigned value =1) or control (assigned value =0) was used. For representation and computational coding, nomenclature analogous to that of case study 1 was used.
Case studies 4 and 5
The underlying GEI models for case studies 4 and 5 are summarized in figures 5A and 6A, respectively. The simulated data for case studies 4 and 5 consisted of four environmental variables, E1–E4. The environmental variables E1 and E2 were assumed to be associated with the disease phenotype, whereas E3 and E4 were assumed to be uninformative. The environmental variables E1 and E3 were assumed to have two states—low exposure (assigned value =L) and high exposure (assigned value =H)—that were treated as categorical. The environmental variables E2 and E4 were was assumed to have three states—low exposure (assigned value =L), medium exposure (assigned value =M), and high exposure (assigned value =H)—that were also treated as categorical. The percentages of subjects in low- and high-exposure groups of E1 and E3 were each 50%; the percentages of subjects in low-, intermediate-, and high-exposure groups of E2 and E4 were 25%, 50%, and 25%, respectively. The disease was modeled to occur for various combinations of exposure to the environmental variables E1 and E2 via interactions with the alleles for two SNPs, SNP 1 and SNP 2. The more common and less common (disease) alleles of SNP 1 and SNP 2 were assigned allele frequencies of 0.9 and 0.1, respectively. The other SNP variables, SNP 3–6, were uninformative and had allele frequencies of 0.5. All SNPs were assumed to be biallelic, with the three possible genotypes in Hardy-Weinberg equilibrium. A binary phenotype variable, C, representing case (assigned value =1) or control (assigned value =0) was used.
In case study 4, the E1 and E2 variables were assumed to act independent of each other, and the case phenotype value was assigned when combinations of the SNP genotypes and either environmental variable resulted in a case. In case study 5, an interaction between E1 and E2 was incorporated.
Simulations for case studies
A population of 50,000 individuals with randomly varying genotypes and environmental exposures consistent with the underlying GEI models was generated for each of the case studies. The case-control study design was assumed. From the population of 50,000 individual genotypes, 500 cases and 500 controls were randomly selected. For convenience, the values 1, 2, and 3 were used to represent the homozygous genotype for the major allele, the homozygous genotype for the minor allele, and the heterozygous genotype, respectively. The value 1 was used to represent cases, and 0 was used for controls. The SDs due to sampling were calculated by separate calculations from 100 independent repetitions of this procedure.
Simulations for the dependence of KWII and TCI on relative risk
The models of case studies 1–5 were used. The simulation approach was similar to those used in the case studies. The relative risk was defined as incidence of the disease phenotype in the group exposed to the disease-associated–gene-environmental variable combination relative to the incidence in the group without the exposure.31 The risk values for the cases were varied from 0.99 and from 0.95 to 0.5 at intervals of 0.05, whereas the corresponding risk values for controls was varied from 0.01 and from 0.05 to 0.5 at intervals of 0.05. This procedure yielded relative-risk values with a range of 1–99.
For each value of relative risk, 100 independent populations were generated, comprising 50,000 individuals with randomly varying genotypes and environmental exposures consistent with the GEI models of case studies. From each population of 50,000 individual genotypes, a single set of 500 case patients and 500 control subjects was obtained by randomly assigning the subjects to the case and control groups in accordance with the risk and the exposure to the disease-associated environmental and genotype variables. The KWII and TCI values for all possible combinations were computed. The same procedure of generating independent populations and obtaining independent samples was repeated at each value of relative risk.
Simulations for the dependence of power on relative risk
The model of case study 2 was used because it provides one-variable–, two-variable–, and three-variable–containing interactions. The simulation approach was similar to those used in case study 2. The case-control study design was assumed. A one-sided analysis was assumed, because positive KWII values indicate the presence of an interaction.
The power was defined as the fraction of KWII values in the test distribution that were ⩾95th percentile of KWII values in the “null distribution.” The risk values for the cases were varied from 0.99 and from 0.95 to 0.5 at intervals of 0.05, whereas the corresponding risk values for controls was varied from 0.01 and from 0.05 to 0.5 at intervals of 0.05. This procedure yielded relative-risk values with a range of 1–99.
The null distribution of KWII values was obtained from simulations with a relative risk of unity, which corresponds to the situation in which the likelihood of developing the disease phenotype is independent of environmental and genotype variables. The 95th percentile of KWII values was computed from the 1,000 KWII values present in this null distribution.
For each value of relative risk, 1,000 independent populations were generated, comprising 50,000 individuals with randomly varying genotypes and environmental exposures consistent with the GEI model of case study 2. From each population of 50,000 individual genotypes, a single set of 500 case patients and 500 control subjects was obtained by randomly assigning the subjects to the case and control groups in accordance with the risk and the exposure to the disease-associated environmental and genotype variables. The KWII and TCI values for all possible combinations were computed. The same procedure of generating independent populations and obtaining independent samples was repeated at each value of relative risk. The power was computed as a fraction of the KWII values that were ⩾95th percentile of KWII values for the null distribution.
Application to Analysis of Interactions in Chromosome 5
We assessed the effectiveness of the KWII and TCI spectra in identifying key interactions in a genotype data set from Daly et al.16 for 103 SNPs spanning a 616-kb region of chromosome 5q31 that contains a cluster of genes that has been linked to Crohn disease (MIM 606348) in a European-derived population17,18 (High-Resolution Haplotype Structure in the Human Genome). The data set contains genotypes for 129 parent-child trios (144 affected individuals who were treated as case patients and 243 unaffected individuals who were treated as control subjects).16 For all KWII and TCI analyses, SNPs whose genotypes were missing in ⩾20% of subjects were excluded.
Comparison with Other Competing Approaches
Using the data set of Daly et al.,16 we compared our KWII approach with the relevance chain–based InfoGeneMap approach of Dawy et al.,19 the multifactor dimensionality reduction (MDR) (SourceForge) technique,20–23 and the pedigree disequilibrium test (PDT).24
InfoGeneMap method
The relevance-chain method identifies the most strongly associated lower-order pairwise interactions and builds higher-order pairwise interactions with use of conditional mutual information. The method has been used to analyze the promoter region of the CTLA4 gene.19 In the present study, significance level of .05 was used. The InfoGeneMap criterion calculates the mutual information of the variable comprising the relevance chain and the disease phenotype. It is identical to the KWII (and the TCI) for combinations involving a single SNP and the disease phenotype.
MDR method
The MDR method is based on nonparametric multifactor models20–23 and uses constructive induction wherein the dimensionality of the multilocus genotype is systematically reduced by pooling into high- and low-risk groups.25 The approach has been used to study GEI in atrial fibrillation, autism, and diabetes mellitus.26–29 For MDR analysis, samples missing genotypes at ⩾10% of the SNP were excluded, followed by the exclusion of SNPs whose genotypes were missing in ⩾10% of subjects.
PDT
The program PDTPHASE, version 3.07, from the software package UNPHASED30 was used to perform tests of association of single SNPs and two-SNP haplotypes with Crohn disease status. This software program is an implementation of the PDT,24 with extensions to deal with haplotypes and missing data. All 103 SNPs were used for the PDT analyses. Haplotypes tested using the PDT were defined on the basis of the two-SNP–containing combinations identified by the KWII and TCI. For single-SNP and haplotype analyses, the PDT calculates a measure of association, D, within each family. In PDTPHASE, the null hypothesis D=0 is tested against the expected association measure over a prior distribution of allele frequencies (haplotype frequencies) that is defined using the maximum-likelihood gametic frequencies computed with the expectation-maximization algorithm. The odds ratios and CIs were converted to relative-risk estimates with the method of Zhang and Yu.31
Results
Performance of KWII and TCI on Simulated Data
In these experiments, our goal was to compare the effectiveness of KWII and TCI on simulated data with known patterns of interactions. These case studies were intentionally kept simple so that the heuristics for interpreting the KWII and TCI could be identified.
Case study 1, simple epistasis
Figure 2B and 2C shows the KWII and TCI, respectively, for each combination of interactions between the phenotype and all possible SNP combinations. We refer to these graphs as KWII and TCI spectra. The combinations are shown on the Y-axis; that is, “1 2 C” (hereafter, {1, 2, C}) indicates that variables SNP 1 and SNP 2 and the phenotype status C are used in calculating k-way (k=3) interaction. The KWII spectrum contains two dominant peaks corresponding to the {1, C} and {2, C} combinations, indicating that SNPs 1 and 2 contribute significantly to the phenotype status C. Qualitatively, the stepwise structure of the TCI spectra contrasts with the peaklike structure of the KWII spectra. The presence of a higher peak for the {1, 2, C} combination compared with the {1, C} and {2, C} combinations indicates a dependence of SNP 1 on SNP 2. Thus, the TCI detects the dependence between SNP 1 and SNP 2 and provides information that complemented the KWII. The variables not involved in interactions (SNPs 4, 5, and 6) can be more easily identified from the TCI spectra, because the TCI values for combinations containing these independent variables are the lowest compared with combinations containing interacting variables.
Case study 2
This case study contains a combination of one-variable–, two-variable–, and three-variable–containing interactions with the disease status variable C. Figure 3B and 3C shows the KWII and TCI spectra, respectively, for each combination of interactions among the disease-status phenotype, the environmental variable, and all possible SNP combinations. The error bars in figure 3B and 3C represent SDs that are due to sampling and demonstrate that the overall shapes of TCI and KWII spectra are robust to random variations caused by sampling.
By comparing the KWII spectrum with the model in figure 3A, specific heuristics for interpreting the spectrum can be identified. The one-variable–containing peaks corresponding to the {E, C}, {1, C}, and {2, C} effects correspond to the direct paths among E, SNP 1, SNP 2, and disease status when the environmental variable takes on value L; SNP 1 takes on value (A1, A1); or SNP 2 takes on value (B2, B2). The three two-variable–containing interaction peaks—{E, 1, C}, {E, 2, C}, and {1, 2, C}—correspond to the indirect paths among E, SNP 1, SNP 2, and disease status when, for example, the environmental variable E takes on the value M or H and SNP 1 takes on value (A1, A1). The three-variable–containing interaction peak {E, 1, 2, C} corresponds to the path from the independent variables E, SNP 1, and SNP 2 to the disease status–dependent variable when the environmental variable E takes on the value M or H and the SNP 1 and SNP 2 variables take on values (A2, A*) and (B1, B*), respectively, where an asterisk (*) represents 1 or 2. All other variable combinations had low or negative values of KWII. Thus, the peak KWII spectrum can be interpreted to yield the structure of the underlying GEI model.
The TCI spectrum complements the KWII spectrum. Again, the most notable characteristic of the TCI spectrum is its discrete steplike visual appearance. Each interacting variable in the data set contributes approximately one single unit step. Thus, the one-variable–containing peaks corresponding to the {E, C}, {1, C}, and {2, C} are each represented in the TCI. The height of the TCI peak increases whenever an informative variable is added to the variable list and is unchanged when a noninteracting variable is added. For example, in figure 3C, the peaks corresponding to {E, 1, 2, C}, {E, 1, 2, 3, C}, {E, 1, 2, 3, 4, C}, and {E, 1, 2, 3, 4, 5, C} have the highest TCI values among subsets containing four, five, six, and seven variables, because they contain all of the interacting variables E, SNP 1, and SNP 2. The lowest values of TCI correspond to subsets containing only noninteracting variables, such as {3, 4, C}, {3, 5, C}, {4, 5, C}, and {3, 4, 5, C}. By identifying the largest subset with low TCI values, the spectrum can be used to eliminate noninteracting variables. Interestingly, for one-variable–containing interactions, the values of KWII and TCI are identical and equivalent to mutual information.
Case study 3
For case study 3, we took particular care to construct a scheme (fig. 4A) wherein an interaction among all three variables—E, SNP 1, and SNP 2—was required to determine the case-control status variable. Figure 4B and 4C summarizes the KWII and TCI spectra, respectively. The high value of peaks corresponding to the {E, 1, 2, 3, C} combination in both spectra highlights the importance of the interactions among these three variables in determining case-control status.
Case study 4
In case study 4, the GEI scheme (fig. 5A) contained multiple environmental variables and SNP variables. Representative examples of environmental variables are obesity and smoking, which are associated with diseases such as cancer and heart disease. Figure 5B and 5C summarizes the KWII and TCI spectra, respectively. The one-variable–containing peaks in the KWII spectrum correctly identified the critical roles of E1, E2, SNP 1, and SNP 2 variables in the underlying model. A strong peak corresponding to the {1, 2, C} interaction was also identified. Notably, the {E1, E2, C} combination was not present among the top 20 two-variable combinations with the highest KWII values. The TCI spectrum had prominent peaks corresponding to the two-variable–containing {1, 2, C} combination (fig. 5C), the three-variable–containing {E1, 1, 2, C} and {E2, 1, 2, C} combinations, and the four-variable–containing {E1, E2, 1, 2, C} combination (data not shown). Again, the TCI spectrum reveals the overall effects of redundancy and dependency between the informative environmental variables E1 and E2 and the SNP variables SNP 1 and SNP 2. The KWII and TCI values of combinations entirely comprising uninformative variables had the lowest magnitudes.
Case study 5
In case study 5, the GEI scheme (fig. 6A) of case study 4 (fig. 5A) was modified to include an interaction between the two informative environmental variables, E1 and E2. Figure 6B and 6C summarizes the KWII and TCI spectra, respectively. As for case study 4, the one-variable–containing peaks in the KWII spectrum correctly identified the critical roles of the E1, E2, SNP 1, and SNP 2 variables in the underlying model, and the two-variable–containing {1, 2, C} interaction was also identified. However, the contribution of the one-variable–containing {E1, C} and {E2, C} peaks was stronger than in case study 4. Furthermore, the peak corresponding to the {E1, E2, C} combination was present among the top 20 two-variable combinations with the highest KWII values. The TCI spectrum had prominent peaks corresponding to the three-variable–containing {E1, 1, 2, C} and {E2, 1, 2, C} combinations (fig. 6C). Thus, the KWII and TCI spectra can be useful when there are interacting environment variables in addition to SNP variables.
Taken together, these case studies demonstrate that the KWII and TCI spectra are capable of visually summarizing a diverse range of GEI phenomena.
Dependence of KWII and TCI on Biological and Experimental Factors
For these studies, case study 2 was used, because the disease-status variable is dependent on a combination of one-variable–, two-variable–, and three-variable–containing interactions.
Effect of errors in the assignment of cases and controls
Errors in assignment of cases and controls can reduce the effectiveness of analytical methods to detect GGIs and GEI. Such errors can occur because of either diagnostic difficulties or the exposure to unknown environmental variables not included in the assessments.
We investigated the effects of assignment error on the KWII and TCI spectra (fig. 7) by varying the fraction of cases and controls misassigned from 0% to 25% in increments of 5%. The results demonstrate that the one-variable– and two-variable–containing peaks are relatively robust to misassignment. However, the three-variable–containing interaction peak P3 is relatively sensitive, and its amplitude decreases when the assignment-error fraction increases. In addition, spurious four-variable–containing interaction peaks begin to emerge. Thus, experimental design for GEI research should avoid assignment errors, to enhance the likelihood of detecting higher-order interactions.
Figure 7. .

Dependence of KWII for case study 2 on fraction of controls and cases misassigned. A–C, KWII spectra for three representative misassignment levels of 0%, 10%, and 25%, respectively. The combinations used for KWII calculations are indicated on the Y-axes. D, Dependence of KWII (unblackened symbols) and TCI (blackened symbols) for the one-variable–containing peak P1 (circles), the two-variable–containing peak P2 (triangles), and the three-variable–containing interaction peak P3 (squares). The TCI for P1 is not shown because it is equal to the KWII. The error bars represent SDs.
Effect of sample size
Sample size is a key determinant of statistical power. To investigate the dependence of sample size on the effectiveness of KWII and TCI (fig. 8), numerical experiments wherein sample size per group was varied from 125 to 8,000 in twofold increments were conducted. Figure 8A, 8B, and 8C shows the KWII spectra for sample sizes of 500 (used as a reference spectrum), 2,000, and 125 per group, respectively. Generally, the KWII and TCI were relatively independent of sample size, which occurs because the KWII and TCI formulas use relative frequencies that are corrected for sample size. The overall patterns of GEI were generally discernible, even at a sample size of 125 per group. However, an increase in the sampling SD and spurious increases in the higher-order KWII peaks were noted as the sample size decreased.
Figure 8. .

Sample-size dependence of KWII and TCI for case study 2. A–C, KWII spectra for three representative misassignment levels of 0%, 10%, and 25%, respectively. The combinations used for KWII calculations are indicated on the Y-axes. D, Dependence of KWII (unblackened symbols) and TCI (blackened symbols) for the one-variable–containing peak P1 (circles), the two-variable–containing peak P2 (triangles), and the three-variable–containing interaction peak P3 (squares). The TCI for P1 is not shown because it is equal to the KWII. The error bars represent SDs.
Effect of allele frequency
We systematically varied the allele frequency over the range 0.05–0.5 for the case study 2 model of GEI, to assess the impact of allele frequency on the KWII and TCI. The KWII and TCI spectra for varying frequencies of allele A1 of SNP 1 are summarized in figure 9A–9C and 9D–9F, respectively. The corresponding results for allele B1 of SNP 2 are summarized in figure 10A–10C and 10D–10F.
Figure 9. .

Dependence of KWII and TCI for case study 2 on the frequency allele A1 of SNP 1. A–C, KWII spectra for three representative allele A1 frequencies of 0.5, 0.75, and 0.95, respectively. D–F, TCI spectra for three representative SNP 1 allele A1 frequencies of 0.5, 0.75, and 0.95, respectively. The combinations used for KWII calculations are indicated on the Y-axes. Panels G and H vary the frequency of allele A1 of SNP 1 and allele B1 of SNP 2, respectively. The KWII (unblackened symbols) and TCI (blackened symbols) represent the one-variable–containing peak (circles), the two-variable–containing peak (triangles), and the three-variable-containing interaction peak (squares). The peaks used for panel G are marked “R1,” “R2,” and “R3” in panels A–F, whereas the peaks used in panel H are marked “S1,” “S2,” and “S3” in figure 10. The error bars represent SDs.
Figure 10. .

Dependence of KWII and TCI for case study 2 on the allele frequency of SNP 2. A–C, KWII spectra for three representative SNP 2 allele frequencies of 0.5, 0.75, and 0.95, respectively. D–F, TCI spectra for three representative SNP 2 allele frequencies of 0.5, 0.75, and 0.95, respectively. The combinations used for KWII calculations are indicated on the Y-axes. The error bars represent SDs.
Increases in the frequency of allele A1 of SNP 1 caused increases in the amplitude of its one-variable–containing peak R1, whereas the amplitudes of the two-variable– and three-variable–containing KWII peaks R2 and R3 decreased. The one-variable–containing peak R1 increases with increasing allele A1 frequency, because the uncertainty of obtaining a control phenotype is decreased. The two-variable– and three-variable–containing KWII peaks R2 and R3 decrease because of the increased redundancy when the frequency of allele A1 increases.
For SNP 2 (fig. 10), the corresponding one-variable–containing interaction peak S1 decreased with increasing frequency allele B1 of SNP 2. The differences in the KWII and TCI spectra in figures 9 and 10 can be attributed to the fact that allele B1 of SNP 2 is directly associated with the disease phenotype, whereas allele A1 of SNP 1 is associated with the control phenotype. The one-variable–containing peak S1 decreases with increasing allele B1 frequency, because the uncertainty of obtaining a case or control phenotype given the (B1, B*) genotype is increased.
The qualitative differences in KWII spectra for SNP 1 and SNP 2 demonstrate that the effects of allele frequency on KWII are dependent on the structure of the interactions leading to the phenotype. However, despite these complexities, KWII spectra can be interpreted if the effects of allele frequency on the information redundancy vis-a-vis information synergy are incorporated. In contrast to the KWII spectra, which were sensitive to allele frequency, the R2 and R3 peaks (see fig. 9D–9G) and S2 and S3 peaks (see figs. 9H and 10D–10F) of the TCI spectra were relatively robust, suggesting that the TCI could enable more effective identification of the two-variable and three-variable interactions in the face of allele-frequency variations.
Effect of linkage disequilibrium (LD) between SNPs
LD, which refers to the nonrandom associations of alleles at two or more loci, was investigated because it can potentially introduce redundancies between genetic variables associated with disease status. The LD between SNP 1 and SNP 2 was varied over R2 values ranging from 0 to 0.99 for the model in case study 2. All other parameters, including allele frequency, were kept constant. The KWII spectra for R2 values of 0, 0.5, and 0.95 are shown in figure 11A–11C, and the summary of the TCI and KWII for representative one-SNP–, two-SNP–, and three-SNP–containing peaks is shown in figure 11D. The KWII for one-SNP–containing peaks (T1) and the two-variable–containing peaks comprising SNP 1 and SNP 2 individually were positive and increased with increasing LD. However, the two-variable– and three-variable–containing peaks with both SNP 1 and SNP 2 changed sign and became negative with increasing LD because of the increased redundancy between the SNP variables caused by increased LD. The effects of LD on the KWII spectrum were thus dependent on the combinations examined, but the interpretation was consistent with positive and negative KWII, indicating synergy and redundancy, respectively. The effects of LD on the TCI spectrum (data not shown) were analogous, except that peak-height increases (decreases) were observed when comparing the combinations in which the corresponding KWII spectrum indicated increased synergy (redundancy).
Figure 11. .

Dependence of KWII for case study 2 on the LD R2 between SNP 1 and SNP 2. A–C, KWII spectra for three representative R2 values of 0, 0.5, and 0.95, respectively. The combinations used for KWII calculations are indicated on the Y-axes. The error bars represent SDs that are due to sampling and were obtained from 100 random samples. D, Dependence of KWII (unblackened symbols) and TCI (blackened symbols) for the one-variable–containing peak T1 (circles), the two-variable–containing peak T2 (triangles), and the three-variable–containing interaction peak T3 (squares). The error bars represent SDs.
Effect of locus heterogeneity
Locus heterogeneity refers to the situation wherein two or more independent genetic loci are capable of producing the same phenotype. For example, mutations in amyloid precursor protein (APP) and the presenilin-1 (PSEN1) loci can result in hereditary forms of Alzheimer disease. Locus heterogeneity causes confounding of the study results with differing GEI factors.
For the numerical experiments of the effects of locus heterogeneity, we generated two sets of cases, using the model in case study 2. One set of cases was generated via interactions among the environmental variables E, SNP 1, and SNP 2 (locus 1), whereas the other set of cases were generated via analogous interactions among the environmental variables E, SNP 3, and SNP 4 (locus 2). The two sets were mixed in different proportions. Controls were assumed to occur if the environmental and genotype variable combinations did not meet either of the case-generating rules.
The KWII spectrum for locus 1 is shown in figure 12A, whereas the KWII spectrum for locus 2 is in figure 12C. Representative one-variable– {U1, V1}, two-variable– {U2, V2}, and three-variable–containing {U3, V3} peaks characteristic of locus 1 and locus 2 are highlighted. When the locus 1 fraction increases, the characteristic peaks U1, U2, and U3 increase. Interestingly, the {E, 1, 2, 3, 4, 5, C} combination has the highest negative value (fig. 12E) when the proportion of samples from the locus 1 is in the range 40%–60%, suggesting that locus heterogeneity may be detected from the KWII spectrum because it generates redundancy.
Figure 12. .

Dependence of KWII on locus heterogeneity. B, 50%-50% mixture of cases generated via interactions between the environmental variable E and SNPs 1 and 2 (locus 1 in panel A) and cases generated via interactions between the environmental variable E and SNPs 3 and 4 (locus 2 in panel C). The model in case study 2 was used. The combinations used for KWII calculations are indicated on the Y-axes. The error bars represent SDs that are due to sampling and were obtained from 100 random samples. Representative one-variable– (U1, V1), two-variable– (U2, V2), and three-variable–containing (U3, V3) peaks characteristic of locus 1 and locus 2 are highlighted. D, Dependence of KWII (unblackened symbols) and TCI (blackened symbols) for the one-variable-containing peak U1 (circles), the two-variable–containing peak U2 (triangles), and the three-variable–containing interaction peak U3 (squares) on locus heterogeneity, as assessed by the fraction of cases that are due to locus 1. E, KWII values of the {E, 1, 2, 3, 4, 5, C} combination. The error bars represent SDs.
Effect of uninformative SNPs
High-throughput genotyping methods provide data on both informative and uninformative SNPs; for this reason, we investigated the dependence of KWII and TCI spectra on the number of uninformative SNPs. The number of uninformative SNPs for the data in case study 2 was increased to 4, 8, 32, and 64. As anticipated, the number of combinations in the KWII and TCI spectra increases rapidly when the number of uninformative SNPs is increased. However, the underlying information and amplitudes of the spectral peaks containing informative SNPs are independent of the number of uninformative SNPs (data not shown).
Dependence of KWII and TCI on Relative Risk
The dependence of KWII and TCI of characteristic peaks from each of the case studies on relative risk was analyzed. Figure 13 shows the dependence of KWII and TCI on relative risk, which was varied over a wide range for the models in each case study. In figure 13A, the KWII for the one-variable–containing {1, C} and {2, C} combinations is shown: the KWII curves for both combinations increased with relative risk, and the KWII value for the {1, C} combination was consistently higher than that for the {2, C} combination. In figure 13B, the KWII and TCI of three representative combinations—the one-variable–containing {E, C} (peak P1 in fig. 3B), the two-variable–containing {E, 1, C} (peak P2 in fig. 3B), and the three-variable–containing {E, 1, 2, C} (peak P3 in fig. 3B) combinations—were investigated. The one-variable–, two-variable–, and three-variable–containing TCI and KWII curves increased with increasing relative risk. The TCI curves were visually “parallel” to each other, reflecting the stepwise increases that are observed in the TCI spectrum when informative variables are added to the combination. Figure 13C shows that TCI and KWII of the three-variable–containing {E, 1, 2, C} combination (peak Q3 in fig. 4B) increased with increasing relative risk and that the two metrics were parallel to each other. Figure 13D presents the KWII results for one-variable–containing {1, C} and {E1, C} and the two-variable–containing {1, 2, C} combinations, which correspond to peaks M1, M2, and M3 in figure 5. Although the magnitude of the KWII values decreased with decreasing risk, the {1, C} combination had higher KWII values than did the {E1, C} and {1, 2, C} combinations across the range of relative-risk values examined. Each of the three combinations maintained its rank relative to the other combinations across the range as well.
Figure 13. .

A–E, Dependence of KWII and TCI on relative risk for case studies 1–5, respectively. A, KWII for the one-SNP–containing combinations of 1C (unblackened circles) and 2C (blackened circles) for case study 1. B, Results for the one-variable–containing {E, C} combination (unblackened circles) (peak P1 in fig. 3B), the two-variable–containing {E, 1, C} combination (peak P2 in fig. 3B) (KWII represented by unblackened triangles; TCI represented by blackened triangles), and the three-variable–containing {E, 1, 2, C} combination (peak P3 in fig. 3B) (KWII represented by unblackened squares; TCI represented by blackened squares) of case study 2. C, KWII (unblackened squares) and TCI (blackened squares) results for the three-variable–containing {E, 1, 2, C} combination (peak Q3 in fig. 4B). D, KWII results for the one-variable–containing {E1, C} (peak M1 in fig. 5B) (unblackened circles) and {1, C} (peak M2 in fig. 5B) (blackened circles) combinations and the KWII (unblackened triangles) and TCI (blackened triangles) for the two-variable–containing {1, 2, C} combination (peak M3 in fig. 5B) of case study 4. E, KWII results for the one-variable–containing {E1, C} (peak N1 in fig. 6B) (unblackened circles) and {1, C} combinations (peak N2 in fig. 6B) (blackened circles) and the KWII (unblackened triangles) and TCI (blackened triangles) for the two-variable–containing {1, 2, C} combination (peak N3 in fig. 6B) of case study 5. The error bars represent SDs that are due to sampling and were obtained from 100 samples. The TCI for one-variable–containing combinations is not shown because it is equal to the KWII. The error bars represent SDs.
Taken together, these results indicate that relative risk alters the magnitudes of the individual peaks in the KWII and TCI spectra. However, for a given relative-risk value, the relative magnitudes of the peaks are generally preserved in the informative combinations examined. This suggests that the KWII and TCI could be useful for assessing the underlying structure of the interactions among the genes and environmental variables.
Dependence of Power on Relative Risk
The model of case study 2 was used because it provides one-variable–, two-variable–, and three-variable–containing interactions. The power calculations (fig. 14) indicated that the KWII had an excellent power: at a sample size of 1,000 (500 controls and 500 cases), the power to detect the one-variable–containing peak P1 is near perfect for a twofold increase in relative risk. The power for the one-variable–containing peak was greater than that for the two-variable–containing peak P2 and for the three-variable–containing peak P3. For a twofold increase in relative risk, the power to detect the two-variable–containing peak was 0.5, but the power increased to >0.8, given a relative risk of 3. The power for detecting the three-variable–containing peak for a relative risk of 3 was 0.27, and this increased to 0.8 at a relative risk of ∼5.5.
Figure 14. .

Dependence of power on relative risk for case study 2. The power calculations were conducted for a sample size of 1,000 (500 case patients and 500 control individuals). These are results for the one-variable–containing {E, C} combination (peak P1 in fig. 3B) (circles), the two-variable–containing {E, 1, C} combination (peak P2 in fig. 3B) (triangles), and the three-variable containing {E, 1, 2, C} combination (peak P3 in fig. 3B) (squares).
Application to Analysis of Interactions in Chromosome 5
In the next step, we assessed the effectiveness of the KWII and TCI spectra at replicating results from previously reported studies and the method's potential for identifying key GGIs in epidemiological studies, using the Crohn disease data set from Daly et al.16 for 103 SNPs in the chromosome 5q31 region.17,18
The KWII and TCI values for all possible combinations containing four or fewer SNPs and the Crohn disease phenotype were computed. The data set of Daly et al.16 contains haplotype-phase information, but we did not include it in our analysis because most epidemiologic studies of GEIs do not have haplotype-phase information available.
Figure 15 summarizes the KWII and TCI spectra for the top 20 combinations with the highest values of KWII from each of the combinatorial sets containing one, two, or three SNPs and the disease phenotype. To assess the performance of the KWII and TCI spectra, we compared the results from our analysis with those obtained by Rioux et al.17 Those authors found 11 SNPs (IGR2055a_1, IGR2060a_1, IGR2063b_1, IGR2078a_1, IGR2096a_1, IGR2198a_1, IGR2230a_1, IGR2277a_1, IGR3081a_1, IGR3096a_1, and IGR3236a_1) with alleles that were associated with risk of Crohn disease. Nine of 11 significant SNPs were present in the data set we analyzed; SNPs IGR2078a_1 and IGR2277a_1 were missing.
Figure 15. .

A and B, KWII and TCI values for the top 20 one-SNP, two-SNP, and three-SNP combinations with the highest KWII values for the Crohn disease phenotype in the data set of Daly et al.16 All combinations involving three or fewer SNPs were computed, and each set was sorted by KWII. The combinations are indicated on the Y-axes, and SNPs identified by Rioux et al.17 as being significantly associated are labeled.
From the analysis of the one-SNP and disease phenotype KWII spectra in figure 15, we were able to identify eight of the nine reported associated SNPs present in our data set, by examination of the 20 combinations with the highest KWII values. We were unable to identify one SNP, IGR2230a_1.
Next, we analyzed the KWII spectra of the two-SNP combinations and the disease phenotype. We observed that SNP 7, in particular, participated in multiple two-SNP (and three-SNP) interactions with the Crohn disease phenotype, which had not been reported by Rioux et al.17 To assess these potentially novel interactions, we examined the two-SNP combinations that were present in the top five combinations for KWII or TCI values—{7, 36} and {61, 93} (these are equivalent to the identifiers {IGR1219a_2, IGR2150a_1} and {IGR3022a_1, IGR3236a_1} used by Daly et al.16—using a contingency table and the χ2 test. The contingency table in table 1 demonstrates that C/C, C/C genotypes at SNPs 7 and 36, respectively, are present in 61.3% of cases compared with 50.7% of controls. In contrast, the C/T, C/C genotype is present in 8.9% of cases compared with 13.6% of controls. For SNPs 61 and 93, the A/A, T/T genotype was present in 30.7% of cases and 15.3% of controls; the T/T, G/G genotype was present in 3.5% of cases and 11.5% of controls (summarized in table 1). The associations between SNP combinations {7, 36} and {61, 93} and Crohn disease were both significant by the χ2 test (χ2=19.7, P=.01, and χ2=24.4, P=.001, respectively). These findings indicate that our KWII- and TCI-based visualization approaches can be useful in identifying GGIs and GEIs in epidemiological studies. On the basis of these results, the performance of the KWII spectrum can be considered promising, particularly given that the KWII approach in its current form does not utilize the parent-child transmission information contained in the pedigree structures.
Table 1. .
Contingency Table for the Two-SNP Combinations and Crohn Disease Phenotype
| Percentage of Subjectswith Disease Phenotype |
||
| SNP Combination and Genotypes |
Control | Case |
| {7, 36}: | ||
| C/C and C/C | 50.7 | 61.3 |
| C/C and G/G | .9 | .0 |
| C/C and C/G | 14.9 | 12.1 |
| T/T and C/C | .5 | 2.4 |
| T/T and G/G | .0 | 1.6 |
| T/T and C/G | 3.6 | .0 |
| C/T and C/C | 13.6 | 8.9 |
| C/T and G/G | .0 | 1.6 |
| C/T and C/G | 15.8 | 12.1 |
| {61, 93}: | ||
| A/A and G/G | 4.4 | 3.5 |
| A/A and T/T | 15.3 | 30.7 |
| A/A and G/T | 18.6 | 16.7 |
| T/T and G/G | 11.5 | 3.5 |
| T/T and T/T | .0 | .0 |
| T/T and G/T | 1.1 | 7.9 |
| A/T and G/G | 9.8 | 7.0 |
| A/T and T/T | 3.8 | 3.5 |
| A/T and G/T | 35.5 | 27.2 |
Comparison with Other Competing Approaches
We compared our KWII approach with the relevance chain–based InfoGeneMap approach of Dawy et al.,19 the MDR technique,20–23 and the PDT.24 All three methods were compared head to head on the SNP data set from Daly et al.16 that was discussed in the “Application to Analysis of Interactions in Chromosome 5” section.
InfoGeneMap method
Figure 16A presents the KWII values for the top 20 combinations identified by our method and those identified by the InfoGeneMap method. The black bars highlight the three one-SNP combinations and the four two-SNP combinations that were identified by both methods. We found that the KWII values of the combinations identified by our method were greater than those from InfoGeneMap, which indicates that our approach detects stronger interactions. Figure 16B presents the InfoGeneMap criterion values for the top 20 combinations identified by our method with use of the KWII and those identified with use of the InfoGeneMap method. The black bars highlight the four one-SNP combinations and the four two-SNP combinations that were identified by both methods; the combination with the highest value of the InfoGeneMap criterion also had high values of KWII. Furthermore, all the combinations identified by our method had InfoGeneMap criterion values that were comparable to those from InfoGeneMap. Interestingly, only one (IGR2060a_1) of the nine SNPs identified by Rioux et al.17 as significantly associated with Crohn disease was present among the one-SNP combinations identified by InfoGeneMap; as noted earlier, our approach found eight of these nine SNPs in one-SNP combinations.
Figure 16. .

A and B, Comparison of the performance of the InfoGeneMap and our method with use of KWII and InfoGeneMap criterion metric of InfoGeneMap method, respectively. The top 20 one-SNP and two-SNP combinations and the Crohn disease phenotype are shown in each plot value for the Crohn disease phenotype in the data set of Daly et al.16 The black bars represent combinations identified by both methods, the gray bars are combinations identified by the KWII method alone, and the white bars are combinations identified by the InfoGeneMap method only. The combinations are indicated on the Y-axes.
MDR method
The MDR method identifies {28}, {28, 91}, {28, 39, 73}, and {28, 39, 73, 101} as significant combinations associated with the Crohn disease phenotype (these combinations are equivalent to the sets {IGR2063b_1}, {IGR2063b_1, IGRX100a_1}, {IGR2063b_1, IGR2198a_1, IGR3066a_1}, and {IGR2063b_1, IGR2198a_1 IGR3066a_1, GENS0202ex3_2} in the notation used by Daly et al.16). The model containing only SNP 28 was identified as the best model, with a training accuracy of 0.64 and a testing accuracy of 0.61. The MDR approach combination sets contained only two (IGR2063b_1 and IGR2198a_1) of the nine SNPs identified by Rioux et al.17 as being significantly associated with the Crohn disease phenotype.
The best MDR model, SNP 28, was also identified as the single-SNP combination with the highest KWII by our method. SNPs 91 and 39 also were identified among the top 20 single-SNP combinations by our method. We found that the two-SNP combination {28, 91} identified by MDR had negative KWII values, indicating the presence of redundancy.
PDT method
Given the concordance with the results of Rioux et al.17 and the two-SNP χ2 analyses, we compared the results of the one- and two-SNP–containing KWII spectra with those of the one-SNP and two-SNP haplotype PDT analysis. With Benjamini and Hochberg corrections for multiple comparisons, the PDT single-SNP analysis identified 19 SNPs associated with Crohn disease (table 2).32 The PDT identified all nine SNPs found to be associated with Crohn disease by Rioux et al.17 Three of the 19 SNPs were excluded in the KWII and TCI analysis, because genotypes were missing for >20% of the subjects. Among the 16 SNPs included, 11 were present in the list of 20 single SNPs with the highest KWII values.
Table 2. .
Summary of Statistically Significant Single-SNP Results from the PDT[Note]
| SNP | Nucleotide Position |
SNP Name | Genotype | GRRa (95% CI) | Z | Pb |
| 16 | 411873 | IGR2008a_1 | C/C | 2.15 (1.26–3.67) | 2.82 | .0047 |
| 26* | 435282 | IGR2055a_1 | G/G | 2.14 (1.30–3.53) | 3.00 | .0027 |
| 27* | 437682 | IGR2060a_1 | C/C | 2.19 (1.31–3.65) | 2.99 | .0028 |
| 28* | 438883 | IGR2063b_1 | G/G | 2.21 (1.34–3.64) | 3.11 | .0019 |
| 34* | 455246 | IGR2096a_1 | C/C | .35 (.17–.72) | −2.88 | .0039 |
| 39* | 506266 | IGR2198a_1 | G/G | 2.32 (1.44–3.75) | 3.46 | .00055 |
| 49 | 522600 | IGR2230a_1 | T/T | 2.40 (1.35–4.28) | 2.96 | .003 |
| 56 | 571022 | IGR3005a_2 | G/G | 1.99 (1.25–3.15) | 2.92 | .0035 |
| 57 | 576586 | IGR3016a_1 | G/G | 2.36 (1.36–4.09) | 3.04 | .0023 |
| 65* | 582948 | IGR3029a_2 | G/G | 2.25 (1.40–3.61) | 3.37 | .00076 |
| 67* | 587836 | IGR3039a_1 | A/A | 1.92 (1.21–3.06) | 2.76 | .0058 |
| 74* | 608759 | IGR3081a_1 | T/T | .36 (.17–.74) | −2.79 | .0053 |
| 78* | 616241 | IGR3096a_1 | T/T | .34 (.16–.73) | −2.80 | .0052 |
| 86 | 649061 | IGR3162a_1 | G/G | .21 (.06–.72) | −2.48 | .013 |
| 90 | 662819 | IGR3189a_2 | T/T | .29 (.12–.72) | −2.68 | .0073 |
| 91* | 676688 | IGRX100a_1 | A/A | 1.97 (1.17–3.32) | 2.55 | .011 |
| 92 | 683387 | IGR3230a_1 | T/T | .37 (.17–.78) | −2.60 | .0094 |
| 93* | 686249 | IGR3236a_1 | G/G | .39 (.21–.75) | −2.83 | .0046 |
| 102* | 877809 | GENS020ex3_1 | C/C | .42 (.24–.73) | −3.05 | .0023 |
Note.— SNPs identified by Rioux et al.17 are shown in bold, and SNPs identified by the KWII are identified by an asterisk (*).
Genotype relative risk, in which the reference genotype is the heterozygote.
All P values are significant after correction for multiple testing with use of the method of Benjamini and Hochberg.32
All 20 two-SNP–containing results presented in figure 15 were analyzed for evidence of significant association with use of haplotype analysis in UNPHASED. The analysis results and corresponding relative-risk values are summarized in table 3. Sixteen of the 20 KWII two-SNP–containing combinations were found significant at P<.05. Of these 16 two-SNP haplotypes, 10 had P values between .01 and .05, 4 had P values between .001 and .01, and 2 showed significance at the P<.001 level.
Table 3. .
PDT Results for the Two-SNP–Containing Combinations Identified by the KWII Analysis
| Frequency |
|||||
| {SNP 1, SNP 2} | Risk Haplotypes (Reference) | Case | Control | Relative Risk (95% CI) | GlobalP |
| {7, 36} | T/C (C/C) | .06 | .13 | .42 (.20–.85) | .03 |
| {7, 40} | NS | ||||
| {7, 46} | C/T (C/C) | .15 | .21 | .59 (.34–.98) | .01 |
| {7, 46} | T/T (C/C) | .07 | .15 | .42 (.19–.87) | .01 |
| {7, 51} | C/T (C/C) | .17 | .22 | .65 (.39–1.00) | .04 |
| {7, 52} | C/T (C/C) | .71 | .57 | 1.12 (1.00–1.33) | .01 |
| {7, 56} | C/G (C/C) | .61 | .43 | 1.35 (1.06–1.62) | .003 |
| {7, 72} | T/C (C/C) | .06 | .15 | .43 (.10–1.01) | .03 |
| {30, 80} | C/T (C/A) | .77 | .58 | 1.31 (1.05–1.49) | .002 |
| {32, 43} | NS | ||||
| {33, 43} | A/G (G/G) | .22 | .33 | .66 (.46–.94) | .04 |
| {47, 95} | C/G (C/C) | .33 | .42 | .73 (.42–.99) | .009 |
| {57, 92} | A/T (G/G) | .24 | .39 | .48 (.25–.82) | .004 |
| {48, 92} | C/T (C/G) | .38 | .54 | .61 (.39–.88) | .0003 |
| {61, 90} | T/T (A/C) | .27 | .36 | .69 (.43–1.01) | .06 |
| {61, 93} | T/T (T/G) | .26 | .43 | .37 (.05–.99) | .004 |
| {61, 95} | NS | ||||
| {68, 95} | T/C (C/C) | .005 | .04 | .12 (.01–.98) | .03 |
| {76, 95} | NS | ||||
| {78, 81} | C/T (T/T) | .55 | .39 | 1.35 (.99–1.65) | .0006 |
| {90, 103} | C/G (T/G) | .27 | .35 | .72 (.50–1.00) | .04 |
These comparisons indicate that our KWII-based approach identifies SNPs that are also identified by other methods. However, the SNP combinations that were identified by our method are more parsimonious than those identified by the other two methods.
Discussion
In this report, we have presented results on an information-theoretic approach for GEI visualization that uses two complementary information-theoretic metrics: the KWII and the TCI. The salient contributions of this work include (i) the systematic analysis of the dependence of information-theoretic metrics on genetic and study-design factors, (ii) the identification of heuristics that enable interpretation of GEI from the KWII and TCI metrics, and (iii) the visual presentation of the results as KWII and TCI “spectra,” which are ordered graphical representations of the KWII and TCI versus the environmental variable and genotype combinations that can be used to highlight and identify the GEI. The methods for interpreting the KWII and TCI spectra were developed with controlled numerical experiments and analysis of data from a genetic study of Crohn disease.
The results from our systematic numerical experiments, which, to our knowledge, have not been previously reported, provide rules and heuristics that are critically needed if researchers interested in interpretation of large data sets that include information on genotype and exposures are to interpret complex patterns observed in KWII and TCI spectra. The information among a set of variables involved in GEI could be distributed throughout the variables in complicated ways; for example, there may be complete interredundancy among some variables, whereas others may be independent. Furthermore, there may be interactions of various degrees; for example, a group of variables without pairwise redundancies could have higher-order interactions. The KWII and TCI were found to identify interactions generated by a diverse range of interaction models. The findings also have implications for GEI study design. For example, our experiments depicted in figure 7 highlighted the deleterious effects of misassignment of case status on the ability of the KWII and TCI to detect interactions.
The widely used MDR technique is an analysis rather than a visualization strategy. It can be computationally intensive, especially when >10 polymorphisms need to be evaluated.20 Information-theoretic methods, however, are among the most-promising approaches for enhancing SNP analysis, GGI and GEI analysis, and visualization.33,9,8,25 Although information-theoretic approaches have well-developed theory and are versatile and genetic-model independent, only limited research on leveraging these strengths into analytical visualization strategies has been done. The KWII presented here is the KLD between the joint probability density and the model constructed using all pairwise dependences.15 The TCI is the KLD between the joint probability density p(X1, X2 ,…, Xn) and its maximum entropy product approximation p(X1)p(X2)…p(Xn). Because of these direct relationships to the KLD, the KWII and TCI can, with practice, be easily interpreted for GEI, with use of the versatile KLD-based framework we developed in VizStruct. A key advantage of using KWII to identify interactions is the parsimony obtained because the higher-order combinations are free of the confounding effects from lower-order interactions.
In this work, we have built on and extended the work of Jakulin and Bratko10,15,34,35 to GEI. The visualization approaches proposed by Jakulin and Bratko10,15,34,35 include information graphs and interaction dendrograms. In information graphs, each node represents a variable. The node also includes the percentage of the entropy of the class variable eliminated by the variable. An edge connecting two nodes can be a unidirectional arc representing negative interaction between the two nodes and the class variable (redundancy) or a bidirectional arrow representing positive interaction between the two nodes and the class variable (synergy). Interaction dendrograms are obtained by hierarchical clustering on a distance matrix derived from the magnitude of the interaction information. The dendrogram line length represents the interaction strength, and its color indicates whether the interaction is synergistic, redundant, or independent.25 Recently, Moore incorporated interaction dendrograms into MDR.25 These tools have been used to study the effects of SNP genotypes and smoking on bladder cancer risk.36
Good interactive, multidimensional visualization tools can provide additional perspectives that assist the user in understanding large, multidimensional, GEI data at an intuitive level, facilitate subsequent hypothesis generation, and enhance knowledge discovery. Our results indicate that KWII and TCI are promising candidates as visualization metrics in GEI research.
Acknowledgments
This work was partly supported by the National Science Foundation and the National Institutes of Health. Support from National Multiple Sclerosis Society grant RG3743 is also gratefully acknowledged.
Web Resources
The URLs for data presented herein are as follows:
- CSEBiORG, http://www.cse.buffalo.edu/DBGROUP/bioinformatics/resources.html (for the software program for KWII and TCI)
- High-Resolution Haplotype Structure in the Human Genome, http://www.broad.mit.edu/humgen/IBD5/haplodata.html (for the chromosome 5 data set) [DOI] [PubMed]
- InfoGeneMap, http://www.lnt.ei.tum.de/download/InfoGeneMap/
- Online Mendelian Inheritance in Man (OMIM), http://www.ncbi.nlm.nih.gov/Omim/ (for Crohn disease)
- SourceForge, http://sourceforge.net/projects/mdr/ (for MDR)
References
- 1.McPherson JD, Marra M, Hillier L, Waterston RH, Chinwalla A, Wallis J, Sekhon M, Wylie K, Mardis ER, Wilson RK, et al (2001) A physical map of the human genome. Nature 409:934–941 10.1038/35057157 [DOI] [PubMed] [Google Scholar]
- 2.Olivier M, Aggarwal A, Allen J, Almendras AA, Bajorek ES, Beasley EM, Brady SD, Bushard JM, Bustos VI, Chu A, et al (2001) A high-resolution radiation hybrid map of the human genome draft sequence. Science 291:1298–1302 10.1126/science.1057437 [DOI] [PubMed] [Google Scholar]
- 3.Sachidanandam R, Weissman D, Schmidt SC, Kakol JM, Stein LD, Marth G, Sherry S, Mullikin JC, Mortimore BJ, Willey DL, et al (2001) A map of human genome sequence variation containing 1.42 million single nucleotide polymorphisms. Nature 409:928–933 10.1038/35057149 [DOI] [PubMed] [Google Scholar]
- 4.Venter JC, Adams MD, Myers EW, Li PW, Mural RJ, Sutton GG, Smith HO, Yandell M, Evans CA, Holt RA, et al (2001) The sequence of the human genome. Science 291:1304–1351 10.1126/science.1058040 [DOI] [PubMed] [Google Scholar]
- 5.Altshuler D, Brooks LD, Chakravarti A, Collins FS, Daly MJ, Donnelly P (2005) A haplotype map of the human genome. Nature 437:1299–1320 10.1038/nature04226 [DOI] [PMC free article] [PubMed] [Google Scholar]
- 6.Ambrosone CB, Shields PG, Freudenheim JL, Hong CC (2007) Re: commonly studied single-nucleotide polymorphisms and breast cancer: results from the Breast Cancer Association Consortium. J Natl Cancer Inst 99:487 [DOI] [PubMed] [Google Scholar]
- 7.Zhang L, Zhang A, Ramanathan M (2004) VizStruct: exploratory visualization for gene expression profiling. Bioinformatics 20:85–92 10.1093/bioinformatics/btg377 [DOI] [PMC free article] [PubMed] [Google Scholar]
- 8.Bhasi K, Zhang L, Brazeau D, Zhang A, Ramanathan M (2006) VizStruct for visualization of genome-wide SNP analyses. Bioinformatics 22:1569–1576 10.1093/bioinformatics/btl144 [DOI] [PubMed] [Google Scholar]
- 9.Bhasi K, Zhang L, Brazeau D, Zhang A, Ramanathan M (2006) Information-theoretic identification of predictive SNPs and supervised visualization of genome-wide association studies. Nucleic Acids Res 34:e101 10.1093/nar/gkl520 [DOI] [PMC free article] [PubMed] [Google Scholar]
- 10.Jakulin A (2005) Machine learning based on attribute interactions. University of Ljubljana, Ljubljana, Slovenia [Google Scholar]
- 11.Watanabe S (1960) Information theoretical analysis of multivariate correlation. IBM J Res Dev 4:66–82 [Google Scholar]
- 12.Bell AJ (2003) Co-information lattice. Paper presented at the Fourth International Symposium on Independent Component Analysis and Blind Source Separation, Nara, Japan, April [Google Scholar]
- 13.McGill WJ (1954) Multivariate information transmission. Psychometrika 19:97–116 10.1007/BF02289159 [DOI] [Google Scholar]
- 14.Fano RM (1961) Transmission of information: a statistical theory of communications. MIT Press, Cambridge, MA [Google Scholar]
- 15.Jakulin A, Bratko I (2004) Testing the significance of attribute interactions. Paper presented at Proceedings of the 21st International Conference on Machine Learning (ICML-2004). Banff, Canada, July 4–8 [Google Scholar]
- 16.Daly MJ, Rioux JD, Schaffner SF, Hudson TJ, Lander ES (2001) High-resolution haplotype structure in the human genome. Nat Genet 29:229–232 10.1038/ng1001-229 [DOI] [PubMed] [Google Scholar]
- 17.Rioux JD, Daly MJ, Silverberg MS, Lindblad K, Steinhart H, Cohen Z, Delmonte T, Kocher K, Miller K, Guschwan S, et al (2001) Genetic variation in the 5q31 cytokine gene cluster confers susceptibility to Crohn disease. Nat Genet 29:223–228 10.1038/ng1001-223 [DOI] [PubMed] [Google Scholar]
- 18.Onnie C, Fisher SA, King K, Mirza M, Roberts R, Forbes A, Sanderson J, Lewis CM, Mathew CG (2006) Sequence variation, linkage disequilibrium and association with Crohn’s disease on chromosome 5q31. Genes Immun 7:359–365 10.1038/sj.gene.6364307 [DOI] [PubMed] [Google Scholar]
- 19.Dawy Z, Goebel B, Hagenauer J, Andreoli C, Meitinger T, Mueller JC (2006) Gene mapping and marker clustering using Shannon’s mutual information. IEEE/ACM Trans Comput Biol Bioinform 3:47–56 [DOI] [PubMed] [Google Scholar]
- 20.Ritchie MD, Hahn LW, Roodi N, Bailey LR, Dupont WD, Parl FF, Moore JH (2001) Multifactor-dimensionality reduction reveals high-order interactions among estrogen-metabolism genes in sporadic breast cancer. Am J Hum Genet 69:138–147 [DOI] [PMC free article] [PubMed] [Google Scholar]
- 21.Hahn LW, Ritchie MD, Moore JH (2003) Multifactor dimensionality reduction software for detecting gene-gene and gene-environment interactions. Bioinformatics 19:376–382 10.1093/bioinformatics/btf869 [DOI] [PubMed] [Google Scholar]
- 22.Ritchie MD, Hahn LW, Moore JH (2003) Power of multifactor dimensionality reduction for detecting gene-gene interactions in the presence of genotyping error, missing data, phenocopy, and genetic heterogeneity. Genet Epidemiol 24:150–157 10.1002/gepi.10218 [DOI] [PubMed] [Google Scholar]
- 23.Bush WS, Dudek SM, Ritchie MD (2006) Parallel multifactor dimensionality reduction: a tool for the large-scale analysis of gene-gene interactions. Bioinformatics 22:2173–2174 10.1093/bioinformatics/btl347 [DOI] [PMC free article] [PubMed] [Google Scholar]
- 24.Martin ER, Monks SA, Warren LL, Kaplan NL (2000) A test for linkage and association in general pedigrees: the pedigree disequilibrium test. Am J Hum Genet 67:146–154 [DOI] [PMC free article] [PubMed] [Google Scholar]
- 25.Moore JH, Gilbert JC, Tsai CT, Chiang FT, Holden T, Barney N, White BC (2006) A flexible computational framework for detecting, characterizing, and interpreting statistical patterns of epistasis in genetic studies of human disease susceptibility. J Theor Biol 241:252–261 10.1016/j.jtbi.2005.11.036 [DOI] [PubMed] [Google Scholar]
- 26.Cho YM, Ritchie MD, Moore JH, Park JY, Lee KU, Shin HD, Lee HK, Park KS (2004) Multifactor-dimensionality reduction shows a two-locus interaction associated with type 2 diabetes mellitus. Diabetologia 47:549–554 10.1007/s00125-003-1321-3 [DOI] [PubMed] [Google Scholar]
- 27.Tsai CT, Lai LP, Lin JL, Chiang FT, Hwang JJ, Ritchie MD, Moore JH, Hsu KL, Tseng CD, Liau CS, et al (2004) Renin-angiotensin system gene polymorphisms and atrial fibrillation. Circulation 109:1640–1646 10.1161/01.CIR.0000124487.36586.26 [DOI] [PubMed] [Google Scholar]
- 28.Ma DQ, Whitehead PL, Menold MM, Martin ER, Ashley-Koch AE, Mei H, Ritchie MD, Delong GR, Abramson RK, Wright HH, et al (2005) Identification of significant association and gene-gene interaction of GABA receptor subunit genes in autism. Am J Hum Genet 77:377–388 [DOI] [PMC free article] [PubMed] [Google Scholar]
- 29.Motsinger AA, Donahue BS, Brown NJ, Roden DM, Ritchie MD (2006) Risk factor interactions and genetic effects associated with post-operative atrial fibrillation. Pac Symp Biocomput 11:584–595 [PubMed] [Google Scholar]
- 30.Dudbridge F (2003) Pedigree disequilibrium tests for multilocus haplotypes. Genet Epidemiol 25:115–121 10.1002/gepi.10252 [DOI] [PubMed] [Google Scholar]
- 31.Zhang J, Yu KF (1998) What’s the relative risk? A method of correcting the odds ratio in cohort studies of common outcomes. JAMA 280:1690–1691 10.1001/jama.280.19.1690 [DOI] [PubMed] [Google Scholar]
- 32.Benjamini Y, Hochberg Y (1995) Controlling the false discovery rate: a practical and powerful approach to multiple testing. J Roy Stat Soc (Ser B) 57:289–300 [Google Scholar]
- 33.Liu Z, Lin S (2005) Multilocus LD measure and tagging SNP selection with generalized mutual information. Genet Epidemiol 29:353–364 10.1002/gepi.20092 [DOI] [PMC free article] [PubMed] [Google Scholar]
- 34.Jakulin A, Bratko I (2003) Analyzing attribute dependencies. Paper presented at Proceedings of the Seventh European Conference on Principles and Practice of Knowledge Discovery in Databases (PKDD 2003). Cavtat-Dubrovnik, Croatia, September 22–26 [Google Scholar]
- 35.Jakulin A, Bratko I, Smrke D, Demsar J, Zupan B (2003) Attribute interactions in medical data analysis. Paper presented at Proceedings of the Ninth Conference on Artificial Intelligence in Medicine in Europe (AIME 2003). Protaras, Cyprus, October 18–22 [Google Scholar]
- 36.Andrew AS, Nelson HH, Kelsey KT, Moore JH, Meng AC, Casella DP, Tosteson TD, Schned AR, Karagas MR (2006) Concordance of multiple analytical approaches demonstrates a complex relationship between DNA repair gene SNPs, smoking and bladder cancer susceptibility. Carcinogenesis 27:1030–1037 10.1093/carcin/bgi284 [DOI] [PubMed] [Google Scholar]