

Abstract
Switch I and II are key active site structural elements of kinesins, myosins, and G-proteins. Our analysis of a switch I mutant (R210A) in Drosophila melanogaster kinesin showed a reduction in microtubule affinity, a loss in cooperativity between the motor domains, and an ATP hydrolysis defect leading to aberrant detachment from the microtubule. To investigate the conserved arginine in switch I further, a lysine substitution mutant was generated. The R210K dimeric motor has lost the ability to hydrolyze ATP; however, it has rescued microtubule function. Our results show that R210K has restored microtubule association kinetics, microtubule affinity, ADP release kinetics, and motor domain cooperativity. Moreover, the active site at head 1 is able to distinguish ATP, ADP, and AMP-PNP to signal head 2 to bind the microtubule and release mantADP with kinetics comparable with wild-type. Therefore, the structural pathway of communication from head 1 to head 2 is restored, and head 2 can respond to this signal by binding the microtubule and releasing mantADP. Structural modeling revealed that lysine could retain some of the hydrogen bonds made by arginine but not all, suggesting a structural hypothesis for the ability of lysine to rescue microtubule function in the Arg210 mutant.
The ATPase mechanism of kinesin requires that the active site hydrolyze ATP to ADP·Pi and communicate the nucleotide state at the active site to the microtubule to mediate specific conformational changes that generate movement. ATPase activity is stimulated by the microtubule filament (1); and therefore, there must also be communication from the microtubule to the active site. The three-dimensional structure of the active site can be organized into a variety of structural motifs that are common to kinesins, myosins, and G-proteins including the P loop (GXXXXGKS/T), switch I (NXXSSRSH), and switch II (DLAGXE) (2–7). Several recent reports have examined the roles of switch I and switch II in kinesins and myosins (8–24). These studies focused on the proposed role of switch I and switch II in positioning the water molecule that is critical for the hydrolysis of the phosphodiester bond of the γ-phosphate of ATP. The positioning of the water molecule is thought to be through a salt bridge between the conserved arginine in switch I and the conserved glutamic acid in switch II. Mutants in kinesins at either position exhibit dramatic reductions in the steady-state kcat which are attributed to the ATP hydrolysis defect (16, 25, 26).
The neck linker has been shown to specify plus-end directionality of kinesin (25, 27–30) as well as docking to the catalytic core near the microtubule binding face, loop 12, and switch II relay helix α4 (25, 31). These results suggest a role for communication between the nucleotide and microtubule binding sites. Bound to microtubules, the kinesin neck linker exhibits an ATP-promoted docking transition (25, 32–34); however, in the absence of microtubules the neck linker can exist in two states without nucleotide discrimination (35). Crystallization of kinesin with a docked neck linker suggests that the switch II cluster (downstream element of switch II not involved in nucleotide sensing) moves loop 11, and the flexibility in loop 11 permits switch II cluster movement that in turn allows neck linker docking without shifting the switch II nucleotide sensor. Microtubule binding may order loop 11, allowing for the coupled movement of the switch II cluster with the active site switch II element (35, 36).
We have recently explored the role of ATP hydrolysis for kinesin cooperativity (26). Using the Drosophila conventional kinesin construct K401-wt,1 a mutant was constructed where the conserved arginine of switch I (Arg210 in the Drosophila melanogaster sequence) was changed to an alanine. This mutant did not show a pre-steady-state burst of ADP·Pi product formation in acid quench experiments, indicative of a defect in ATP hydrolysis. The analysis also indicated that ATP hydrolysis was necessary for motor detachment. The experiments outlined a mechanism for kinesin in which ATP hydrolysis occurred after ADP release from the second head, consistent with other published reports (25, 37–39). The rate of ADP release from the second head of the Mt·R210A complex was similar using ATP, ADP, or AMP-PNP, whereas conventional wild-type kinesin shows discrimination among these different nucleotides in activating ADP release from the second head (37, 38, 40–43). The R210A mutant also exhibited a microtubule binding defect, in both pre-steady-state microtubule association experiments and equilibrium microtubule binding experiments.
To understand the role of the switch I arginine in greater detail, we examined the kinetics of an arginine to lysine mutation at position 210, referred to as R210K. The results presented here show that the R210K dimeric motor is defective in steady-state ATP turnover with a reduction in the kcat. There was also no pre-steady-state burst of product formation, indicative that replacement of the side chain geometry by the lysine is not sufficient to restore proper ATP hydrolysis. However, replacement with the lysine was able to restore microtubule affinity and the ability of mutant motor to discriminate among ATP, AMP-PNP, and ADP in mantADP release experiments from the second head. In addition, the rates at which mantADP release occurred were near wild-type levels. These data indicate that the mutant kinesin R210K can communicate the nucleotide state to the partner motor domain, and the partner motor domain can respond to the signal by binding the microtubule and releasing mantADP. Furthermore, the structural pathway for communication between the active site and the microtubule has been restored even though the ATP hydrolysis defect is not corrected. Through structural modeling we identified crystal structures of monomeric kinesin which represent an ATP-like structure and a true ADP structure. These structural differences are supported by our kinetic data. We hypothesize that the ability of lysine to rescue microtubule function is the result of its ability to maintain a key hydrogen bond in the ADP state and its inability to form critical hydrogen bonds in the ATP-like state.
EXPERIMENTAL PROCEDURES
Materials
Paclitaxel (Taxol, Taxus brevifolia) was purchased from Sigma. Polyethylenimine-cellulose TLC plates (EM Science of Merck, 20 × 20 cm, plastic-backed) were from VWR Scientific (West Chester, PA), and mantATP and mantADP were from Molecular Probes (Eugene, OR).
Buffer Conditions
The kinetic and equilibrium binding experiments were performed in ATPase buffer (20 mM Hepes pH 7.2 with KOH, 5 mM magnesium acetate, 0.1 mM EGTA, 0.1 mM EDTA, 50 mM potassium acetate, 1 mM dithiothreitol) at 25 °C. Concentrations (proteins, nucleotides, etc.) reported are final concentrations after mixing.
Expression and Purification of R210K Mutant Kinesin Motor
The construction of the R210K plasmid and the expression and the purification of the R210K mutant kinesin were performed as described previously (26). The K401-wt plasmid (44) was used to construct the R210K mutant kinesin by introducing a single amino acid change at position 210 using the Chameleon mutagenesis protocol (Stratagene, Inc., La Jolla, CA). DNA sequencing confirmed the arginine to lysine substitution. The conventional kinesin construct, K401, contains the first 401 amino acids of the D. melanogaster conventional kinesin heavy chain and produces a dimeric kinesin motor when expressed in Escherichia coli (45). The R210K plasmid was transformed into BL21(DE3)pLysS, expressed in E. coli, and purified as described previously (44, 46).
Determination of protein concentration of the purified R210K kinesin mutant motor was performed by the Bradford method using the Bio-Rad protein assay with IgG as a protein standard. Active site experiments were performed as described (26, 47, 48).
Microtubule Preparation
Microtubules were polymerized from bovine brain tubulin and stabilized with 20 μM Taxol as described previously (44). The Taxol-treated microtubules were stable as polymers as determined by sedimentation assays and SDS-PAGE analysis.
Steady-state ATPase Assays
ATPase measurements were performed by following the turnover of [α-32P]ATP to [α-32P]ADP·Pi as described previously (44, 47).
Equilibrium Binding to the Microtubule
These experiments were performed as described previously (26, 48–50). R210K at 2 μM was incubated with 0–7 μM microtubules in the absence of added nucleotides for 30 min and subjected to high speed centrifugation. The supernatant was removed, and the microtubule pellet was resuspended in ATPase buffer to the same volume as the supernatant. Laemmli sample buffer (5′) was added to samples of the supernatant and resuspended pellet, and the proteins were resolved by SDS-PAGE (8% acrylamide and 2 M urea). The gel was stained with Coomassie Blue and scanned by a Microtek Scan Maker X6EL scanner (Microtek, Redondo Beach, CA). The scanned image was quantified (NIH Image version 1.62) to determine the concentration of R210K in the supernatant and pellet at each microtubule concentration. Fig. 2 presents the data as fractional binding, which is defined as the ratio of R210K in the pellet to total R210K (2 μM), plotted as a function of microtubule concentration. The data were fit to quadratic Equation 1,
| (Eq. 1) |
where Mt·E/E0 is the fraction of R210K that sediments with the microtubules, E0 is total R210K concentration, Mt0 is the total tubulin concentration as microtubule polymer, and Kd is the dissociation constant.
Fig. 2. Equilibrium binding of R210K and microtubules.
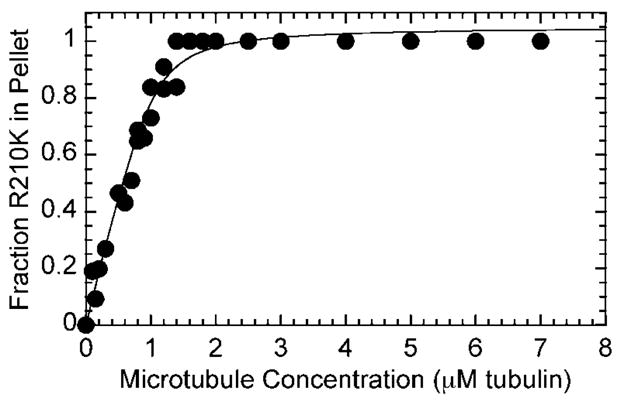
R210K (2 μM) was incubated with microtubules (0–7 μM tubulin, 20 μM Taxol) for 30 min, centrifuged to pellet the microtubules, and analyzed by SDS-PAGE. The fraction of R210K which partitioned to the pellet was plotted as a function of microtubule concentration. The fit of the data to Equation 2 provided the Kd,Mt = 75.4 ± 14.5 nM with maximal fractional binding at 1.05 ± 0.02.
Rapid Quench Experiments
R210A was noted to have an ATP hydrolysis defect (26). We performed similar experiments with R210K in comparison to wild-type K401 (51) to determine whether the two mutants shared the same ATP hydrolysis defect. The preformed Mt·R210K complex (syringe concentrations: 16 μM R210K, 30 μM microtubules, 40 μM Taxol) was mixed rapidly in a chemical quenched-flow instrument (RQF-3, Kintek Corp., Austin, TX) with 100 μM [α-32P]ATP (see Fig. 3). The reaction was terminated with 5 M formic acid (syringe concentration) and expelled from the instrument. The radiolabeled product (ADP·Pi) was separated from the radiolabeled reactant (ATP) by thin layer chromatography, and the data were quantified. The concentration of [α-32P]ADP was determined for each time point and plotted as a function of time (KaleidaGraph, Synergy Software, Reading, PA). The data were then fit to the burst equation,
| (Eq. 2) |
where A is the amplitude of the pre-steady-state burst phase which represents the formation of [α-32P]ADP·Pi at the active site during the first ATP turnover; kb is the rate constant of the exponential burst phase; t is time in seconds; and kss is the rate constant of the linear phase (μM ADP·s−1). The rate constant kss, when divided by enzyme concentration, corresponds to the rate of steady-state turnover at the same ATP and microtubule concentrations.
Fig. 3. Pre-steady-state kinetics of ATP hydrolysis for R210K and K401-wt.
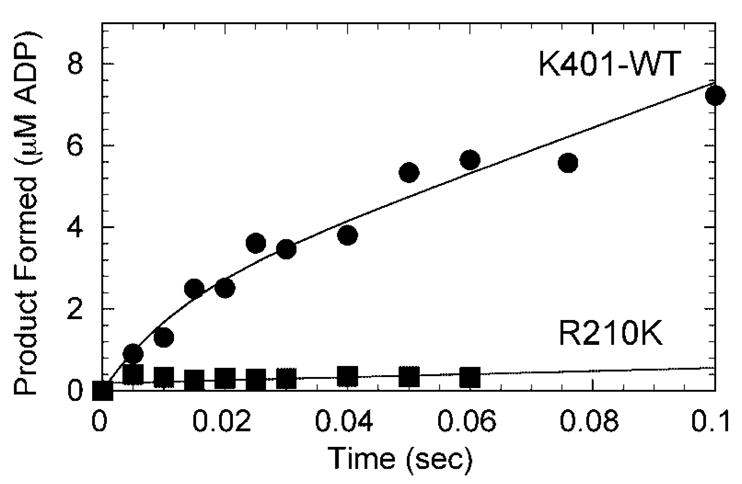
The Mt·kinesin complex (8 μM motor, 15 μM tubulin, 20 μM Taxol) was mixed rapidly with 100 μM [α-32P]ATP for 5–100 ms followed by a formic acid quench. The K401-wt data were fit to Equation 3: A = 2.0 ± 0.2 μM, kb = 81.4 ± 22.6 s−1, kss = 55.4 ± 2.0 μM·s−1/8 μM sites. The R210K data were fit to a linear function, which provided a rate constant of 0.12 ± 0.08 s−1.
Stopped-flow Kinetics
The pre-steady-state kinetics of mantATP binding, R210K binding to microtubules, ATP-promoted dissociation of R210K, and mantADP release were all conducted using the SF-2001 KinTek stopped-flow instrument in ATPase buffer at 25 °C. For the mantATP and mantADP experiments, the excitation wavelength was 360 nm (mercury arc lamp) with emitted light measured through a 400 nm cutoff filter (mant λemm = 450 nm). The mantATP binding data in the inset of Fig. 4A were fit Equation 3,
| (Eq. 3) |
where kobs is the rate of the initial exponential increase in fluorescence, k1 is the second-order rate constant for mantATP binding (see Scheme 1), and koff obtained from the y intercept is the rate of mantATP dissociation from the Mt·R210K·mantATP complex.
Fig. 4. Pre-steady-state kinetics of mantATP binding to the Mt·R210K complex.
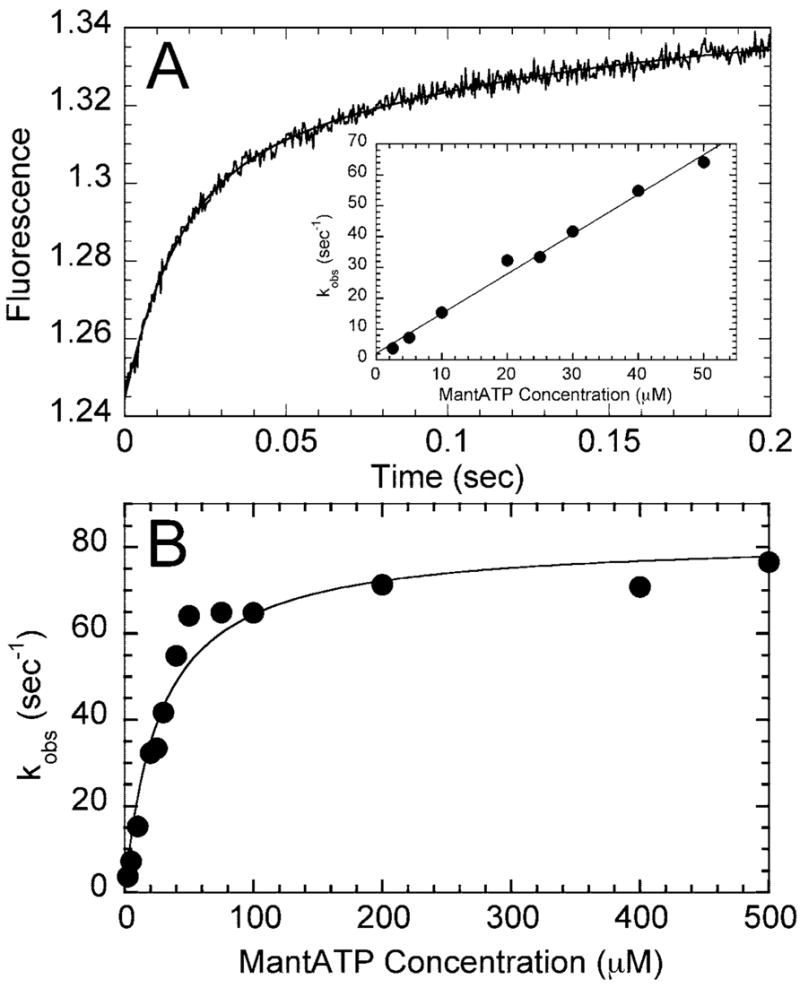
A, a preformed Mt·R210K complex (4 μM R210K, 15 μM tubulin, 20 μM Taxol) was mixed rapidly in the stopped-flow instrument with 100 μM mantATP, and a change in fluorescence was recorded. The data were fit to two exponential functions with the rate of the initial fast phase at 64.8 ± 3.3 s−1 followed by a slow phase at 9.0 ± 1.0 s−1. The inset represents a plot of the initial rates as a function of mantATP concentration from 2.5 to 50 μM mantATP. The fit of the data to Equation 3 provides the second-order rate constant for mantATP binding, k1 = 1.29 ± 0.05 μM−1 s−1, with the y intercept, k−1 = 2.18 ± 1.46 s−1. B, the observed rates of mantATP binding were plotted at higher concentrations of mantATP (2.5–500 μM). The data were fit to a hyperbola with a maximum rate of 82.0 ± 4.0 s−1 with K0.5,mantATP = 27.4 ± 4.6 μM.
Scheme 1.

The microtubule association kinetics (see Fig. 5) and the ATP-promoted dissociation kinetics (see Fig. 6) were performed by observation of the change in turbidity at 340 nm. The exponential rate constants (kobs) for microtubule association were plotted as a function of microtubule concentration and fit to Equation 4,
| (Eq. 4) |
where kobs is the rate of the observed exponential process, k5 is the second-order rate constant for microtubule association (see Scheme 1), and k−5 obtained from the y intercept is the rate constant for motor dissociation from the Mt·R210K complex.
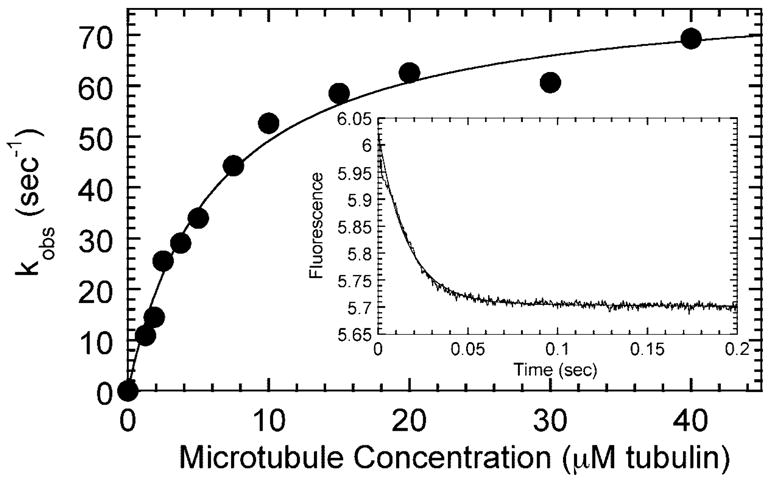
Fig. 5. Pre-steady-state kinetics of microtubule association.
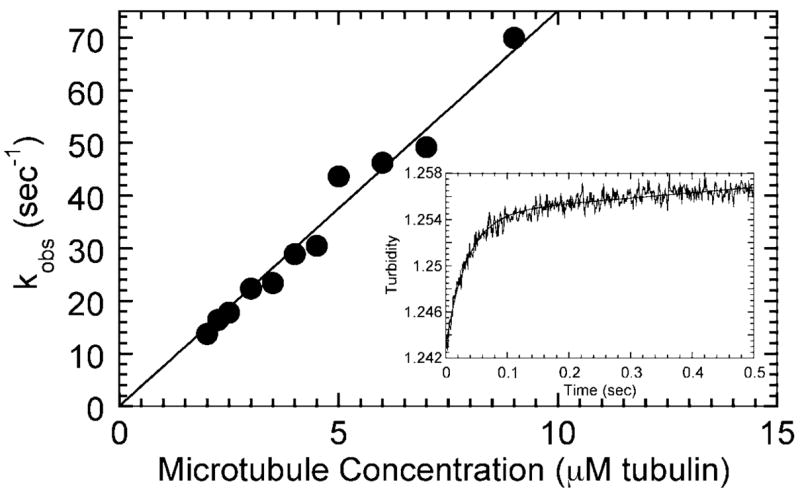
The observed rates of microtubule association increased as a function of microtubule concentration. The fit of the data to Equation 4 provides the second-order rate constant of microtubule association (k5 = 7.5 ± 0.17 μM−1 s−1). In the inset, R210K at 2 μM was mixed rapidly in the stopped-flow instrument with microtubules (4 μM tubulin, 15 μM Taxol), and a change in turbidity as a function of time was monitored. The smooth line is the fit of the data to two exponential functions (kobs = 28.9 ± 1.0 s−1 for the initial rapid phase).
Fig. 6. ATP-promoted dissociation kinetics of Mt·R210K and Mt·K401.
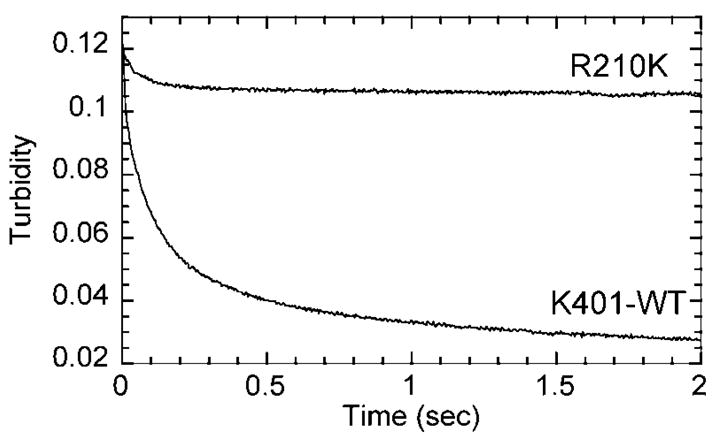
In the stopped-flow, the Mt·R210K or the Mt·K401 complex (both at 6 μM motor, 6 μM tubulin, 10 μM Taxol) was mixed rapidly with 1 mM MgATP + 100 mM KCl, and a change in turbidity was monitored. Both transients were fit to two exponential functions. For R210K, the amplitude of the fast initial phase was 0.0107 ± 0.0002 with kobs = 17.7 ± 0.7 s−1. For K401, the fit of the data yielded an amplitude of the fast initial phase = 0.049 ± 0.001 and the kobs = 14.9 ± 0.3 s−1.
Structural Modeling
The structural modeling of Fig. 10 was performed on a Silicon Graphics work station using the program O (52) and rendered using PyMOL (53). The hydrogen bonding capability of Arg210 was compared in the monomeric kinesin rat structure, 2KIN (20) and the monomeric kinesin human structure, 1BG2 (18). Asn256 in 2KIN was rotated by 180° about χ2 such that Nδ2 and Oδ1 are switched (this produces a model more consistent with the hydrogen bonding potential of this residue and its immediate environment). Mutant models were generated by redecorating the polypeptide backbone, followed by rotomer selection based on visual inspection using O (52). Rotomers were also examined for adjacent residues. A stereochemically sensible model could be obtained by rotomer selection at Lys203 and Glu199, followed by minimal manual readjustment of the side chains (see Fig. 10C).
Fig. 10. Structural modeling of the Arg210 residue in rat and human monomeric structures.
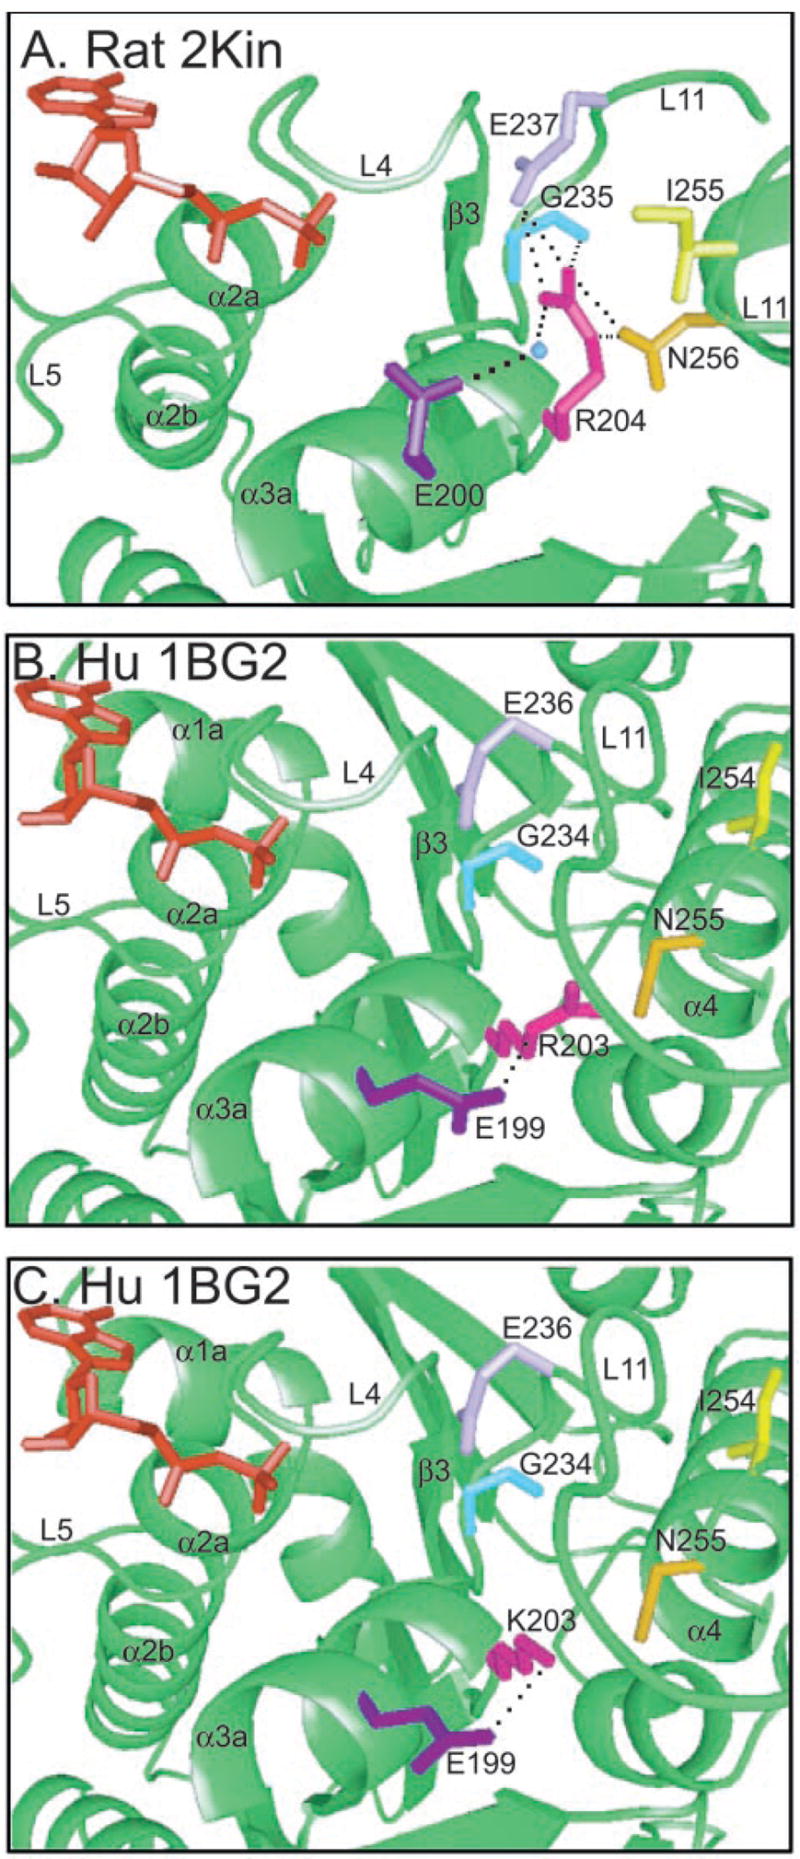
A, the active site of the rat monomer crystal structure of kinesin (2KIN) is shown with residues that can potentially form hydrogen bonds with Arg204 (rat numbering). ADP is shown in red. Glu237 (light purple), Gly235 (light blue), Asn256 (mustard), and H2O 60 (blue) may hydrogen bond with Arg204 (magenta) shown by the black dashed lines. Ile255 (yellow) may interact with Arg204 via a van der Waals interaction. Arg204 and Glu200 (dark purple) stabilize the position of H2O 60. B, the human monomer crystal structure of kinesin (1BG2) with the same residues as in A highlighted. The presentation in this structure maintained helix α3a in the same orientation as in A. Notice the movement of the region in the human structure. Numbering is based on the human sequence. The potential electrostatic interactions shown in the rat structure with rat Arg204 (human Arg203) can no longer occur; however, an alternative salt bridge may form between human Arg203 and Glu199. C, the human monomeric crystal structure of kinesin (1BG2) in the same orientation as in B with rotamers of the mutant lysine and wild-type glutamic acid substituted. The hydrogen bond is maintained in this structure.
RESULTS
Steady-state and Equilibrium Properties of R210K
We began our analysis by examining the steady-state kinetics of R210K (Fig. 1). For R210K, the rate of ATP turnover increased as a function of ATP concentration with the kcat = 0.03 s−1. Compared with K401-wt, there is a 700-fold decrease in the steady-state ATPase from 19.5 to 0.03 s−1 (Fig. 1B). The depressed kcat was similar to the constant observed for the R210A switch I mutant at 0.12 s−1, but the Km,ATP for R210K at 38 μM indicated higher affinity for ATP compared with R210A at 118 μM and K401-wt at 107 μM (Fig. 1 and Table I).
Fig. 1. R210K steady-state ATPase kinetics.
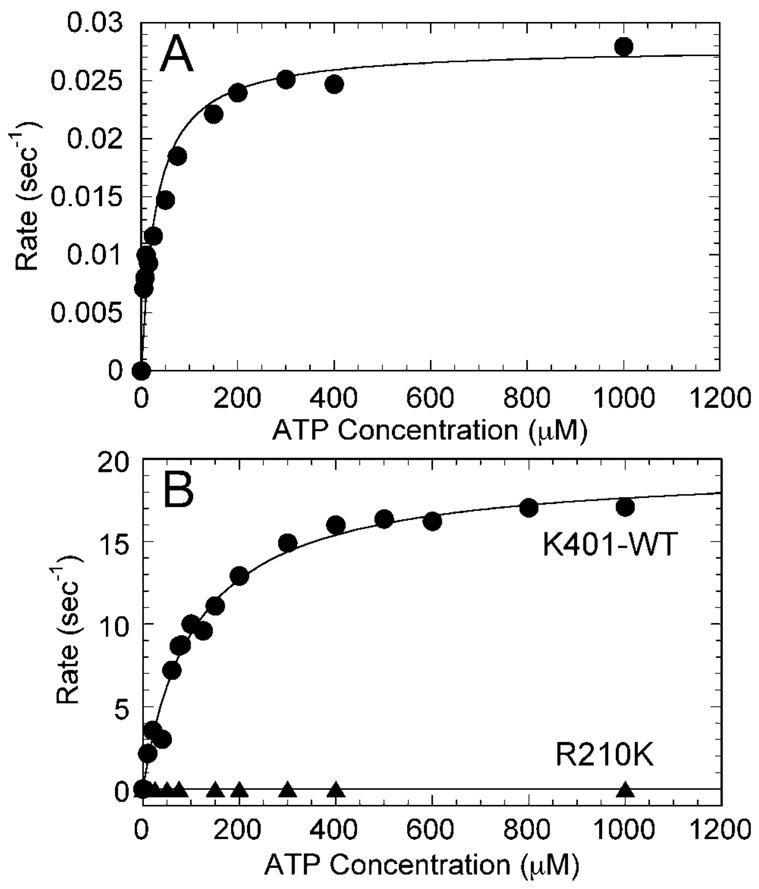
A, a preformed Mt·R210K complex (1 μM R210K, 30 μM tubulin, 30 μM Taxol) was mixed rapidly with varying MgATP concentrations (0–1 mM). The data were fit to a hyperbola with kcat = 0.028 ± 0.001 s−1 and Km,ATP = 30.1 ± 5.1 μM. B, comparison of K401-wt and R210K. Note the decrease in steady-state turnover from 19.5 ± 0.6 s−1 for K401-wt to 0.028 ± 0.001 s−1 for the mutant. The Km,ATP for wild-type kinesin K401 in this experiment was 107.4 ± 10.1 μM.
Table I.
Microtubule-kinesin constants
| Experimentally observeda |
Computer simulation,b K401-wt | ||||
|---|---|---|---|---|---|
| Rate constants | R210Ac | R210K | K401-wt | ||
| k1 | ATP bindingd,e | 0.71 ± 0.08 μM−1 s−1 | 1.29 ± 0.05 μM−1 s−1 | 1.1 μM−1 s−1d,e | 2 μM−1 s−1 |
| k1′ | kmax | 80.7 ± 4.2 s−1 | 82.0 ± 4.0 s−1 | 240 s−1 | |
| K0.5,ATP | 8.8 ± 2.0 μM ATP | 27.4 ± 4.6 μM ATP | 85 μM ATP | ||
| k−1 | ATP dissociatione | NDf | ND | 200 s−1e | 120 s−1 |
| k2 | Acid quenche | 0.2 ± 0.09 s−1 | 0.12 ± 0.08 s−1 | 100 s−1e | 100 s−1 |
| k3 | ATP-promoted microtubule dissociationg | No dissociation | No dissociation | 12–16 s−1g | 50 s−1 |
| k4 | Pi; releaseh | ND | ND | 13 s−1h | >150 s−1 |
| k5 | Microtubule associationg | 0.83 ± 0.04 μM−1 s−1 | 7.51 ± 0.17 μM−1 s−1 | 10–20 μM−1 s−1g | 11 μM−1 s−1 |
| k6 | ADP release both headsi | 57.2 ± 2.9 s−1 | 79.4 ± 3.0 s−1 | >200 s−1i | 300 s−1 |
| 16.2 ± 1.9 μM Mt | 6.2 ± 0.7 μM Mt | 15 μM Mt | |||
| K0.5,Mt | ADP release head 2i | ATP: | ATP: | ATP: | 200 s−1 |
| 30–42 s−1 | 69.3 ± 1.3 s−1 | >100 s−1 | |||
| 0.45 ± 0.12 μM | 76.3 ± 6.3 μM ATP | ||||
| kmax | AMP-PNP: | AMP-PNP: | AMP-PNP: | ||
| K0.5 | 30–40 s−1 | 26.2 ± 1.9 s−1 | 30–40 s−1 | ||
| 0.35 ± 0.14 μM | 857 ± 165 μM AMP-PNP | ||||
| ADP: | ADP: | ADP: | |||
| 25 s−1 | 8.7 ± 0.2 s−1 | 6 s−1 | |||
| 75.4 ± 5.0 μM ADP | |||||
| kcat | 0.12 ± 0.05 s−1 | 0.11 ± 0.05 s−1 | 20.6 ± 0.9 s−1 | ||
| Km,ATP | 118 ± 63 μM | 38 ± 9.9 μM | 94.4 ± 5.9 μM | ||
| Kd,Mt | 950 ± 28 nM | 75 ± 14 nM | 37 ± 6 nMj | ||
One observation we made during our studies with R210A was that the microtubule-motor complex formation was aberrant based on equilibrium binding experiments and the pre-steady-state kinetics of microtubule association (26). We evaluated Mt·R210K complex formation to determine whether these defects were rescued by the lysine mutation. In the equilibrium binding experiments (Fig. 2), 2 μM R210K was incubated with varying concentrations of microtubules (0 –7 μM). The reaction mixtures were centrifuged to obtain a supernatant and pellet at each microtubule concentration, and the samples were evaluated by SDS-PAGE. Fig. 2 shows that the fraction of R210K that sedimented with microtubules increased as a function of microtubule concentration, and the fit of the data yielded the Kd,Mt = 75 nM with maximal fractional binding at 1.05. These data indicate that R210K binds microtubules tightly with an equilibrium constant more similar to K401-wt at 37 nM than R210A at 950 nM (Table I).
ATP Binding and Hydrolysis
Our previous experiments with R210A showed that there was no pre-steady-state burst of ADP·Pi product formation during the first ATP turnover, indicative of an ATP hydrolysis defect. We explored the possibility that the lysine substitution may restore the ATP hydrolysis defect of R210A. As Fig. 3 shows, the Mt·R210K complex did not exhibit the exponential burst of product formation characteristic of wild-type kinesin; therefore, the orientation and charge of the lysine side chain were not sufficient to restore ATP hydrolysis. The rate constant for R210K at 0.12 s−1 indicates that either the step of ATP hydrolysis is rate-limiting, or some step prior to ATP hydrolysis is rate-limiting.
Our next experiments evaluated ATP binding using the fluorescent analog, mantATP (Fig. 4). The results show that there is an initial linear increase in the observed rate with increasing mantATP concentration, and the second-order rate constant for mantATP binding was 1.3 μM−1 s−1. This constant was similar to the rate constant for K401-wt at 1.1 μM−1 s−1 and R210A at 0.7 μM−1 s−1 (Table I). These results suggest that the lysine and alanine substitutions at Arg210 do not significantly alter formation of the Mt·K·ATP collision complex.
Wild-type kinesin exhibits two-step ATP binding (Scheme 1 (33, 51, 54)). ATP binding forms the initial Mt·K·ATP collision complex followed by a rate-limiting conformational change (k1′) to form the Mt·K*·ATP intermediate that proceeds directly to ATP hydrolysis. For wild-type kinesin, k1′ was observed at ~250 s−1 (51, 54). This rapid structural transition has been detected using a variety of experimental approaches (33, 55, 56) and is believed to represent neck linker docking onto the catalytic core as described originally by Rice et al. (25). For R210K, this ATP-dependent isomerization saturated at 82 s−1, which was quite similar to the rate constant observed for R210A at 81 s−1 (Table I). These results indicate that the lysine side chain, although positively charged, cannot rescue the ATP hydrolysis defect, but R210K can still undergo most of the ATP-driven structural transitions prior to ATP hydrolysis.
Microtubule Association and ATP-promoted Dissociation
We examined the pre-steady-state microtubule association kinetics (Fig. 5). In this experiment, R210K was mixed rapidly in the stopped-flow with microtubules, and the change in turbidity was monitored as a function of time (Fig. 5, inset). The rate of the initial fast phase increased linearly as a function of microtubule concentration and provided the second-order rate constant for Mt·R210K complex formation at 7.5 μM−1 s−1. This constant was more similar to wild-type kinesin (10 –20 μM−1 s−1) than to R210A (0.8 μM−1 s−1) (26, 38, 40). These results as well as those from the equilibrium binding experiments (Fig. 2) indicate that replacement of Arg210 with lysine, but not alanine, maintains the microtubule affinity of wild-type kinesin.
In Fig. 6, we present the ATP-dependent dissociation kinetics of R210K and K401-wt from the microtubule. Note that the amplitude associated with the K401-wt signal is significantly greater, implying that R210K does not readily dissociate from the microtubule upon the addition of ATP. R210A also showed this dissociation defect (26). These data indicate that although R210K may bind the microtubule with wild-type kinetics, ATP hydrolysis is still necessary for detachment from the microtubule as observed previously for kinesin superfamily members (26, 49, 57).
MantADP Release Kinetics to Assess Cooperativity
Microtubule binding dramatically accelerates ADP release from 0.01 s−1 to greater than 100 s−1 (1, 37, 38, 40, 41, 54, 58). Considering that R210K can bind the microtubule with wild-type kinetics, we asked whether or not R210K has wild-type ADP release kinetics. The rate constant for mantADP release from both heads was measured for the R210K dimer, and the maximum rate of the microtubule-promoted process was 80 s−1 (Fig. 7). This constant is typically measured at >100 s−1 for wild-type kinesin (37, 38, 40, 41, 43). In contrast, the R210A mutant showed mantADP release kinetics at 57 s−1 (26).
Fig. 7. Microtubule-activated mant-ADP release from both heads of the R210K·mantADP complex.
In the inset, a preformed R210K·mantADP complex (2.5 μM R210K, 5 μM mantADP) was mixed rapidly in the stopped-flow with microtubules (20 μM tubulin, 30 μM Taxol) plus 1 mM MgATP. The observed rate of the exponential phase was 62.5 ± 0.9 s−1. The experiment was repeated at varying microtubule concentrations, and the observed rates were plotted as a function of microtubule concentration. The fit of the data to a hyperbola provides a maximum rate of 79.4 ± 3.0 s−1 with a half-maximal rate achieved at 6.2 ± 0.7 μM tubulin.
To assess the cooperativity between the two heads of the R210K dimer, we explored the release of mantADP from the high affinity site of the Mt·R210K·mantADP complex (Fig. 8). When mantADP is added at half the concentration of active sites to a Mt·kinesin complex, mantADP partitions to the head weakly bound to the microtubule (head 2) (43). The other head, head 1 of the kinesin dimer, is bound tightly to the microtubule and free of nucleotide (species 1, Fig. 9). Upon the addition of ATP, ADP, or AMP-PNP, mantADP is released from the high affinity site, and the rate of release is dependent upon the nucleotide or analog used (26, 41, 43, 59). A preformed Mt·R210K·mantADP complex was mixed rapidly in the stopped-flow instrument with MgATP, MgADP, or MgAMP-PNP (Fig. 8). As shown in Fig. 8, B and C, the rates of mant-ADP release from the second head were different with each nucleotide used: ATP = 69 s−1 (K0.5,ATP = 76 μM), AMP-PNP = 26 s−1 (K0.5,AMP-PNP = 857 μM), and ADP = 9 s−1 (K0.5,ADP = 75 μM). These rates are very similar to wild-type kinesin constants (see Table I), indicating that R210K has the ability to discriminate these nucleotides in a fashion similar to wild-type. In our studies of R210A, we noted that the Mt·R210A complex could not distinguish among ATP, ADP, or AMP-PNP, and all nucleotides elicited similar rates of mantADP release from the second head (25–40 s−1 (26)). Also, the K0.5,ATP and the K0.5,AMP-PNP for R210A were both 0.4 μM. These experiments indicate that the substitution of lysine for alanine in the R210A motor has restored the ability of the dimeric motor to discriminate among the ATP, ADP, and AMP-PNP bound at the active site of head 1, the ability to communicate the nucleotide state of head 1 to head 2, and the ability of head 2 to respond appropriately by binding the microtubule and releasing mantADP.
Fig. 8. MantADP release from the high affinity site of R210K.
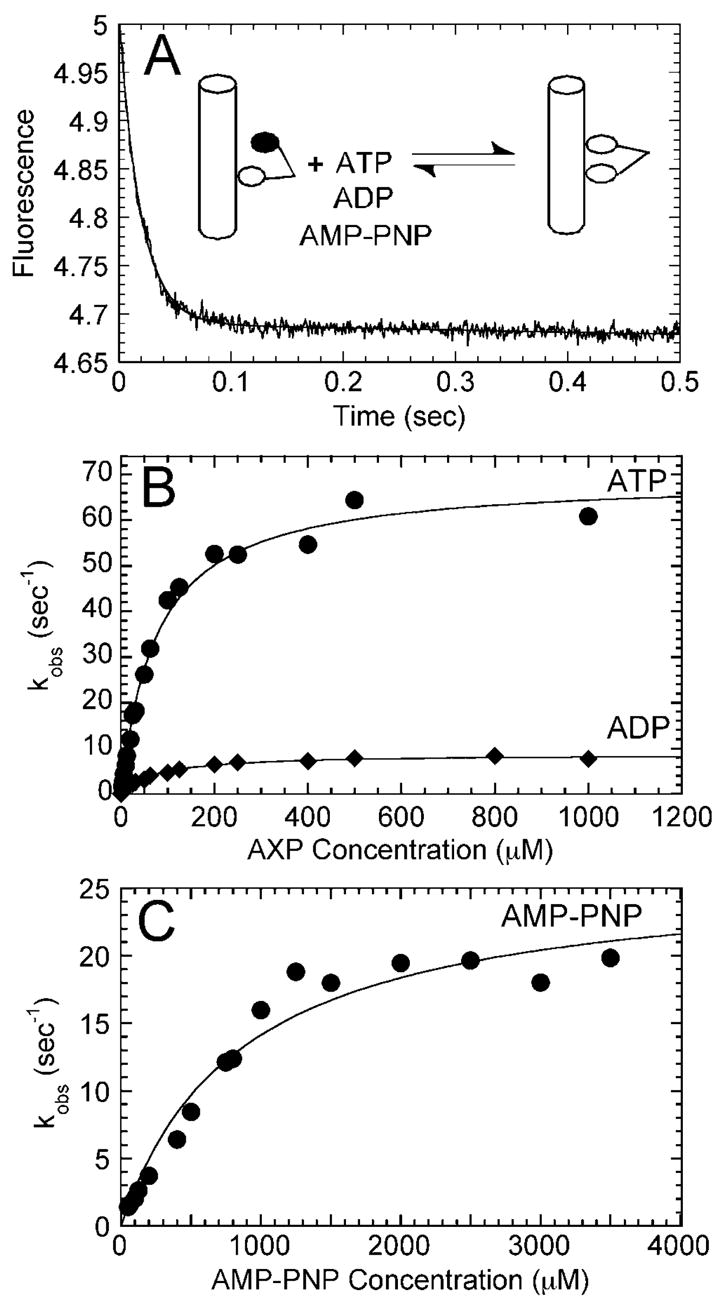
A preformed Mt·R210K·mantADP complex (2.5 μM R210K, 1.25 μM man-tADP, 15 μM tubulin, 20 μM Taxol) was mixed rapidly in the stopped-flow instrument with varying concentrations of MgATP (2.5–1,000 μM), MgADP (2–1,000 μM), or MgAMP-PNP (50 –3,500 μM). A, representative stopped-flow transient of the decrease in fluorescence as the complex is mixed rapidly with 200 μM MgATP. The data were fit to two exponential functions where the initial rapid rate was kobs = 52.6 ± 0.7 s−1. B, the exponential rate constants of the AXP-dependent fluorescence change were plotted as a function of ATP concentration and as a function of ADP concentration. Each data set was fit to a hyperbola. The maximum rate constant of mantADP release from the Mt·R210A·mantADP complex promoted by ATP was 69.3 ± 1.8 s−1, whereas the maximum rate of the ADP-promoted reaction was 8.7 ± 0.2 s−1. Both exhibited similar K0.5,AXP constants: 76.3 ± 6.3 μM for ATP and 75.4 ± 5.0 μM for ADP. C, the exponential rate constants of the AMP-PNP-dependent fluorescence change were plotted as a function of AMP-PNP concentration, and the data were fit to a hyperbola. The maximum observed rate of the AMP-PNP-promoted reaction was 26.2 ± 1.9 s−1, with a K0.5,AMP-PNP = 857 ± 165 μM.
Fig. 9. Model for kinesin motility.
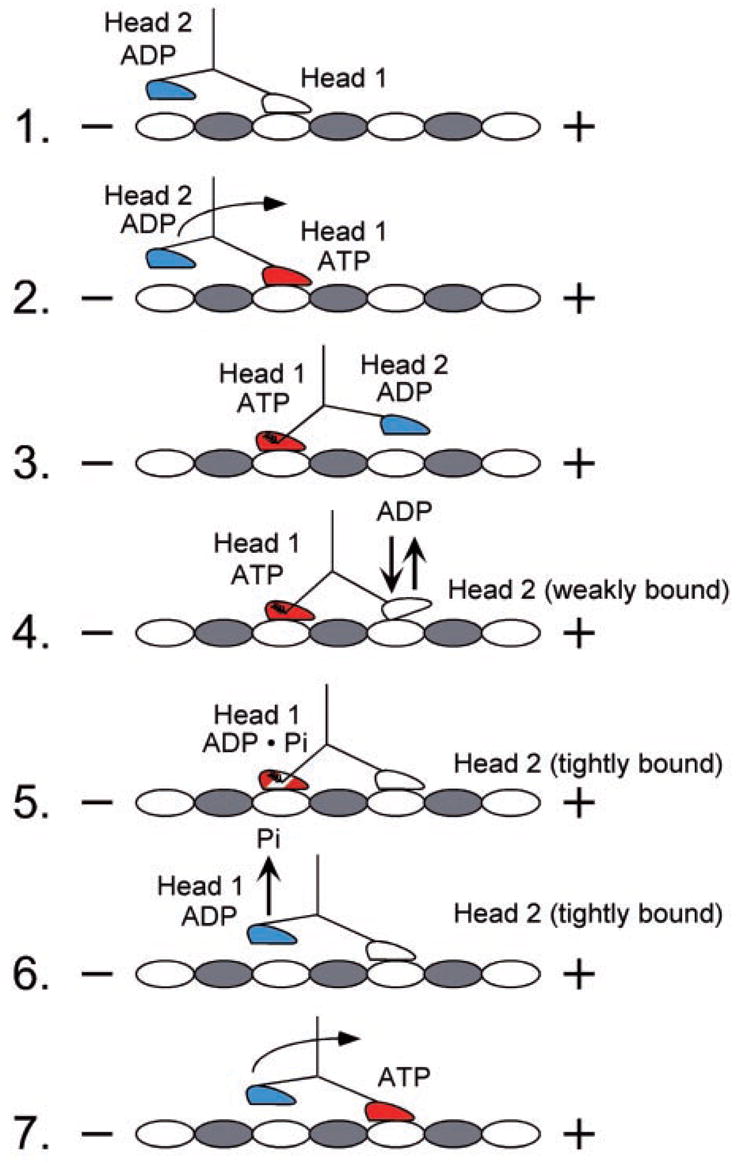
The cycle begins as head 1 binds the microtubule with rapid ADP release. ATP binding at head 1 leads to the plus-end-directed motion of the neck linker to position head 2 forward at the next microtubule binding site. ATP binding at head 1 is sufficient to promote head 2 association with the microtubule followed by rapid ADP release. ATP hydrolysis at head 1 locks head 2 onto the microtubule in a tight binding state. Pi release and detachment of head 1 from the microtubule follow. The active site of head 2 is now accessible for ATP binding, and the cycle is repeated.
DISCUSSION
Comparison of Conventional Kinesin Switch I Mutants
Our previous study with an alanine replacing the arginine at position 210 of the Drosophila conventional kinesin showed that ATP hydrolysis was a requirement to maintain the coordination and cooperativity between the motor domains of kinesin necessary for processivity (26). The work also demonstrated that there was weakened microtubule affinity. Based on these results with R210A (26) as well as work by Rice et al. (25) and Schnitzer et al. (56), we developed a model for kinesin stepping (Fig. 9). We propose that head 1 of kinesin has ATP bound, and head 2 is in a weak binding state with the microtubule with ADP weakly bound (species 4). Head 2 could represent the highly mobile monomeric kinesin state observed previously (60). For R210K, the kinetics suggest that the lysine mutant can reach species 5, where both heads become tightly bound to the microtubule.
Our studies with mutations at the conserved Arg210 residues of switch I have shown that there are differences in the kinetics dependent on the amino acid substitution. The R210A mutant abolishes the salt bridge linking Arg210 to the Glu243 in switch II which is thought to coordinate the water molecule necessary for the γ-phosphate cleavage of ATP, and an ATP hydrolysis defect was readily discernible. Replacing arginine with lysine could not rescue the ATP hydrolysis defect, suggesting that amino acid side chain length, hydrogen bonding potential, and orientation were critical for catalysis. As a result of the ATP hydrolysis defect, both mutants exhibited very slow steady-state ATP turnover. However, R210A (Km,ATP = 118 μM) showed a much weaker affinity for ATP than R210K, Km,ATP = 38 μM (Table I). R210K also exhibited higher affinity for micro-tubules under equilibrium conditions, similar to wild-type kinesin (Table I).
The pre-steady-state kinetics of microtubule association were significantly different for R210K and R210A. The second-order rate constant of microtubule association for R210K at 7.5 μM−1 s−1 is quite similar to K401-wt at 11 μM−1 s−1, yet the constant for R210A was 0.8 μM−1 s−1 (26). These results illustrate that the lysine mutant can rescue microtubule interactions that were defective in the alanine mutant.
Another substantial difference between R210A and R210K is nucleotide-stimulated release of mantADP from the second head. In the R210A mutant, the motor was either unable to differentiate ATP, ADP, and AMP-PNP or unable to communicate to the other motor domain, yet our results for R210K show a kinetic profile more similar to wild-type kinesin (Table I). These results implied that even in the absence of the chemical step of ATP hydrolysis, the active site of R210K did discriminate among nucleotide intermediates, restore head-head interactions, resulting in microtubule binding and mantADP release.
Structural Changes at the Conserved Arginine of Switch I
Switch I is a conserved element in myosins, kinesins, and G-proteins, and there has been considerable effort to understand the structural transitions in the active site of these enzymes which occur during nucleotide turnover (2–4, 6, 7, 9 –21, 23, 24). There are several switch I mutants that have been crystallized, but there has not been a conventional kinesin switch I mutant crystallized, nor has a conventional kinesin·ATP intermediate been crystallized. The salt bridge between Arg210 of switch I and Glu243 of switch II is observed in a subset of conventional kinesin crystal structures (rat kinesin (PDB 2KIN) (20), NcKin (PDB 1GOJ) (17), and human kinesin with docked neck linker (PDB 1MKJ) (35)). The kinesin superfamily member that has been crystallized as a proposed kinesin·ATP intermediate is Kif1A, which was crystallized with AMP-PCP (61), and a switch I mutant has been crystallized in Kar3, another kinesin superfamily member (16). However, the Kif1A structure is a chimera and does not show active site conformations indicative of a hydrolysis competent ATP state when compared with myosin and G-proteins. These studies have demonstrated that both switch I and II are mobile and responsive to the nucleotide present. In the case of the Kar3 mutant, the arginine in switch I was mutated to an alanine and crystallized. These results showed that there was significant disorder in loop 9 and helix α3. The authors speculate that these changes may weaken Mg2+ binding to the active site and accelerate ADP release. However, we did not observe accelerated ADP release in the R210A mutant in our studies (26).
To generate a more detailed structural hypothesis to explain how the lysine substitution can rescue microtubule function yet still have a pronounced defect in ATP hydrolysis, we pursued structural modeling. This analysis required kinesin structures representative of the ATP state and of the ADP state. Because there is no conventional kinesin·ATP structure available, we used two monomeric structures of kinesin: rat, PDB 2KIN (20); and human, PDB 1BG2 (18). We chose these two structures because of their high resolution (1.9 and 1.8 Å, respectively), and we propose that they represent two distinct biologically relevant conformations of kinesin based on the kinetic analysis of K401-wt, R210A, and R210K. The rat structure (Fig. 10A) has ADP bound at the active site, yet shows a kinesin state resembling the ATP-like state as determined by the presence of the Arg204-Glu237 salt bridge (rat sequence numbering, Table III) based on myosin and G-protein structures. As shown in Fig. 10A and Table II, the arginine at position 204 in the rat structure (ATP-like state) is critical to the active site. The elaborate network of hydrogen bonds serves to pin down the critical Arg204-Glu237 salt bridge and with the Arg204-Asn256 interactions, to hold together the three critical and flexible regions for ATP hydrolysis: switch I, switch II, and helix α4. The hydrogen bonding capacity of the arginine is fully saturated, which is expected in a key structural location such as the active site. The mutant lysine residue could not fulfill the hydrogen bonding capacity of the arginine because it only has the ability to donate three hydrogen bonds compared with arginine, which can make five hydrogen bonds.
Table III.
Alignment of key residues
| Dros 210 | EHSSRSHSV | Dros 241 | VDLAGSEKV |
| Rat 204 | EHSSRSHSI | Rat 235 | VDLAGSEKV |
| Human 203 | EHSSRSHSI | Human 234 | VDLAGSEKV |
| NcKin 207 | QESSRSHSI | NcKin 238 | VDLAGSEKV |
| Dros 206 | TNMNEHSSR | Dros 262 | AKNINKSLS |
| Rat 200 | TNMNEHSSR | Rat 256 | AKNINKSLS |
| Human 199 | TNMNEHSSR | Human 255 | AKNINKSLS |
| NcKin 203 | --MNQESSR | NcKin 259 | AKKINKSLS |
| Dros 243 | LAGSEKVSK | Dros 261 | EAKNINKSL |
| Rat 237 | LAGSEKVSK | Rat 255 | EAKNINKSL |
| Human 236 | LAGSEKVSK | Human 254 | EAKNINKSL |
| NcKin 240 | LAGSEKVGK | NcKin 258 | EAKKINKSL |
Table II.
Arg204 interactions
| Residue, atom | Contacting residue, atom | Distance |
|---|---|---|
| Å | ||
| Human monomer structure: 1BG2 | ||
| Arg203, Nε | Glu199, Oε2 | 2.73 |
| Lys203 a, Nζ | Glu199 a, Oε2 | 3.15 |
| Rat monomer structure: 2KIN | ||
| Arg204, Nε | Asn256, Oδ1b | 2.67 |
| Arg204, Nη2 | Asn256, Oδ1b | 3.16 |
| Arg204, Nη2 | Gly235, O | 3.04 |
| Arg204, Nη1 | H2O 60 | 3.03 |
| Arg204, Cζc | Ile255, Cγ2 | 3.6 |
| Arg204, Nη2 | Glu237, Oε2 | 3.07 |
| Arg204, Nη1 | Glu237, Oε2 | 3.18 |
| H2O 60 | Glu200, Oε1 | 2.72 |
Rotamers of mutant Lys203 and wild-type Glu199.
Asn256 was rotated about its χ2 such that Nδ2 and Oδ1 are appropriately switched in our model.
van der Waals interaction.
In contrast, the human structure also with ADP bound (Fig. 10B and Table II) lacks all of the critical hydrogen bonds. Visually, one can see that all of the key residues needed for these hydrogen bonds have moved. The Arg203-Glu236 (human sequence numbering, Table III) salt bridge is absent, perhaps representing the true ADP-bound state of kinesin. There appears to be an alternative salt bridge formed in this state between Arg203 and Glu199. Modeling of the R203K mutation, as described above, indicates it is plausible that this hydrogen bond would be conserved, and lysine could perform the structural requirements of this conformation (ADP state).
Examination of the switch I arginine environment in both structures supports our kinetic analysis of the two mutants. The kinetics show that replacing Arg210 with an alanine abolishes the ability of kinesin to hydrolyze ATP and maintain proper microtubule interactions (26). The kinetics for R210K (Table I) document that substituting a lysine at Arg210 restores microtubule function in microtubule association experiments, ADP release experiments, and in cooperativity between motor domains mediated by ATP. Our structural modeling of the lysine substitution in the rat structure, ATP-like state, indicates that lysine would not be able to satisfy the complete critical hydrogen bonding capacity but would be able to form some of the critical hydrogen bonds that stabilize the ATP intermediate to maintain a degree of structural integrity. However, we would expect that subtle structural displacements in adjacent residues, such as Glu237, would impact their function. This interpretation may explain the restored cooperative interactions from head 1 to head 2 signaled by ATP binding at head 1 and the tighter affinity to ATP. However, lysine cannot maintain all five hydrogen bonds as arginine can; therefore, it cannot restore complete function, i.e. microtubule-activated ATP hydrolysis. In addition, in the human structure, which we propose is a biologically relevant ADP conformation, lysine can form a critical hydrogen bond that stabilizes an alternative salt bridge, thus maintaining the same contact in the mutant as in the Mt·K·ADP state of the wild-type motor. In other words, the structural requirements placed on Arg210 by the ADP conformation are relatively simple with the result that they can be met by lysine (in contrast to the more complex requirements placed by the ATP conformation). The structural modeling supports our interpretation that R210K exhibits restored microtubule function in the kinetics of ADP release, microtubule association, microtubule affinity, and cooperativity.
Therefore, by identifying structures of kinesin which represent two distinct structural states, we have been able to generate plausible hypotheses to account for our kinetic observations. The elegant integration of structural modeling in concert with kinetics provides evidence that the human structure represents the ADP state and the rat structure may represent an ATP-like conformation even though both have ADP bound at their active sites in the crystals. Furthermore, the rat 2KIN crystal structure has a docked neck linker, signifying an ATP binding state. With the existence of disordered and ordered docking states of the neck linker in crystal structures with ADP bound at the active site (35), it is reasonable to believe two states of the kinesin active site can be crystallized with ADP bound. The next step to understanding how switch I is affected by these mutations is a high resolution structure to determine the changes that occur when the conserved switch I arginine is replaced by lysine compared with alanine.
Acknowledgments
We thank Dr. F. Jon Kull (Dartmouth College) and Dr. Alexander Marx (Max-Planck Unit for Structural Molecular Biology) for thoughtful comments during the preparation of this paper, Brian Robertson for assistance with protein purification, and Arabela Grigorescu for help with structural modeling and use of PyMOL.
Footnotes
This work was supported in part by Grant GM54141 from the NIGMS, National Institutes of Health, and by Career Development Award K02-AR47841 from the NIAMS, National Institutes of Health (to S. P. G.).
The abbreviations used are: K401-wt, wild-type kinesin heavy chain fragment containing the N-terminal 401 amino acids; AMP-PNP, adenosine 5′-(β,γ-imino)triphosphate; mant, 2′(3′)-O-(N-methylanthraniloyl); Mt, microtubule.
References
- 1.Kuznetsov SA, Gelfand VI. Proc Natl Acad Sci U S A. 1986;83:8530–8534. doi: 10.1073/pnas.83.22.8530. [DOI] [PMC free article] [PubMed] [Google Scholar]
- 2.Vale RD. J Cell Biol. 1996;135:291–302. doi: 10.1083/jcb.135.2.291. [DOI] [PMC free article] [PubMed] [Google Scholar]
- 3.Smith CA, Rayment I. Biophys J. 1996;70:1590–1602. doi: 10.1016/S0006-3495(96)79745-X. [DOI] [PMC free article] [PubMed] [Google Scholar]
- 4.Kull FJ, Vale RD, Fletterick RJ. J Muscle Res Cell Motil. 1998;19:877–886. doi: 10.1023/a:1005489907021. [DOI] [PubMed] [Google Scholar]
- 5.Sack S, Kull FJ, Mandelkow E. Eur J Biochem. 1999;262:1–11. doi: 10.1046/j.1432-1327.1999.00341.x. [DOI] [PubMed] [Google Scholar]
- 6.Vale RD, Milligan RA. Science. 2000;288:88–95. doi: 10.1126/science.288.5463.88. [DOI] [PubMed] [Google Scholar]
- 7.Geeves MA, Holmes KC. Annu Rev Biochem. 1999;68:687–728. doi: 10.1146/annurev.biochem.68.1.687. [DOI] [PubMed] [Google Scholar]
- 8.Shimada T, Sasaki N, Ohkura R, Sutoh K. Biochemistry. 1997;36:14037–14043. doi: 10.1021/bi971837i. [DOI] [PubMed] [Google Scholar]
- 9.Pate E, Naber N, Matuska M, Franks-Skiba K, Cooke R. Biochemistry. 1997;36:12155–12166. doi: 10.1021/bi970996z. [DOI] [PubMed] [Google Scholar]
- 10.Minehardt TJ, Cooke R, Pate E, Kollman PA. Biophys J. 2001;80:1151–1168. doi: 10.1016/S0006-3495(01)76092-4. [DOI] [PMC free article] [PubMed] [Google Scholar]
- 11.Onishi H, Kojima S, Katoh K, Fujiwara K, Martinez HM, Morales MF. Proc Natl Acad Sci U S A. 1998;95:6653–6658. doi: 10.1073/pnas.95.12.6653. [DOI] [PMC free article] [PubMed] [Google Scholar]
- 12.Suzuki Y, Yasunaga T, Ohkura R, Wakabayashi T, Sutoh K. Nature. 1998;396:380–383. doi: 10.1038/24640. [DOI] [PubMed] [Google Scholar]
- 13.Furch M, Fujita-Becker S, Geeves MA, Holmes KC, Manstein DJ. J Mol Biol. 1999;290:797–809. doi: 10.1006/jmbi.1999.2921. [DOI] [PubMed] [Google Scholar]
- 14.Muller J, Marx A, Sack S, Song YH, Mandelkow E. Biol Chem. 1999;380:981–992. doi: 10.1515/BC.1999.122. [DOI] [PubMed] [Google Scholar]
- 15.Wriggers W, Schulten K. Biophys J. 1998;75:646–661. doi: 10.1016/S0006-3495(98)77555-1. [DOI] [PMC free article] [PubMed] [Google Scholar]
- 16.Yun M, Zhang X, Park CG, Park HW, Endow SA. EMBO J. 2001;20:2611–2618. doi: 10.1093/emboj/20.11.2611. [DOI] [PMC free article] [PubMed] [Google Scholar]
- 17.Song YH, Marx A, Muller J, Woehlke G, Schliwa M, Krebs A, Hoenger A, Mandelkow E. EMBO J. 2001;20:6213–6225. doi: 10.1093/emboj/20.22.6213. [DOI] [PMC free article] [PubMed] [Google Scholar]
- 18.Kull FJ, Sablin EP, Lau R, Fletterick RJ, Vale RD. Nature. 1996;380:550–555. doi: 10.1038/380550a0. [DOI] [PMC free article] [PubMed] [Google Scholar]
- 19.Kozielski F, Sack S, Marx A, Thormahlen M, Schonbrunn E, Biou V, Thompson A, Mandelkow EM, Mandelkow E. Cell. 1997;91:985–994. doi: 10.1016/s0092-8674(00)80489-4. [DOI] [PubMed] [Google Scholar]
- 20.Sack S, Muller J, Marx A, Thormahlen M, Mandelkow EM, Brady ST, Mandelkow E. Biochemistry. 1997;36:16155–16165. doi: 10.1021/bi9722498. [DOI] [PubMed] [Google Scholar]
- 21.Sasaki N, Shimada T, Sutoh K. J Biol Chem. 1998;273:20334–20340. doi: 10.1074/jbc.273.32.20334. [DOI] [PubMed] [Google Scholar]
- 22.Kull FJ, Endow SA. J Cell Sci. 2002;115:15–23. doi: 10.1242/jcs.115.1.15. [DOI] [PubMed] [Google Scholar]
- 23.Onishi H, Ohki T, Mochizuki N, Morales MF. Proc Natl Acad Sci U S A. 2002;99:15339–15344. doi: 10.1073/pnas.242604099. [DOI] [PMC free article] [PubMed] [Google Scholar]
- 24.Kliche W, Fujita-Becker S, Kollmar M, Manstein DJ, Kull FJ. EMBO J. 2001;20:40–46. doi: 10.1093/emboj/20.1.40. [DOI] [PMC free article] [PubMed] [Google Scholar]
- 25.Rice S, Lin AW, Safer D, Hart CL, Naber N, Carragher BO, Cain SM, Pechatnikova E, Wilson-Kubalek EM, Whittaker M, Pate E, Cooke R, Taylor EW, Milligan RA, Vale RD. Nature. 1999;402:778–784. doi: 10.1038/45483. [DOI] [PubMed] [Google Scholar]
- 26.Farrell CM, Mackey AT, Klumpp LM, Gilbert SP. J Biol Chem. 2002;277:17079–17087. doi: 10.1074/jbc.M108793200. [DOI] [PubMed] [Google Scholar]
- 27.Sablin EP, Case RB, Dai SC, Hart CL, Ruby A, Vale RD, Fletterick RJ. Nature. 1998;395:813–816. doi: 10.1038/27463. [DOI] [PubMed] [Google Scholar]
- 28.Case RB, Pierce DW, Hom-Booher N, Hart CL, Vale RD. Cell. 1997;90:959–966. doi: 10.1016/s0092-8674(00)80360-8. [DOI] [PubMed] [Google Scholar]
- 29.Endow SA, Waligora KW. Science. 1998;281:1200–1202. doi: 10.1126/science.281.5380.1200. [DOI] [PubMed] [Google Scholar]
- 30.Henningsen U, Schliwa M. Nature. 1997;389:93–96. doi: 10.1038/38022. [DOI] [PubMed] [Google Scholar]
- 31.Tomishige M, Vale RD. J Cell Biol. 2000;151:1081–1092. doi: 10.1083/jcb.151.5.1081. [DOI] [PMC free article] [PubMed] [Google Scholar]
- 32.Case RB, Rice S, Hart CL, Ly B, Vale RD. Cur Biol. 2000;10:157–160. doi: 10.1016/s0960-9822(00)00316-x. [DOI] [PubMed] [Google Scholar]
- 33.Rosenfeld SS, Jefferson GM, King PH. J Biol Chem. 2001;276:40167–40174. doi: 10.1074/jbc.M103899200. [DOI] [PubMed] [Google Scholar]
- 34.Skiniotis G, Surrey T, Altmann S, Gross H, Song YH, Mandelkow E, Hoenger A. EMBO J. 2003;22:1518–1528. doi: 10.1093/emboj/cdg164. [DOI] [PMC free article] [PubMed] [Google Scholar]
- 35.Sindelar CV, Budny MJ, Rice S, Naber N, Fletterick R, Cooke R. Nat Struct Biol. 2002;9:844–848. doi: 10.1038/nsb852. [DOI] [PubMed] [Google Scholar]
- 36.Naber N, Rice S, Matuska M, Vale RD, Cooke R, Pate E. Biophys J. 2003;84:3190–3196. doi: 10.1016/S0006-3495(03)70043-5. [DOI] [PMC free article] [PubMed] [Google Scholar]
- 37.Gilbert SP, Moyer ML, Johnson KA. Biochemistry. 1998;37:792–799. doi: 10.1021/bi971117b. [DOI] [PubMed] [Google Scholar]
- 38.Moyer ML, Gilbert SP, Johnson KA. Biochemistry. 1998;37:800–813. doi: 10.1021/bi9711184. [DOI] [PubMed] [Google Scholar]
- 39.Crevel I, Carter N, Schliwa M, Cross R. EMBO J. 1999;18:5863–5872. doi: 10.1093/emboj/18.21.5863. [DOI] [PMC free article] [PubMed] [Google Scholar]
- 40.Gilbert SP, Webb MR, Brune M, Johnson KA. Nature. 1995;373:671–676. doi: 10.1038/373671a0. [DOI] [PMC free article] [PubMed] [Google Scholar]
- 41.Brendza KM, Sontag CA, Saxton WM, Gilbert SP. J Biol Chem. 2000;275:22187–22195. doi: 10.1074/jbc.M001124200. [DOI] [PMC free article] [PubMed] [Google Scholar]
- 42.Hackney DD. Proc Natl Acad Sci U S A. 1994;91:6865–6869. doi: 10.1073/pnas.91.15.6865. [DOI] [PMC free article] [PubMed] [Google Scholar]
- 43.Ma YZ, Taylor EW. J Biol Chem. 1997;272:724–730. doi: 10.1074/jbc.272.2.724. [DOI] [PubMed] [Google Scholar]
- 44.Gilbert SP, Johnson KA. Biochemistry. 1993;32:4677–4684. doi: 10.1021/bi00068a028. [DOI] [PubMed] [Google Scholar]
- 45.Correia JJ, Gilbert SP, Moyer ML, Johnson KA. Biochemistry. 1995;34:4898–4907. doi: 10.1021/bi00014a047. [DOI] [PubMed] [Google Scholar]
- 46.Brendza KM, Rose DJ, Gilbert SP, Saxton WM. J Biol Chem. 1999;274:31506–31514. doi: 10.1074/jbc.274.44.31506. [DOI] [PMC free article] [PubMed] [Google Scholar]
- 47.Gilbert SP, Mackey AT. Methods. 2000;22:337–354. doi: 10.1006/meth.2000.1086. [DOI] [PubMed] [Google Scholar]
- 48.Klumpp LM, Brendza KM, Rosenberg JM, Hoenger A, Gilbert SP. Biochemistry. 2003;42:2595–2606. doi: 10.1021/bi026715r. [DOI] [PubMed] [Google Scholar]
- 49.Foster KA, Correia JJ, Gilbert SP. J Biol Chem. 1998;273:35307–35318. doi: 10.1074/jbc.273.52.35307. [DOI] [PubMed] [Google Scholar]
- 50.Mackey AT, Gilbert SP. Biochemistry. 2000;39:1346–1355. doi: 10.1021/bi991918+. [DOI] [PubMed] [Google Scholar]
- 51.Gilbert SP, Johnson KA. Biochemistry. 1994;33:1951–1960. doi: 10.1021/bi00173a044. [DOI] [PubMed] [Google Scholar]
- 52.Jones TA, Zou JY, Cowan SW, Kjeldgaard Acta Crystallogr Sect A. 1991;47:110–119. doi: 10.1107/s0108767390010224. [DOI] [PubMed] [Google Scholar]
- 53.DeLano WL. The PyMOL Molecular Graphics System. DeLano Scientific; San Carlos, CA: 2002. [Google Scholar]
- 54.Ma YZ, Taylor EW. Biochemistry. 1995;34:13242–13251. doi: 10.1021/bi00040a040. [DOI] [PubMed] [Google Scholar]
- 55.Rosenfeld SS, Xing J, Jefferson GM, Cheung HC, King PH. J Biol Chem. 2002;277:36731–36739. doi: 10.1074/jbc.M205261200. [DOI] [PubMed] [Google Scholar]
- 56.Schnitzer MJ, Visscher K, Block S. Nat Cell Biol. 2000;2:718–723. doi: 10.1038/35036345. [DOI] [PubMed] [Google Scholar]
- 57.Foster KA, Mackey AT, Gilbert SP. J Biol Chem. 2001;276:19259–19266. doi: 10.1074/jbc.M008347200. [DOI] [PubMed] [Google Scholar]
- 58.Hackney DD. Proc Natl Acad Sci U S A. 1988;85:6314–6318. doi: 10.1073/pnas.85.17.6314. [DOI] [PMC free article] [PubMed] [Google Scholar]
- 59.Hackney DD. Biochemistry. 2002;41:4437–4446. doi: 10.1021/bi0159229. [DOI] [PubMed] [Google Scholar]
- 60.Sosa H, Peterman EJ, Moerner WE, Goldstein LS. Nat Struct Biol. 2001;8:540–544. doi: 10.1038/88611. [DOI] [PubMed] [Google Scholar]
- 61.Kikkawa M, Sablin EP, Okada Y, Yajima H, Fletterick RJ, Hirokawa N. Nature. 2001;411:439–445. doi: 10.1038/35078000. [DOI] [PubMed] [Google Scholar]
- 62.Mandelkow E, Johnson KA. Trends Biochem Sci. 1998;23:429–433. doi: 10.1016/s0968-0004(98)01278-x. [DOI] [PubMed] [Google Scholar]
- 63.Moyer ML. Ph D thesis. Pennsylvania State University; University Park, PA: 1998. Mechanism of the Microtubule Kinesin Motor ATPase. [Google Scholar]