Abstract
Developmental exposures to methylmercury (MeHg) have life-long behavioral effects. Many micronutrients, including selenium, are involved in cellular defenses against oxidative stress and may reduce the severity of MeHg-induced deficits. Zebrafish embryos (<4 hours post fertilization, hpf) were exposed to combinations of 0.0-0.30 μM MeHg and/or selenomethionine (SeMet) until 24 hpf then placed in clean medium. Fish were tested as adults under low light conditions (~60 μW/m2) for visual responses to a rotating black bar. Dose-dependent responses to MeHg exposure were evident (ANOVA, P<0.001) as evidenced by reduced responsiveness, whereas SeMet did not induce deficits except at 0.3 μM,. Ratios of SeMet:MeHg of 1:1 or 1:3 resulted in responses that were indistinguishable from controls (ANOVA, P<0.001). No gross histopathologies were observed (H&E stain) in the retina or optic tectum at any MeHg concentration. Whole-cell, voltage-gated, depolarization-elicited outward K+ currents of bipolar cells in intact retina of slices adult zebrafish were recorded and outward K+ current amplitude was larger in bipolar cells of MeHg-treated fish. This was due to the intense response of cells expressing the delayed rectifying IK current; cells expressing the transient IA current displayed a slight trend for smaller amplitude among MeHg-treated fish. Developmental co-exposure to SeMet reduced but did not eliminate the increase in the MeHg-induced IK response, however, IA responses increased significantly over MeHg-treated fish to match control levels. Electrophysiological deficits parallel behavioral patterns in MeHg-treated fish, i.e., initial reactions to the rotating bar were followed by periods of inactivity and then a resumption of responses.
Descriptors: behavioral toxicology, bipolar cells, mercury, retina, selenium, visual response, voltage-gated potassium currents, zebrafish
INTRODUCTION
Mercury (Hg)-induced neuronal dysfunction has been documented in many vertebrate species and is manifested through deficits in sensory reception and behavior [1]. Visual systems, regardless of vertebrate species are particularly sensitive to methylmercury (MeHg) exposure [2-5] and, therefore, provide a useful model for investigating toxic effects on behavior and the fundamental mechanisms that direct it. Due to biomagnification in the food web, MeHg is of particular interest to those human populations whose diet contains significant quantities of predatory fish. Adult exposures to MeHg, e.g., consumption of contaminated food, industrial contamination, cause decreases in motor skills and learning [6-8]. Given, however, that a crucial route of MeHg exposure is maternal transfer and neurological damage can be significant as well in the embryo/fetus [9], it is important to investigate whether these developmental exposures are capable of inducing long-term, permanent sensory deficits that are associated with alterations in behavioral responses in adults. While prenatal/prehatch MeHg exposure induces behavioral effects during early life history stages [9, 10], such deficits may not manifest themselves until much later [11].
Recently, much discussion has been generated regarding the interactions between Hg and selenium (Se), specifically selenoenzymes such as glutathione peroxidase and thyroid hormone deiodinases and their precursors [12-15]. While Se may provide neuroprotective effects against Hg toxicity [12, 15], it has been suggested that Hg, by binding to Se compounds, actually creates Se deficiencies that are the root cause of toxic effects [13, 14]. At sufficiently high concentrations, Se, however, also can induce toxic responses [16-18].
Studies with rats have suggested that developmental co-exposure to both selenomethionine (SeMet; the form commonly found in the diet) and MeHg may result in differential effects in adult animals depending upon the specific behavior being evaluated, i.e., reduced toxic effects are observed only for simple reflex behaviors but not for more complex learning tasks [19]. Three fundamental issues, therefore, are addressed in this study in terms of the interaction between Hg and Se: 1) sensitivity of early stages of embryo development to MeHg exposure as expressed in future adult behaviors, 2) the role of developmental SeMet, i.e., a model of embryo uptake of Se [20, 21], in reducing specific neurobehavioral deficits due to embryonic exposure to MeHg, and 3) confirm basic vertebrate, cross-species similarities both in behavioral phenotype and underlying neuronal structure and function.
MATERIALS AND METHODS
Treatment of Glassware and Plasticware
All laboratory materials made of plastic were washed thoroughly and immersed in a 30mM Na4EDTA (Fisher Scientific, Hanover Park, IL) solution overnight to remove all surface adsorbed metal ions; glassware was washed and immersed in a 10% HNO3 (Fisher Scientific, Hanover Park, IL) solution overnight. Glass and plasticware were then rinsed in ultra-pure reagent-grade, polished water (Milli-Q™, Millipore Corp., Medford, MA).
Breeding and Egg Collection
Adult zebrafish (N = 5 TL strain females and 3 GL strain males/aquarium) were placed in a 2-L plastic aquarium (N = 4) overnight at 28°C in the Aquatic Animal Facility of the Marine and Freshwater Biomedical Sciences Center at the University of Wisconsin-Milwaukee. The differing color patterns between male and female fish allowed easier separation after each breeding session. Photoperiod was kept at 14L:10D. Aquaria were constructed with one 2-L plastic aquarium (bottom replaced by a nylon mesh through which only the eggs can pass) was placed in a second 2-L plastic aquarium that held the eggs safely and prevented the adults from eating the eggs. Eggs were collected ≤ 2 hours post fertilization (hpf), counted, and placed into metal-free, glass culture dishes (100 mm diameter × 50 mm depth, N = 100 eggs/dish). Zebrafish medium (E2 water) consists of: 0.875 g NaCl/L deionized water with 0.038 g KCl/L, 0.120 g MgSO4/L, 0.021 g KH2PO4, and 0.006 g Na2HPO4 [22].
Exposure Regime
Collected eggs (N = 100 eggs/dish) were rinsed twice in MeHg-free (as determined by ICP-MS analysis) E2 medium and transferred to metal-free glass dish (100 mm diameter × 50 mm depth) containing 100 mL of 0.0, 0.01, 0.03, 0.06, 0.10, or 0.30 μM MeHg crossed with 0.0, 0.01, 0.03, 0.06, 0.10, or 0.30 μM SeMet, i.e., 49 possible combinations, until 24 hpf at which time a subsample was analyzed for Hg and Se content by ICP-MS, and the remainder raised in MeHg-free medium (28°C, 14L:10D) until tested at 4 months as adults. Fry were fed vinegar eels until large enough to consume artemia nauplii. Juveniles and adults were fed a combination of artemia nauplii and Aquarian™ flake food (Aquarium Pharmaceuticals, Inc., Chalfont, PA).
Embryo Hg and Se analysis
Eggs (N = 100 with 3 replicates at each exposure concentration and co-exposure regime) were collected after 24 hpf, rinsed twice in Hg2+-free E2 medium, placed in Teflon™ microvials (7.0 mL) with the chorion intact, and acid digested (2.0 mL of 800 mL ICP-MS grade, ultrapure HNO3 and 0.5 mL ppb ICP-MS grade, ultrapure gold (Au) diluted to 1.0 L with Milli-Q™ water) in a microwave oven (MARS 5, CEM Corp., Matthew, NC). Gold was added to the digestion solution to scavenge any Hg2+ that might otherwise adsorb to the vessel wall and be unavailable for analysis. The “closed vessel” digestion was carried out under a temperature controlled program (25°C to 130°C at 5°C per minute, held at 130°C for 10 min, cooled to room temperature). Samples were decanted into 20 mL autosampler vials and brought to a final volume of 10.0 mL with the addition of 9.0 mL digestion solution. Mercury and selenium were analyzed with a MicroMass Platform inductively coupled plasma-mass spectrophotometer (ICP-MS) (Manchester, UK) equipped with a CETAC ASX 500 autosampler (Waters Corp, Medford, MA) under MassLynx NT software control for element measurements. Appropriate calibration standards were prepared from a 10μg mL-1 (in 5% ICP-MS grade HNO3) Hg2+ or Se4+ standard (CertiPrep, Metuchen, NJ). A calibration curve was constructed by ICP-MS analysis of 1-100 ppb Hg2+ and Se4+. The solvent system solution blank was 5% HNO3, 0.1% HCl and 500 ppb Au in ICP-MS grade, ultrapure water [18 MegOhm). Acids used were double-distilled ICP-MS grade (Optima, Fisher Scientific). All analyses were measured in the SIR Mode (Single Ion Recording) for 60 s. Separate analyses (N = 10) were conducted on the exposure media to verify concentrations.
Visual response evaluation
The behavioral apparatus (Fig. 1) follows previously published accounts [23] as modified for testing adults and to allow for different drum speeds and directions. Briefly, fish (4 months old, 1.5-2.0 cm standard length) are placed into a stationary glass container (total volume approx. 200 ml) with a central pole to force the fish to swim in circles. Glass container (10 cm diam., 5 cm depth) is suspended by brackets over a rotating drum of white PVC plastic (diam. 11 cm, depth 4 cm). On the drum black electrical tape (1 cm width × 5 cm height) is used to create a mark for eliciting a startle response when it comes into the fish’s field of vision. Zebrafish adults will react to the rotating black bar by either a C-start escape response or an avoidance maneuver. After a 5 minute low light acclimation time, reactions to the leading edge were recorded over a 5 minute period of time. Since there is a circadian rhythm to light sensitivity [24], all tests were done from 1300-1500 h each day.
Figure 1.
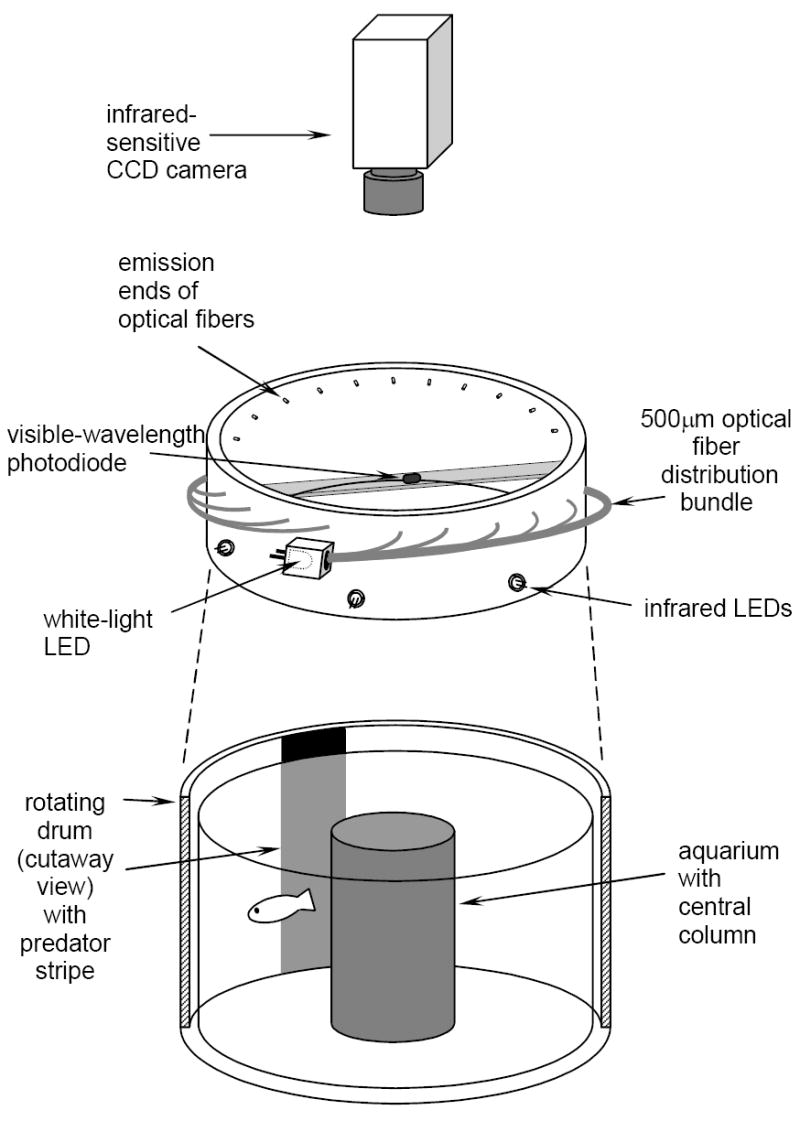
Apparatus for testing visual response in adult zebrafish. PVC collar surrounds both the glass holding dish for test subject and rotating drum. Collar contains a white light fiber optic bundle lit by a single LED and a ring of individual infrared LEDs. Light intensity is controlled remotely. Behaviors recorded remotely so that neither the observer nor the light from the monitor affect the responses. The central photodiode relays to a monitor actual light intensity in the chamber.
Zebrafish are able to see well under low light conditions. To assess potential visual deficits, very low light conditions (~60 μW/m2) were created using a white light diode attached to a 500 μm optical fiber distribution bundle inserted through a PVC collar. This assured even distribution of equal spectral integrity throughout the chamber. Intensity was detected with a visible wavelength photodiode suspended in the observation chamber and remotely manipulated and monitored. To allow the observer to monitor the behaviors, a ring of infrared (IR) LEDs (960 nm) was also inserted into the same PVC collar. Fish do not see in IR wavelengths [25]. IR intensity could also be manipulated remotely. To allow for observer monitoring, an IR-sensitive CCD camera (Sony Hyper HAD B&W Video Camera) recorded the data, images were displayed on a remote monitor (Sony Trinitron, Model PMM-135) to facilitate observations without disturbing the test fish. The drum speed was set at 10 rev/min, i.e., if the fish were to remain in place and react each time it saw the black bar it would react 50 times/5 min observation period (indicated by the horizontal line in Figs. 4, 5). Since fish are in constant motion, they approach the moving bar more than this value and, therefore, have additional opportunities to react to the visual stimulus.
Figure 4.
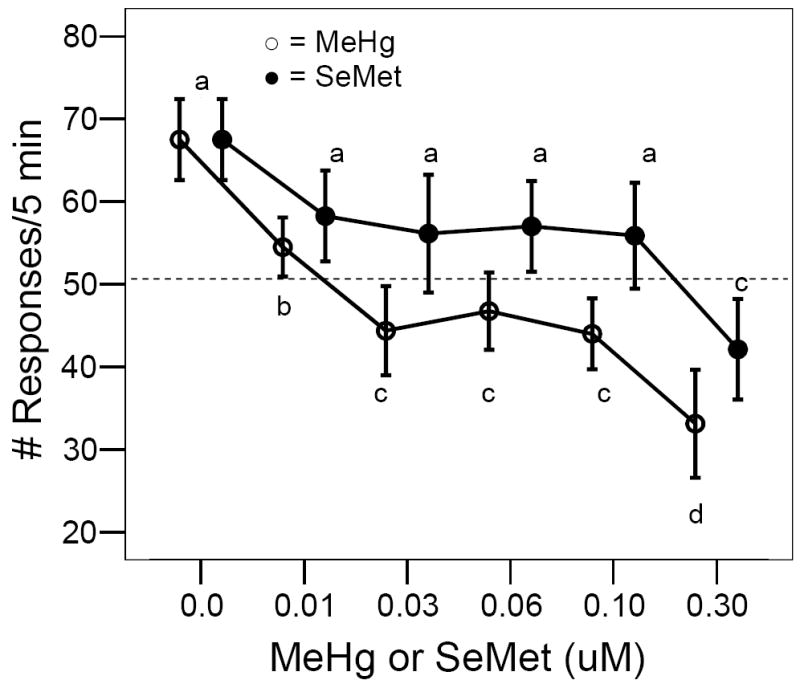
Effect of developmental MeHg (○) or SeMet (●) exposure on adult expression of visual responses to a rotating black bar under low light conditions. Horizontal line represents the expected number of responses if a stationary fish reacted once each time the black bar completed a circuit around the glass holding dish, i.e., 10 revolutions/min for 5 min = 50 responses. Bars with different letters (a = not different from control values) are statistically different from their respective control (ANOVA, P< 0.05, Tukey’s HSD Test, P < 0.05).
Figure 5.
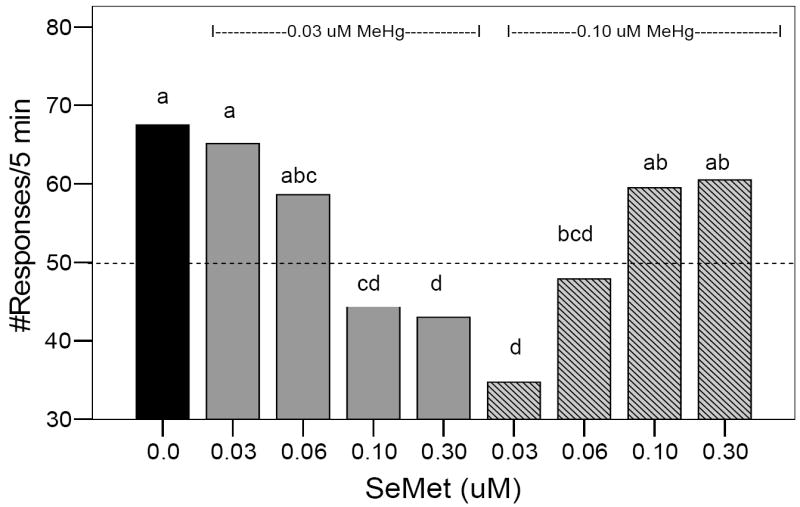
Effect of co-exposure to developmental MeHg + SeMet on adult expression of visual responses to a rotating black bar under low light conditions. A range of 0.0-0.30 μM SeMet was used as a co-exposure with either 0.03 or 0.10 μM MeHg as indicated by the dashed lines above the bars. Dotted horizontal line represents the expected number of responses if the fish reacted once each time the black bar completed a circuit around the glass holding dish, i.e., 10 revolutions/minute for 5 minutes = 50 responses. Bars with different letters are statistically different (ANOVA, P< 0.05, Tukey’s HSD Test, P < 0.05).
Gross morphology of retina
Zebrafish that were tested for visual response were euthanized with MS-222 (100 mg/L, adjusted to pH7.5 with phosphate buffer), decapitated, and heads preserved in 4% paraformaldehyde. After 24 hours, heads were successively washed with 30, 50, and 70% EtOH. After a final wash with an additional aliquot of 70% EtOH, heads were embedded in paraffin wax, section (5μm thickness), mounted, and stained with hematoxylin and eosin stains. Slides were viewed with an Olympus BX60 microscope at 50x magnification and evaluated for photoreceptor density and shape, as well as general integrity of other retina layers.
Evaluation of voltage-gated potassium (K+) currents
The remainder of the visual response test fish was evaluated for retinal electrophysiology.
Preparation of retinal slices
Retinal slices were prepared following established protocols [26, 27]. Briefly, fish were removed from aquaria, dark adapted for at least 20 minutes, anesthetized in a 0.02% MS-222 solution until gill ventilation ceased, and then decapitated.
Retinas were removed from the eyes and mounted vitreal-side down on a piece of Millipore™ filter paper (0.45μm pore size). The filter/retina unit was then mounted onto Vaseline strips in the recording chamber, covered with the standard extracellular solution, and sectioned (100μm sections). Sections were rotated 90° and viewed in cross-section using an Olympus BX50WI microscope fitted with a 40x water immersion lens and Hoffman modulation contrast optics.
Recordings
Whole-cell voltage-gated currents were recorded in response to voltage steps from a holding potential of -60mV (-80 to +60mV, in 10mV increments). Recordings were made using a standard exracellular solution composed of 120mM NaCl, 2mM KCl, 3mM CaCl2, 1 mM MgCl2, 4mM HEPES, and 3mM D-glucose, brought to pH 7.4-7.5 with NaOH.
Patch electrodes were made of thin-walled, filamented borosilicate glass pulled to the desired tip diameter with a Flaming-Brown P-80 micropipette puller. Pipettes were filled with an intracellular solution composed of 12mM KCl, 104mM K-gluconate, 1mM EGTA, 4mM HEPES, and 100μMCaCl2. Once mixed, the intracellular solution was brought to pH 7.4-7.5 using KOH. Lucifer Yellow (1% solution) was added to the intracellular solution to label recorded neurons. Labeled cells were visualized at the end of the experiment and photographed using a Nikon Coolpix digital camera. Images were processed in Adobe Photoshop. Recordings were made using an Axopatch 1-D patch clamp amplifier and pCLAMP (version 8.0) software.
Statistical Analyses
All statistical analyses and data presentations were accomplished using SPSS 13 for Windows software. Variables (number of responses) were evaluated for normality of data and variance using Kolmogorov-Smirnov tests followed by one-way ANOVA and Tukey’s post hoc tests. Level of significance was set at P < 0.05.
RESULTS
Embryo Hg and Se Concentrations
Mercury uptake, measured as total Hg, by the embryo during the 0-24 hpf time period followed a dose-dependent response curve (Fig. 2). Total Se uptake, however, remained at a low level until the 0.3 μM exposure concentration (Fig. 2). During co-exposure to 0.03 μM MeHg and various concentrations of SeMet from 0-24 hpf, embryo Hg levels remained constant, Se levels were evident only at the higher concentrations. Using 0.10 μM MeHg with varying levels of SeMet, embryo Hg levels remained high until a 1:1 SeMet:MeHg ratio was used in the exposure media. At that ratio, embryo Hg levels were similar to those of embryos exposed to 0.03 μM MeHg (Fig. 3).
Figure 2.
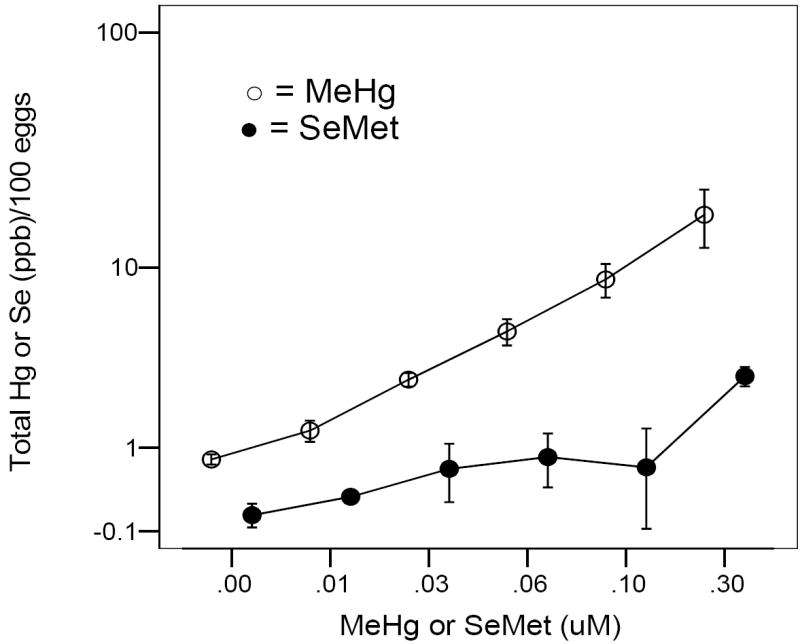
Total mercury (○) or selenium (●) in 24 hpf zebrafish embryos after 0-24 hpf exposure to either MeHg or SeMet. Values = geometric means ± geometric S.E.
Figure 3.
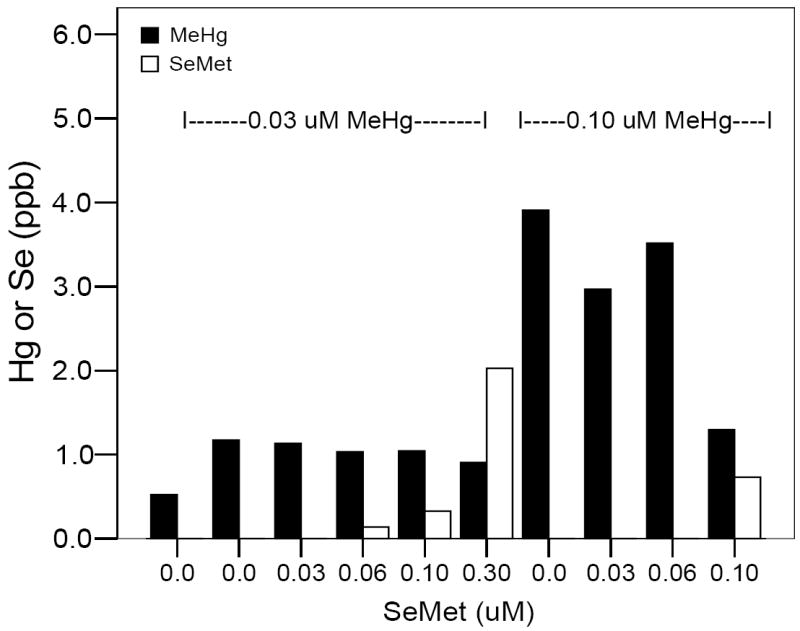
Total mercury (■) and selenium (□) in 24 hpf zebrafish embryos after 0-24 hpf co-exposure (N = 100). A range of 0.0-0.30 μM SeMet (X-axis) was used as a co-exposure with either 0.03 or 0.10 μM MeHg (indicated by the dashed lines above the bars corresponding to appropriate exposures to SeMet).
Visual Response to Waterborne MeHg
Waterborne MeHg exposure to 0-24 hpf zebrafish embryos induced a biphasic, dose-dependent response to visual stimuli (Fig. 4). Even at the lowest exposure concentration used in this study (0.01 μM MeHg), a significant decrease in response rate was observed in the adult fish (ANOVA, P< 0.01, F = 5, 42). Over the 5 min observation period, all fish, regardless of developmental exposure regime, responded to the rotating black bar each time it came into view for the first 1-2 min. After this time period, however, those individuals that had been developmentally exposed to MeHg, ceased reacting for 1-4 min. Occasionally, some of these fish would begin responding again to the stimulus for a short time and then, once again, cease reacting. The pattern of response to the visual stimuli was not constant over the observation period in MeHg-treated individuals; only control fish displayed a constant reaction rate over the 5 min period in which few encounters with the black bar resulted in no response.
Visual Response to Waterborne SeMet
The addition of SeMet to the exposure media during the first 24 hpf did not alter behavioral responses to visual stimuli in the adult zebrafish. Unlike MeHg-exposed fish, responses remained above the 50 responses/5 min benchmark (Fig. 4), i.e., as a consequence of their locomotor activity, these fish would encounter and respond to the black bar multiple times during the drum’s rotation. Only at the highest exposure level, 0.3 μM SeMet, was a reduction in the number of times the fish reacted to the rotating black bar observed (ANOVA, P< 0.01, F = 5, 42).
Visual Response to Waterborne MeHg and SeMet Co-exposure
At low MeHg exposure concentrations (0.03 μM), visual responses similar to control exposures occurred only at SeMet exposure levels of 0.03-0.06μM, i.e., 1-2 SeMet : 1 MeHg, at higher SeMet exposures, there was a reduction in visual response rates (Fig. 5, ANOVA, P < 0.01, F = 8, 63). At higher MeHg concentrations (0.10μM), control levels were only reached at SeMet concentrations of 0.10-0.30μM, i.e., 1:1-3:1 SeMet:MeHg, at lower SeMet concentrations, there was a reduction in visual response rates (Fig. 5, ANOVA, P < 0.01, F = 8, 63) and paralleled the response pattern due to 0.10 μM MeHg alone (Fig. 4).
Retina Histopathology
Two regions were examined in terms of gross histopatholgies, photoreceptor and inner nuclear layer. While it was not possible to differentiate between rods and cones, there did not seem to be any difference between control fish and 0.30μM MeHg in terms of number of photoreceptor cells or overall density of those cells (data not shown). Since the electrophysiology analysis of the retina was conducted on bipolar cells, the inner nuclear layer was also examined. Again, although the different cell types, e.g., bipolar vs. amacrine, could not be differentiated, there was no apparent change in cell number or density in this layer (data not shown).
Retina Electrophysiology
Whole-cell currents could be recorded from both control and treated fish. Overall, giga-ohm input resistances were measured for recorded cells, in agreement with published reports on zebrafish bipolar neurons [26]. For control fish, input resistance averaged 7GOhm. For treated fish, the input resistance was lower, averaging ~ 2GOhm. In general, cells from retinas of treated fish were leakier, and harder to record, though this may or may not be a direct function of MeHg exposure.
Two types of depolarization-elicited outward K+ currents were identified in retinal bipolar cells (Fig. 5). The first type of current rapidly activated and inactivated, typically reaching peak amplitude within the first 5 ms of the voltage step. The second type of current activated more slowly and was sustained. These currents have been previously identified in zebrafish bipolar cells [26] as the transient IA and delayed rectifying IK currents, respectively. The IK and IA currents measured in control fish were of similar magnitude to those recorded previously for zebrafish bipolar cells [26, 27]. For both types of current, peak amplitude at each voltage step was measured. As MeHg exposure generally affected all outward K+ currents in the same manner, current amplitude values were pooled prior to analysis.
Exposure to MeHg increased K+ current amplitude in zebrafish bipolar cells. Mean (± SE) peak current amplitude for control fish measured following a voltage step to +60mV was 254 ± 55.5pA (N = 4). In contrast, IK current amplitude measured from the fish in the highest MeHg treatment (0.3μM) averaged 466 ± 133.8pA (N = 4). Exposure to 0.1μM methylmercury also resulted in a similar increase in current amplitude (N = 2). Thus, the amplitude of outward K+ currents is larger in bipolar cells from treated fish than controls (Fig. 6). Importantly, there is a dose-dependent effect (Figs. 6-9). While there is a large standard error for each observation (data not shown), due to different response amplitudes of IA and IK currents (Figs. 8, 9), there is a clear trend of greater K+ current amplitude in bipolar cells from retinas of treated fish than of controls (Fig. 7, ANOVA, P<0.0001). Currents from both ON- and OFF-type bipolar cells were recorded in this study, as 4 of the treated cells had terminals in sublamina b (indicative of ON- cells), 4 cells had terminals in sublamina a (OFF-cells), and 2 had terminals in both sublamina a and b.
Figure 6.
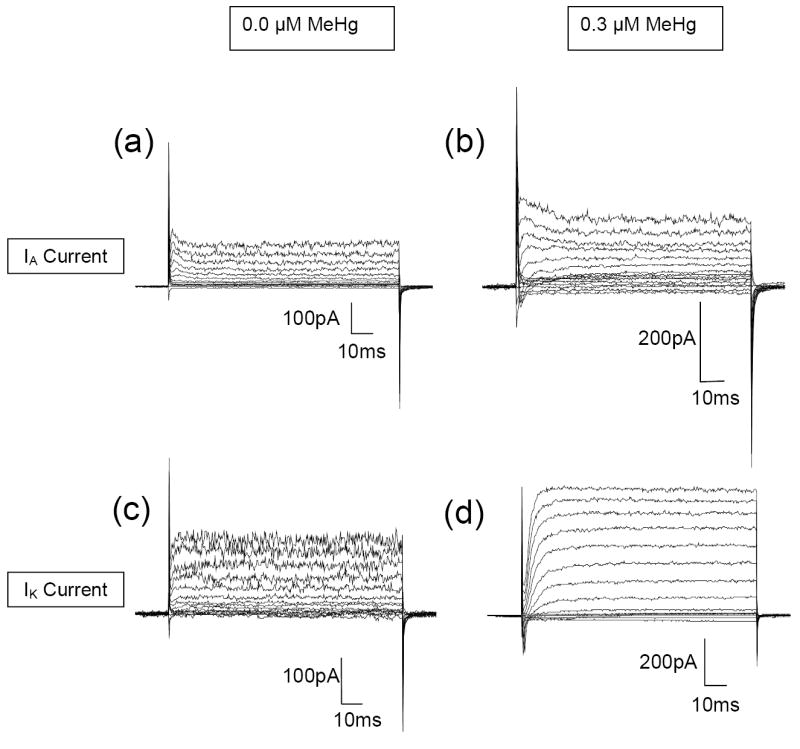
The amplitude of depolarization-elicited potassium currents in adult zebrafish bipolar cells is altered following developmental exposure to methylmercury. Whole-cell current traces recorded from bipolar cells in (a, c) control and (b, d) treated retinal slices. Currents were elicited in 10mV increments from a holding potential of -60mV (range -80 to +60mV). Both the transient IA current (a, b) and the delayed rectifying IK current (c, d) were identified. Left: 0.0 μM MeHg, Right: 0.30 μM MeHg
Figure 9.
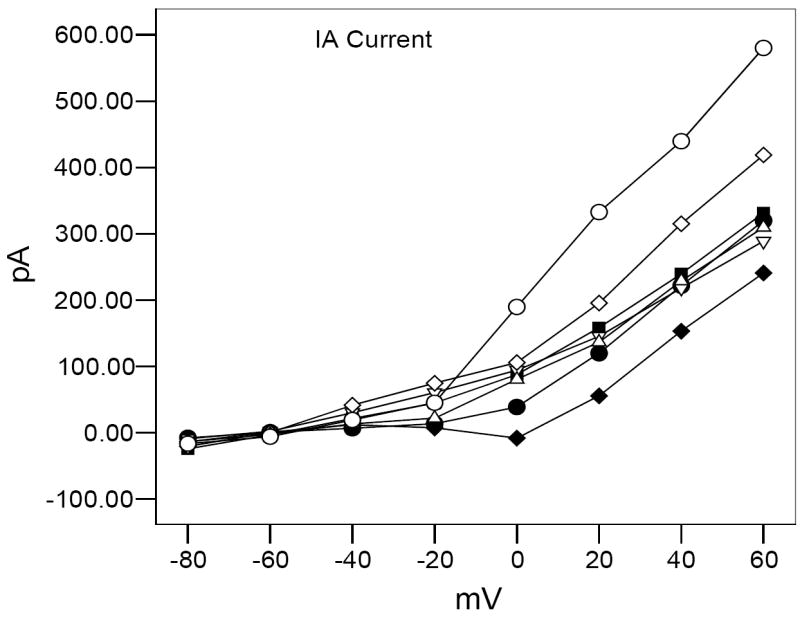
Transient (IA) current is reduced at higher voltage steps in adult zebrafish after developmental exposure to MeHg (● = 0.0 μM MeHg + 0.0 μM SeMet, - ■ = 0.10 μM MeHg, ♦ = 0.30 μM MeHg, = 0.03 μM MeHg + 0.03 μM SeMet, ◊ = 0.03 μM MeHg + 0.10 μM SeMet, △ = 0.10μM MeHg + 0.03 μM SeMet, ○ = 0.10 μM MeHg + 0.10 μM SeMet). Values of IA are increased either to match be above control responses after developmental co-exposure to SeMet. None of the treated fish displayed significantly different results at +60 mV from control values (ANOVA, P > 0.05).
Figure 8.
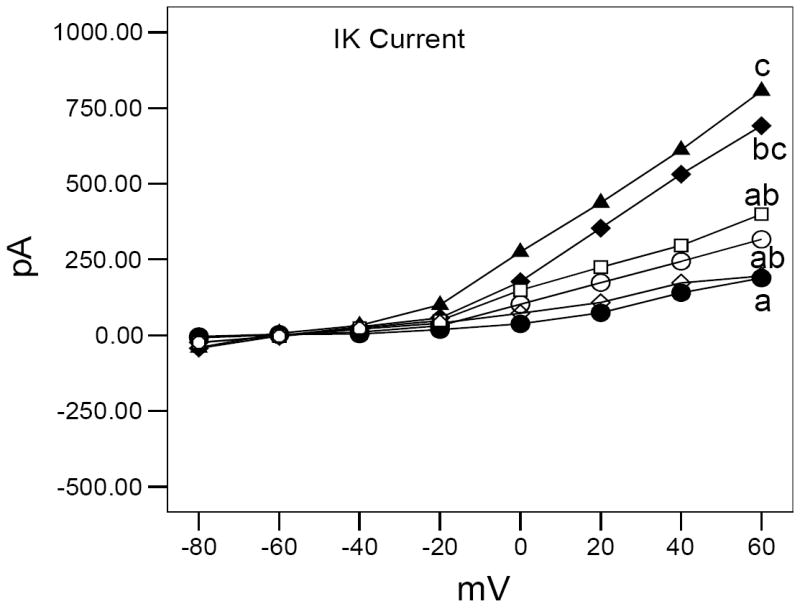
Delayed rectifying (IK) current is enhanced in adult zebrafish following developmental exposure to MeHg (● = 0.0 μM MeHg + 0.0 μM SeMet, ▲ = 0.10 μM MeHg, ♦ = 0.30 μM MeHg, □ = 0.03 μM MeHg + 0.03 μM SeMet, ◊ = 0.03 μM MeHg + 0.10 μM SeMet, ○ = 0.10 μM MeHg + 0.10 μM SeMet). IK current in adult zebrafish is intermediate between control and MeHg-exposed fish after developmental co-exposure to SeMet. Different letters indicate significantly different results at +60 mV from control values (ANOVA, P < 0.0005 followed by Tukey’s HSD test for between group differences).
Figure 7.
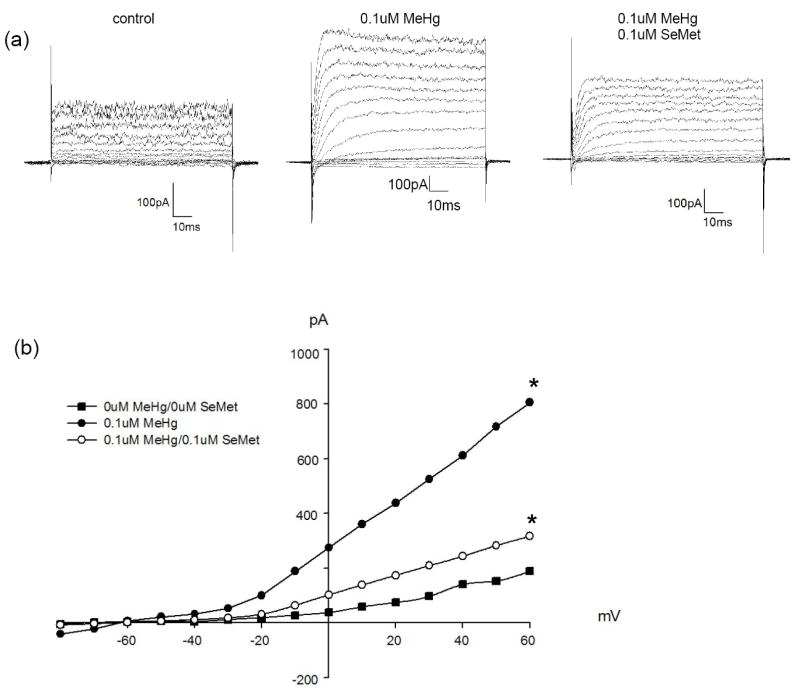
Delayed rectifying (IK) current is enhanced in adult zebrafish following developmental exposure to MeHg. (a) Representative whole-cell current traces showing the increase in outward current amplitude following exposure to 0.1μM MeHg (middle traces). The increase in current amplitude is partially suppressed when MeHg is co-applied with SeMet (right traces). (b) Current-voltage relation, values presented are means. Traces in (a) were recorded following voltage steps from -80 to +60mV in 10mV increments (Vhold = -60mV). * = Significantly different from control values (ANOVA, P < 0.05).
Though the overall trend shows MeHg exposure results in increased K+ current amplitude, specific differences for IK and IA currents were noted. For example, exposure to methylmercury resulted in a statistically significant increase (~3.5x; ANOVA, P < 0.0005) in IK current amplitude. Co-exposure to MeHg/SeMet (Fig. 8) also caused an increase in current amplitude, though the increase observed in cells from co-exposed retinas was lower (~2x) and represented an intermediate response between control and MeHg-only values. The smallest increase in IK amplitude, and the values closest to control, was observed in cells in the 0.03μM MeHg/0.1μM SeMet treatment, corresponding to a 3 SeMet : 1 MeHg.
For cells expressing the IA current, the results are not as straightforward. Current amplitude recorded in control conditions is greater than that recorded in the highest MeHg treatment (0.3μM, Fig. 9), while, IA amplitude recorded from cells in the lowest condition (0.03μM MeHg) was greater than controls (Fig. 9). Co-exposure to either 0.1μM MeHg/0.03μM SeMet or 0.03μM MeHg/0.03μM SeMet resulted in an IA amplitude slightly larger than controls (Fig. 9). Overall, the highest IA amplitudes were recorded in bipolar cells co-exposed to 0.1μM MeHg/0.1μM SeMet or 0.03μM MeHg/0.1uM SeMet (corresponding to ratios of 1 SeMet: 1 MeHg or 3 SeMet: 1 MeHg). Due to the large standard errors and small sample size, these values were not statistically significant (ANOVA, P > 0.05).
DISCUSSION
Visual deficits due to MeHg exposure have been observed in a wide range of vertebrate species and phyla, including fish, rats, monkeys, and humans [2-5, 28-31]. All exposure regimes used in this study were sublethal and were similar to those used with Medaka [32, 33], a species which occupies similar niches in similar habitats; concentrations above 0.3 μM MeHg result in significant zebrafish embryo mortality (personal observations). LC50s for embryo exposures between these two species are similar [33, Carvan and Weber unpublished data]. Importantly, the values used represent environmentally relevant concentration ranges in those habitats where zebrafish are potentially found [34-36]. Although several studies have indicated greater MeHg uptake in fish that observed in this study [37-39], none of those involved developmental exposures targeted at and isolated to the earliest stages of embryonic neuron formation. Thus, it is not unexpected that the uptake values of both total Hg and Se are significantly less than those reported by others, even if the exposure concentrations were of a similar order of magnitude. Additionally, values are for whole egg, i.e., embryo plus surrounding fluids, which will result in even lower concentrations. This, however, suggests that the early stages of embryo development are exceedingly sensitive to even small amounts of MeHg, at least as it pertains to adult visual responses and some of the underlying mechanisms that control those behaviors.
The log-linear response suggests a positive, sensitive concentration-dependent effect. While this study did not investigate developmental MeHg-induced alterations in neuron microstructure and axon or dendrite growth found by others [40-43], it did provide support for long-term functional changes in the sensory neurons of the retina (Figs. 6-9). Since the uptake of MeHg is concentration-dependent (Fig 2), the behavioral and physiological alterations observed in this study also can be traced back to the amount of MeHg the embryo accumulated.
Interestingly, SeMet co-exposure affects MeHg concentrations in the embryo (Fig. 3). It is not clear at this point whether the effect is due to uptake, metabolism, or excretion, although uptake of Hg parallels increased uptake of Se in both embryos and fetuses [44-45]. Data from this study suggest that, while this may also occur at lower SeMet:MeHg ratios, this may not occur if both are present in the exposure media at higher concentrations (Fig. 3). It has been observed that inorganic Se, as selenide, interacts with MeHg in microbial media (R. Burlage, Univ. Wisc.-Milwaukee, pers. comm.), thus possibly affecting MeHg uptake. It is likely that SeMet, as well, binds with MeHg while in the zebrafish embryo media. Since there is a concentration-dependent uptake of MeHg (Figs. 2, 3) which is attenuated only with high SeMet co-exposure (Fig. 3), it is still possible that the two, at some level, are interacting in the embryo itself. To what extent this interaction extends to any available Se found in the vinegar eel or flake food diet used during this experiment is not clear. It appears, however, to be insufficient to significantly eliminate the visual response alterations due to developmental MeHg (Figs. 4-9).
Many vertebrate species are particularly sensitive to environmental chemical stresses during embryonic development [46]. These early-life stage exposures may induce profound behavioral deficits in adult stage fishes [47, 48]. While it has been demonstrated that developmental Hg exposures to fish embryos can induce short-term, larval alterations in behavioral expression [10, 49-51], fewer studies detailing long-term, adult effects of developmental exposures exist [50, 52]. In the studies reported here, correlations between an affected adult behavior and its underlying mechanisms have been sought, e.g., visual responses are linked to changes in the electrophysiology of key sensory neuron systems of the retina [53]. When Hg was perfused over retinal slice preparations, decreases in response amplitudes were identified [4, 30, 31]. The authors know of no other study in which developmental MeHg exposures were used in conjunction with adult testing for retinal function, particularly as it correlates to visual response behaviors.
Visual cues are critical in directing fish behavior [54]. In particular, presentations of “shadows” give the appearance of threatening objects approaching inducing an escape response [53]. Under low light conditions, an accurate assessment by the fish as to what that object is may be difficult, thus eliciting an evasive movement. As ambient light quality may affect visual response behaviors in experimental animals exposed to developmental MeHg [55], the low-light conditions place all individuals on an equal basis of “guessing” what the approaching stimulus could be. Under these experimental conditions, the rod cells, rather than the cones, are the primary photoreceptor in the retina. Interestingly, in both this study and in work involving pigeons [56] gross retinal morphology, as viewed under a light microscope, is unaltered after MeHg exposure.
It has been shown that mercury raises the threshold of activation in rod cells [30]. This study examined one aspect of threshold activation, outward K+ currents in bipolar cells of the adult zebrafish retina as one potential mechanism to explain changes in visual responses due to developmental MeHg and/or SeMet exposure. Clearly, central nervous system integration with the optic tectum and/or cerebellum, altered function of the optic nerve, and/or sensorimotor deficiencies are all additional mechanisms that also could be involved. Lesions in brain regions important to visual discrimination, e.g., occipital lobe and striate cortex, after postnatal exposures to MeHg have been noted and have led to restricted peripheral vision [57, 58]. In fishes, the optic tectum is the parallel brain region and it would not be unexpected to find structural and/or functional alterations there, as well.
Depolarization-elicited outward K+ currents have many functions in cells, such as repolarizing the membrane after an action potential and spacing repetitive responses. As a result, these currents are actively involved in regulating the membrane potential, ultimately effecting calcium entry and neurotransmitter release. Inhibition of outward K+ currents will increase or prolong the excitability of cells, while, enhancement of outward K+ currents will increase the hyperpolarization of the membrane, decreasing excitation of the cells [59-65]. As retinal bipolar cells in many species, including zebrafish [26], do not produce action potentials, altered K+ current amplitude would predominantly affect subsequent neurotransmitter release onto postsynaptic amacrine and ganglion cells.
Many different drugs have been shown to affect the amplitude of K+ currents, with both enhancement [62-64] and suppression [60, 61, 66, 67] reported. In retina, depolarization-elicited K+ currents in bipolar cells are modified by dopamine and cannabinoids [68, 69]. In these studies, the compound of interest was applied exogenously to the preparation. In our study, however, zebrafish were developmentally exposed to MeHg and then allowed to complete development under normal conditions. Physiological recordings were also made using standard internal and external solutions that did not contain MeHg. Thus, the effects of MeHg exposure on bipolar cell responses most likely represent long-lasting changes that occur initially in development rather than from short term exposure to the toxicant.
For bipolar cells expressing IK, co-exposure with SeMet appears to suppress current enhancement following MeHg exposure, suggesting SeMet exposure helps to mitigate the effects of MeHg. This agrees with behavioral data (Fig. 5) in which visual responses recorded in fish co-exposed to MeHg and SeMet at a 1:1 ratio (either 0.03μM MeHg/SeMet or 0.1μM MeHg/SeMet) were not significantly different from controls.
The amplitude of the transient A-current was also similar to controls in bipolar cells the 0.03μM MeHg/SeMet retinas. However, the highest current amplitudes in these cells did not occur as a result of MeHg exposure, but in cells that were co-exposed to both compounds. This suggests co-exposure enhances depolarization elicited K+ current activity in these cells. It is unclear how developmental exposure to MeHg would differentially alter voltage-gated outward K+ currents in zebrafish bipolar cells. MeHg exposure occurred during the first 24hpf. Eye morphogenesis in zebrafish begins at 12hpf with evagination of left and right optic primordia from the neural keel. The primordia undergo structural changes and rotation over the next 12 hours resulting in well-formed optic cups at 24hpf. At this time, development of the neural retina begins in the inner (vitreal) to outer (scleral) direction [70, 71]. Thus, formation of retinal neurons occurred after the time period of MeHg exposure. However, exposure during this time was sufficient to permanently affect K+ channels, possibly by altering protein expression and/or organization of subunits that form the ion channels. These could result in K+ channels with different kinetics and/or ion permeabilities compared to those in control animals. Another possibility is that MeHg exposure altered the formation of specific types of bipolar cells. There are 17 morphological types of bipolar cells in the zebrafish retina [72]. Though we did not examine these individual cell types here, we were able to correlate cell morphology with channel activity. For example, though IK and IA were both identified in monostratified cells (with terminals restricted to one sublamina in the inner plexiform layer), multistratified cells with terminals in both sublaminae expressed only IA. It seems clear from these data that SeMet provides some level of protection against these alterations in either the structure or function of these cells.
Regardless of the mechanism, we have demonstrated that depolarization elicited outward K+ currents are enhanced ~2x on average in retinal bipolar neurons that were developmentally exposed to MeHg (Figs. 6, 7). As noted above, this would cause increased hyperpolarization and decreased excitability in the treated cells. Similar hyperpolarization of cultured renal cell membranes following MeHg exposure has been reported [73], thus, such a physiological response to MeHg may be a characteristic inherent to all cell membranes and may indicate an important general mechanism of MeHg toxicity.
When combined with the results from our visual behavior tests, the change in outward K+ current amplitude in bipolar cells may provide one potential mechanism to help explain the delayed responses observed. Depolarization of the bipolar cells would activate outward K+ currents. The higher amplitude of these currents in treated cells would move the membrane potential to values more hyperpolarized to those observed in control cells. As a result, the cells would require a greater stimulus, or longer time, to depolarize and open the voltage-gated calcium channels. Thus, the responses of the bipolar cells would be more phasic [73] with a longer time between responses compared to responses in bipolar cells from untreated retinas.
Behaviorally, the neuronal refractory period was expressed by MeHg-treated individuals displaying a reaction sequence different from control fish. Under conditions of no MeHg or SeMet, zebrafish were consistently and constantly reacting to the black bar each time it appeared in the fish’s field of vision. Methylmercury-treated fish, however, would display variable lengths of a refractory period in which they did not react to the visual stimulus. Thus, over the course of the 5 min test, there would be moments of reaction similar to control fish followed by moments without eliciting an escape response as the fish either would swim past the revolving black bar or remain stationary as the visual stimulus approaches it. The possibility exists that this behavior is due, in part, to the prolonged hyperpolarization phase of the retinal neurons and the resultant decrease in visual signals sent to higher brain centers for processing. However, we cannot exclude the possibility that other structures within the zebrafish visual system are also altered by MeHg exposure, as has been shown in other preparations [30, 57, 58]. In fact, it is highly likely that these other regions are also sensitive and that it is the combined effect of MeHg exposure on various neural circuits that leads to the changes in visual behaviors observed.
In summary, this study indicates that developmental MeHg exposure, particularly during the initial stages of nerve growth and differentiation, induces behavioral alterations that extend into adulthood. While no gross morphological abnormalities were observed, functional changes in retinal activity correlate with the behavioral responses to visual stimuli. Importantly, developmental Se co-exposure in the form of SeMet can ameliorate these altered behavioral expressions and the prolonged hyperpolarization of retinal bipolar cells. These data add to the growing evidence that Se-Hg interactions, regardless of taxonomic classification, can affect both fundamental physiological process and the behaviors that depend upon them.
Acknowledgments
The authors thank Greg Barski of the UWM Great Lakes WATER Institute Machine Shop for assistance in the design and construction of the holding and testing chambers for the visual stimulus apparatus. Histology slides were prepared by Mass Histology Service (Worchester, MA). The authors acknowledge David M Lovinger for helpful discussions. Research was supported by NIEHS grants ES04184, ES012891, and a Great Lakes Native American Research Center for Health (NARCH) grant through the Indian Health Service (1U26 94 00014). Research was conducted under University of Wisconsin-Milwaukee IACUC protocol 05-06 #17.
Footnotes
Publisher's Disclaimer: This is a PDF file of an unedited manuscript that has been accepted for publication. As a service to our customers we are providing this early version of the manuscript. The manuscript will undergo copyediting, typesetting, and review of the resulting proof before it is published in its final citable form. Please note that during the production process errors may be discovered which could affect the content, and all legal disclaimers that apply to the journal pertain.
References
- 1.Clarkson TW. The three modern faces of mercury. Environ Health Perspect. 2002;110(suppl 1):11–23. doi: 10.1289/ehp.02110s111. [DOI] [PMC free article] [PubMed] [Google Scholar]
- 2.Dellinger J, Malek L, Beattie M. Mercury contamination of fish in the Ojibwa diet: II. Sensory evoked responses in rats fed walleye. Wat Air Soil Pollut. 1995;80:77–83. [Google Scholar]
- 3.Saldana M, Collins CE, Gale R, Backhouse O. Diet-related mercury poisoning resulting in visual loss. Br J Opthalmol. 2006;90:1432–1434. doi: 10.1136/bjo.2006.094821. [DOI] [PMC free article] [PubMed] [Google Scholar]
- 4.Tanan CL, Ventura DF, de Souza JM, Grotzner SR, Mela M, Gouveia A, Oliveira-Ribeiro CA. Effects of mercury intoxication on the response of horizontal cell responses of the retina of thraira fish (Hoplias malabaricus) Braz J Med Biol Res. 2006;39:987–995. doi: 10.1590/s0100-879x2006000700017. [DOI] [PubMed] [Google Scholar]
- 5.Mattsson JL, Miller E, Alligood JP, Koering JE, Levin SG. Early effects of methylmercury on the visual evoked response in the dog. Neurotoxicol. 1981;2:499–514. [PubMed] [Google Scholar]
- 6.Yokoo EM, Valente JG, Grattan L, Schmidt SL, Platt I, Silbergeld EK. Low level methylmercury exposure affects neuropsychological function in adults. Environ Health. 2003;2:8–18. doi: 10.1186/1476-069X-2-8. [DOI] [PMC free article] [PubMed] [Google Scholar]
- 7.Murata K, Grandjean P, Dakeishi M. Neurophysiological evidence of methylmercury neurotoxicity. Am J Ind Med. 2007 doi: 10.1002/ajim.20471. in press. [DOI] [PubMed] [Google Scholar]
- 8.Gilbert SG, Rice DC, Burbacher TM. Fixed interval/fixed ratio performance in adult monkeys exposed in utero to methylmercury. Neurotoxicol Teratol. 1996;18:539–46. doi: 10.1016/0892-0362(96)00081-5. [DOI] [PubMed] [Google Scholar]
- 9.Cagiano R, De Salvia MA, Renna G, Tortella E, Braghiroli D, Parenti C, Zanoli P, Baraldi M, Annau Z, Cuomo V. Evidence that exposure to methylmercury during gestation induces behavioral and neurochemical changes in offspring of rats. Neurotoxicol Teratol. 1990;12:23–28. doi: 10.1016/0892-0362(90)90108-o. [DOI] [PubMed] [Google Scholar]
- 10.Weber DN. Dose-dependent effects of developmental mercury exposure on C-start escape responses of larval zebrafish Danio rerio. J Fish Biol. 2006;69:75–94. [Google Scholar]
- 11.Rice DC. Evidence for delayed neurotoxicity produced by methylmercury. Neurotoxicol. 1996;17:583–596. [PubMed] [Google Scholar]
- 12.Chen C, Zhao J, Li B, Liu S, Zhang P, Chai Z. The roles of serum selenium and selenoproteins on mercury toxicity in environmental and occupational exposure. Environ Health Perspect. 2006;114:297–301. doi: 10.1289/ehp.7861. [DOI] [PMC free article] [PubMed] [Google Scholar]
- 13.Watanabe C. Selenium deficiency and brain functions: the significance for methylmercury toxicity. Nippon Eiseigaku Zasshi. 2001;55:581–589. doi: 10.1265/jjh.55.581. [DOI] [PubMed] [Google Scholar]
- 14.Watanabe C, Yoshida K, Kasanuma Y, Kun Y, Satoh H. In utero methylmercury exposure differentially affects the activities of selenoenzymes in the fetal mouse brain. Environ Res. 1999;80:208–214. doi: 10.1006/enrs.1998.3889. [DOI] [PubMed] [Google Scholar]
- 15.Cuvin-Aralar ML, Furness RW. Mercury and selenium interaction: a review. Ecotoxicol Environ Saf. 1991;21:348–364. doi: 10.1016/0147-6513(91)90074-y. [DOI] [PubMed] [Google Scholar]
- 16.Hamilton SJ, Holley KM, Buhl KJ, Bullard FA. Selenium impacts on razorback sucker, Colorado: Colorado River III. Larvae Ecotoxicol Environ Saf. 2005;61:168–189. doi: 10.1016/j.ecoenv.2004.07.004. [DOI] [PubMed] [Google Scholar]
- 17.Hamilton SJ. Review of selenium toxicity in the aquatic food chain. Sci Total Environ. 2004;326:1–31. doi: 10.1016/j.scitotenv.2004.01.019. [DOI] [PubMed] [Google Scholar]
- 18.Aoshima K, Kasuya M. Interactions between mercuric chloride and sodium selenite on cultured rat cerebrum. Toxicol Lett. 1980;6:181–6. doi: 10.1016/0378-4274(80)90189-7. [DOI] [PubMed] [Google Scholar]
- 19.Reed MN, Paletz EM, Newland MC. Gestational exposure to methylmercury and selenium: effects on a spatial discrimination reversal in adulthood. Neurotoxicol. 2006;27:721–732. doi: 10.1016/j.neuro.2006.03.022. [DOI] [PMC free article] [PubMed] [Google Scholar]
- 20.Hawkes WC, Willhite CC, Omaye ST, Cox DN, Choy WN, Tarantal AF. Selenium kinetics, placental transfer, and neonatal exposure in cynomolgus macaques (Macaca fasicularis) Teratol. 1994;50:148–159. doi: 10.1002/tera.1420500209. [DOI] [PubMed] [Google Scholar]
- 21.Unrine JM, Jackson BP, Hopkins WA, Romanek C. Isolation and partial characterization of proteins involved in maternal transfer of selenium in the western fence lizard (Sceloperous occidentalis) Environ Chem Toxicol. 2006;25:1864–1867. doi: 10.1897/05-598r.1. [DOI] [PubMed] [Google Scholar]
- 22.Nüsslein-Volhard C, Dahm R. Zebrafish: A Practical Approach. Oxford, England: Oxford University Press; 2002. [Google Scholar]
- 23.Li L, Dowling JE. A dominant form of inherited retinal degeneration caused by non-photoreceptor cell-specific mutation. PNAS. 1997;94:11645–11650. doi: 10.1073/pnas.94.21.11645. [DOI] [PMC free article] [PubMed] [Google Scholar]
- 24.Li L, Dowling JE. Zebrafish visual sensitivity is regulated by a circadian clock. Vis Neurosci. 1998;15:851–7. doi: 10.1017/s0952523898155050. [DOI] [PubMed] [Google Scholar]
- 25.Nawrocki L, BreMiller R, Streisinger G, Kaplan M. Larval and adult visual pigments of the zebrafish, Brachydanio rerio. Vision Res. 1985;25:1569–76. doi: 10.1016/0042-6989(85)90127-0. [DOI] [PubMed] [Google Scholar]
- 26.Connaughton VP, Maguire G. Differential expression of voltage-gated K+ and Ca2+ currents in bipolar cells in the zebrafish retinal slice. Eur J Neurosci. 1998;10:1350–62. doi: 10.1046/j.1460-9568.1998.00152.x. [DOI] [PubMed] [Google Scholar]
- 27.Connaughton V, Nelson R. Axonal stratification patterns and glutamate-gated conductance mechanisms in zebrafish retinal bipolar cells. J Physiol. 2000;524:135–46. doi: 10.1111/j.1469-7793.2000.t01-1-00135.x. [DOI] [PMC free article] [PubMed] [Google Scholar]
- 28.Korogi Y, Takahashi M, Hirai T, Ikushima I, Kitajima M, Sugahara T, Shigematsu Y, Okajima T, Mukuno K. Representation of the visual field in the striate cortex: comparison of MR findings with visual field deficits in organic mercury poisoning (Minamata Disease) AJNR Am J Neuroradiol. 1997;18:1127–1130. [PMC free article] [PubMed] [Google Scholar]
- 29.Berlin M, Grant CA, Hellberg J, Hellstrüm J, Schütz A. Neurotoxicity of methylmercury in squirrel monkeys: cerebral cortical pathology, interference with scotopic vision, and changes in operant behavior. Arch Environ Health. 1975;30:340–348. doi: 10.1080/00039896.1975.10666717. [DOI] [PubMed] [Google Scholar]
- 30.Fox DA, Sillman AJ. Heavy metals affect rod, but not cone, photoreceptors. Science. 1979;206:78–80. doi: 10.1126/science.314667. [DOI] [PubMed] [Google Scholar]
- 31.Tessier-Lavigne M, Mobbs P, Attwell D. Lead and mercury toxicity and the rod light response. Invest Opthalmol Vis Sci. 1985;26:1117–1123. [PubMed] [Google Scholar]
- 32.Heisinger JF, Green W. Mercuric chloride uptake by eggs of the ricefish and resulting teratogenic effects. Bull Environ Contam Toxicol. 1975;14:665–73. doi: 10.1007/BF01685240. [DOI] [PubMed] [Google Scholar]
- 33.Sakaizumi M. Effect of inorganic salts on mercury-compound toxicity to the embryos of the Medaka, Oryzias latipes. J Fac Sci. 1980;14:369–384. [Google Scholar]
- 34.Kumar A, Gupta AK. Acute toxicity of mercury to the fingerlings of Indian major carps (catla, rohu and mrigal) in relation to water hardness and temperature. J Environ Biol. 2006;27:89–92. [PubMed] [Google Scholar]
- 35.Ram A, Rokade MA, Borole DV, Zingde MD. Mercury in sediments of Ulhas estuary. Mar Pollut Bull. 2003;46:846–57. doi: 10.1016/S0025-326X(03)00065-1. [DOI] [PubMed] [Google Scholar]
- 36.Sterba G. The Aquarium Encyclopedia. Cambridge, MA: The MIT Press; 1986. p. p104. [Google Scholar]
- 37.Liao CY, Zhou OF, Fu JJ, Shi JB, Yuan CG, Jiang GB. Interaction of methylmercury and selenium on the bioaccumulation and histopathology in medaka (Oryzias latipes) Environ Toxicol. 2007;22:69–77. doi: 10.1002/tox.20236. [DOI] [PubMed] [Google Scholar]
- 38.Heisinger JF, Green W. Mercuiric chloride uptake by eggs of the ricefish and resulting teratogenic effects. Bull Environ Contam Toxicol. 1975;14:665–673. doi: 10.1007/BF01685240. [DOI] [PubMed] [Google Scholar]
- 39.Ribeyre F, Amiard-Triquet C, Boudou A, Amiard JC. Experimental study of interactions between five trace elements—Cu, Ag, Se, Zn, and Hg—toward their bioaccumulation by fish (Brachydanio rerio) from the direct route. Ecotoxicol Environ Saf. 1995;32:1–11. doi: 10.1006/eesa.1995.1078. [DOI] [PubMed] [Google Scholar]
- 40.Tamm C, Duckworth J, Hermanson O, Ceccatelli S. High susceptibility of neural stem cells to methylmercury toxicity: effects on cell survival and neuronal differentiation. J Neurochem. 2006;97:69–78. doi: 10.1111/j.1471-4159.2006.03718.x. [DOI] [PubMed] [Google Scholar]
- 41.Parran DK, Barone S, Mundy WR. Methylmercury decreases NGF-induced TrkA autophosphorylation and neurite outgrowth in PC 12 cells. Bran Res Dev Brain Res. 2003;141:71–81. doi: 10.1016/s0165-3806(02)00644-2. [DOI] [PubMed] [Google Scholar]
- 42.Leong CC, Syed NI, Lorscheider FL. Retrograde degeneration of neurite membrane structural integrity of nerve growth cones following in vitro exposure to mercury. Neuroreport. 2001;12:733–737. doi: 10.1097/00001756-200103260-00024. [DOI] [PubMed] [Google Scholar]
- 43.Miura K, Himeno S, Koide N, Imura N. Effects of methylmercury and inorganic mercury on the growth of nerve fibers in cultured chick dorsal root ganglia. Tohoku J Exp Med. 2000;192:195–210. doi: 10.1620/tjem.192.195. [DOI] [PubMed] [Google Scholar]
- 44.Prati M, Gornati R, Boracchi P, Biganzoli E, Fortaner S, Pietra R, Sabbioni E, Bernardini G. A comparative study of the toxicity of mercury dichloride and methylmercury, assayed by the Frog Embryo Teratogenesis Assay—Xenopus (FETAX) Altern Lab Anim. 2002;30:23–32. doi: 10.1177/026119290203000104. [DOI] [PubMed] [Google Scholar]
- 45.Fredriksson A, Gårdlund AT, Bergman K, Oskarsson A, Ohlin B, Danielsson B, Archer T. Effects of maternal dietary supplementation with selenite on the postnatal development of rat offspring exposed to methylmercury in utero. Pharmacol Toxicol. 1993;72:377–382. doi: 10.1111/j.1600-0773.1993.tb01348.x. [DOI] [PubMed] [Google Scholar]
- 46.Browman HI. Embryology, ethology and ecology of ontogenetic critical periods in fish. Brain Behav Evol. 1989;34:5–12. doi: 10.1159/000116486. [DOI] [PubMed] [Google Scholar]
- 47.Gellert G, Heinrichsdorff J. Effect of age on the susceptibility of zebrafish eggs to industrial wastewater. Wat Res. 2001;15:3754–3757. doi: 10.1016/s0043-1354(01)00084-7. [DOI] [PubMed] [Google Scholar]
- 48.Dave G, Xiu RQ. Toxicity of mercury, copper, nickel, lead, and cobalt to embryos and larvae of zebrafish, Brachydanio rerio. Arch Environ Contam Toxicol. 1991;21:126–134. doi: 10.1007/BF01055567. [DOI] [PubMed] [Google Scholar]
- 49.Alvarez MC, Murphy CA, Rose KA, McCarthy ID, Fuiman LA. Maternal body burdens of methylmercury impair survival skills of offspring in Atlantic croaker (Micropogonias undulates) Aquat Toxicol. 2006;80:329–337. doi: 10.1016/j.aquatox.2006.09.010. [DOI] [PubMed] [Google Scholar]
- 50.Samson JC, Goodridge R, Olobatuyi F, Weis JS. Delayed effects of embryonic exposure of zebrafish (Danio rerio) to methylmercury (MeHg) Aquat Toxicol. 2001;51:369–376. doi: 10.1016/s0166-445x(00)00128-4. [DOI] [PubMed] [Google Scholar]
- 51.Weis P, Weis JS. Effects of embryonic pre-exposure to methylmercury and Hg2+ on larval tolerance in Fundulus heteroclitus. Bull Environ Contam Toxicol. 1983;31:530–534. doi: 10.1007/BF01605470. [DOI] [PubMed] [Google Scholar]
- 52.Weis JS, Smith G, Zhou T, Santiago-Bass C, Weis P. Effects of contaminants on behavior: biochemical mechanisms and ecological consequences. BioSci. 2001;51:209–217. [Google Scholar]
- 53.Pruess T, Osei-Bonsu PE, Weiss SA, Wang C, Faber DS. Neural representation of object approach in a decision-making motor circuit. J Neurosci. 2006;26:3454–3464. doi: 10.1523/JNEUROSCI.5259-05.2006. [DOI] [PMC free article] [PubMed] [Google Scholar]
- 54.Rowland WJ. Studying visual cues in fish behavior: a review of ethological techniques. Environ Biol Fish. 1999;56:285–305. [Google Scholar]
- 55.Rice DC, Gilbert SG. Effects of developmental exposure to methylmercury on spatial and temporal visual function in monkeys. Toxicol Appl Pharmacol. 1990;102:151–163. doi: 10.1016/0041-008x(90)90092-9. [DOI] [PubMed] [Google Scholar]
- 56.Evans HL, Garman RH, Laties VG. Neurotoxicity of methylmercury in the pigeon. Neurotoxicol. 1982;3:21–36. [PubMed] [Google Scholar]
- 57.Bahiga LM, Kotb NA, El-Dessoukey EA. Neurological syndromes produced by some toxic metals encountered industrially or environmentally. Z Ernahrungswiss. 1978;17:84–88. doi: 10.1007/BF02021115. [DOI] [PubMed] [Google Scholar]
- 58.Venable HL, Mills SH. Neurological and behavioral effects of intracranial administration of mercuric chloride on rats. J Toxicol Environ Health. 1977;3:871–876. doi: 10.1080/15287397709529620. [DOI] [PubMed] [Google Scholar]
- 59.Hille B. Potassium channels and chloride channels, In Ionic channels of excitable membranes. 2. Sunderland, MA: Sinauer Associates, Inc.; 1992. pp. p115–139. [Google Scholar]
- 60.Schechter LE. The potassium channels blockers 4-aminopyridine and tetraethylammonium increase the spontaneous basal release of [3H]-hydroxytryptamine in rat hippocampal slices. J Pharmacol Exp Therapeut. 1997;282:262–270. [PubMed] [Google Scholar]
- 61.Liu Y, Li X. Effects of salicylate on transient outward and delayed rectifier potassium channels in rat inferior colliculus neurons. Neurosci Lett. 2004;369:115–120. doi: 10.1016/j.neulet.2004.07.037. [DOI] [PubMed] [Google Scholar]
- 62.Yang S-K, Parkington HC, Blake AD, Keating DJ, Chen C. Somatostatin increases voltage-gated K+ currents in GH3 cells through activation of multiple somatostatin receptors. Endocrinol. 2005;146:4975–4984. doi: 10.1210/en.2005-0696. [DOI] [PubMed] [Google Scholar]
- 63.Liu L-Y, Fei X-W, Li Z-M, Zhang Z-H, Mei Y-A. Diclofenac, a nonsteriodal anti-inflammatory drug, activates the transient outward K+ current in rat cerebellar granule cells. Neuropharmacol. 2005;48:918–926. doi: 10.1016/j.neuropharm.2004.12.020. [DOI] [PubMed] [Google Scholar]
- 64.Aiello EA, Walsh MP, Cole WC. Phosphorylation by protein kinase A enhances delayed rectifier K+ current in rabbit vascular smooth muscle cells. Am J Physiol. 1995;268:H926–H934. doi: 10.1152/ajpheart.1995.268.2.H926. [DOI] [PubMed] [Google Scholar]
- 65.Aiello EA, Clement-Chomienne O, Sontag DP, Walsh MP, Cole WC. Protein kinase C inhibits delayed rectifier K+ current in rabbit vascular smooth muscle cells. Am J Physiol. 1996;271:H109–H119. doi: 10.1152/ajpheart.1996.271.1.H109. [DOI] [PubMed] [Google Scholar]
- 66.Hu C-L, Liu Z, Gao Z-Y, Zhang A-H, Mei Y-A. 2-iodomelatonin prevents apoptosis of cerebellar granule neurons via inhibition of A-type transient outward K+ currents. J Pineal Res. 2005;38:53–61. doi: 10.1111/j.1600-079X.2004.00174.x. [DOI] [PubMed] [Google Scholar]
- 67.Bringmann A, Skatchkov SN, Biedermann B, Faude F, Reichenbach A. Alterations of potassium channel activity in retinal Muller cells induced by arachidonic acid. Neurosci. 1998;86:1291–1306. doi: 10.1016/s0306-4522(98)00079-7. [DOI] [PubMed] [Google Scholar]
- 68.Yu C-J, Li L. Dopamine modulates voltage-activated potassium currents in zebrafish retinal ON bipolar cells. J Neurosci Res. 2005;82:368–376. doi: 10.1002/jnr.20637. [DOI] [PubMed] [Google Scholar]
- 69.Fan S-F, Yazulla S. Reciprocal inhibition of voltage-gated potassium currents (IK(V)) by activation of cannabinoid CB1 and dopamine D1 receptors in ON bipolar cells of goldfish retina. Visual Neurosci. 2005;22:55–63. doi: 10.1017/S0952523805221089. [DOI] [PubMed] [Google Scholar]
- 70.Schmitt FA, Dowling JE. Early eye morphogenesis in the zebrafish, Brachydanio rerio. J Comp Neurol. 1994;344:532–42. doi: 10.1002/cne.903440404. [DOI] [PubMed] [Google Scholar]
- 71.Schmitt FA, Dowling JE. Early retinal development in the zebrafish, Danio rerio: light and electron microscopic analyses. J Comp Neurol. 1999;404:515–36. [PubMed] [Google Scholar]
- 72.Connaughton VP, Graham D, Nelson R. Identification and morphological classification of horizontal, bipolar, and amacrine cells within the zebrafish retina. J Comp Neurol. 2004;77:371–85. doi: 10.1002/cne.20261. [DOI] [PubMed] [Google Scholar]
- 73.Jungwirth A, Ritter M, Paulmichl M, Lang F. Activation of cell membrane potassium conductance by mercury in cultured renal epithelioid (MDCK) cells. J Cell Physiol. 1991;146:25–33. doi: 10.1002/jcp.1041460105. [DOI] [PubMed] [Google Scholar]


