Abstract
We describe a novel approach to sorting class averages of a structure in multiple conformational states in order to generate 3D reconstructions that account for conformational variability present in the sample. The method assumes that the relative Euler angles between class averages are known, then uses a common lines approach to match any given class against a set of distinct conformations from a selected view of the structure. We show the effectiveness of the method both on model data and on an experimental dataset for which the conformational variability is limited to a defined region within the structure. During our studies of hepatitis C virus (HCV) internal ribosome entry site (IRES) interaction with the human translation initiation factor eIF3, we observed that the IRES RNA included a flexible region holding multiple conformations. While current classification methods were used to produce two-dimensional averages of the complex showing these different conformations, no method existed for relating these averages in three dimensions. Our approach overcame these limitations, giving us structural insight that was previously not possible.
Keywords: Cryo-EM, conformational flexibility, common lines, translation initiation
Introduction
Single-particle electron microscopy relies on merging data from different views of the particle of interest to produce a 3D model. There are a number of methods for calculating the spatial relationship between different particle views (Harauz and Ottensmeyer 1984; Radermacher et al. 1987; van Heel 1987), but most make the assumption that the particle views being averaged are of molecules in the same conformation. A problem arises when macromolecular complexes exhibit conformational flexibility and/or alternative assemblies (Staley and Guthrie 1998; Orlova et al. 1999; Roseman et al. 2001; Saibil et al. 2001; Yang et al. 2002; Brink et al. 2004; Leschziner and Nogales 2007). If this fact is not taken into account, the result is a low resolution and/or incomplete structure with an averaged-out variable region. While sometimes a biochemical approach can be used to isolate specific assemblies or trap conformational states, structural heterogeneity cannot always be resolved this way. Classification of different particle views is a common step in single-particle reconstructions in order to average 2D images and improve the signal-to-noise ratio, thus making the subsequent assignment of Euler angles easier. Multivariate statistical analysis and classification have been widely used to obtain these 2D class averages (van Heel 1984). These methods, given a large enough dataset, also have the potential to classify particles that are in different structural states (Burgess et al. 2004; White et al. 2004). Even if particle views can be classified into conformational states in 2D, the problem of relating the 2D projections to consistent models in 3D space still exists. One method of dealing with conformational flexibility is to use multiple models, which cover all conformations, in a projection matching approach (Valle et al. 2002; Brink et al. 2004; Falke et al. 2005). Although this can be successful, it is often the case that such models are not available. Unsupervised methods using maximum likelihood (Scheres et al. 2007) or cluster tracking in multidimensional space (Fu et al. 2007), have been shown to be successful, but are limited by the need for very large datasets.
The requirement for a methodology to sort out different views of multiple conformations coexisting in an EM sample became clear during our single-particle studies of the translation initiation factor eIF3 interaction with the hepatitis C viral (HCV) internal ribosome entry site (IRES) (Siridechadilok et al. 2005). We observed a region of the IRES with multiple conformations that protruded from the more stable body of the complex. We first used a model of eIF3 alone to assign Euler angles to our eIF3-IRES images by projection matching. When we then examined the variance of eIF3-IRES class averages assigned to a given view, it became obvious that the IRES was assuming a multiplicity of conformations. We therefore used focused classification within regions of high variance to generate unique conformation averages (subclasses) for each projection view (Burgess et al. 2004). The present work describes how 2D subclass averages were related in 3D space using an approach based on cross-correlation of common lines (CCCL). The principles of our method are demonstrated here both for synthetic and real experimental data.
Methods
Synthetic Data
For development and testing purposes, the crystallographic structure of the Klenow fragment of DNA polymerase I (1KFD) (Beese et al. 1993) was used to generate an artificial EM data set (Leschziner and Nogales 2006). A domain of the Klenow fragment was moved to create two new structures that, while not biologically relevant, were a reasonable model for a particle with a larger stable region connected to a smaller flexible domain (Fig. 1a). The three pdb structures of the Klenow fragment were filtered to ∼20Å resolution to model a typical cryo-EM structure. The test dataset contained 150 random projections from each of the three models, representing what would be class averages of different views of the particle in the experimental case. Datasets with different signal-to-noise ratios were created by adding increasing amounts of Gaussian noise (Fig. 1c). The dataset in which the standard deviation of the noise matched that of the original projection (1:1) most closely resembled what one might obtain after classification and averaging of single-particle images (Fig. 1b). Euler angles were assigned to these projections by projection matching using reprojections, at 15° angular step, of a model that was reconstructed from 150 randomly selected projections from all conformations. The initial reference model had no error in angular assignment, but was an average of all conformations, and therefore had low density in the variable region. Alignment and assignment of Euler angles by projection matching to an averaged heterogeneous structure introduces similar errors to what would be expected in real data.
Figure 1.
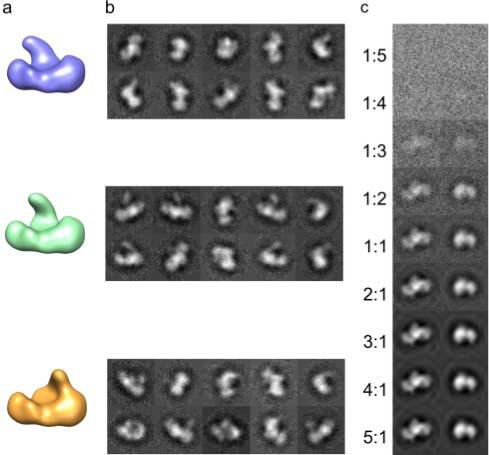
Model structures used for testing. a, Three test models showing a distinct conformational difference in the position of a single domain. b, Projections of the test models at random Euler angles with sufficient added Gaussian noise to simulate the appearance of typical class-average images. c, Projections of the test model with increasing noise added, indicated is the ratio between the standard deviation of the added Gaussian noise and that of the initial projection image.
Experimental eIF3-IRES Data
Cryo-EM images of eIF3-IRES were collected on a CM200 microscope (200keV) at 50,000 magnification using an electron exposure of 15−20e/Å2 , with a defocus range of −3.2 to −4.5 μm. Micrographs were scanned on a Nikon Coolscan 8000ED with a pixel size corresponding to 2.45 Å at the specimen. About 19,000 particles were manually picked, and the CTF was corrected by phase flipping. All particles were aligned to reprojections of a previous eIF3 model taken at a 15° angular step (a total of 186 reprojections). Class averages were calculated for all particles that aligned to a particular reprojection, resulting in ∼100 particles per average. For each class-average image, a variance image was also calculated to give an indication of the conformational flexibility present in that view. Regions of high variance were used to generate a mask so that the region could be further characterized by focused classification. Multivariate statistical analysis (MSA) and hierarchical classification were used to “sub-classify” the raw images assigned to a certain view (contributing to a certain class-average) based on the masked region of high variance (van Heel 1984; Burgess et al. 2004). Of the total dataset comprising 186 views, 64 (for which the variance was large and well-defined) were further classified into six different conformations with between 10 and 20 raw images per average (see Fig. 2). Six was initially chosen to be a large enough number to potentially cover all conformational variability, while allowing enough particles per group to build up significant signal in the 2D averages.
Figure 2.
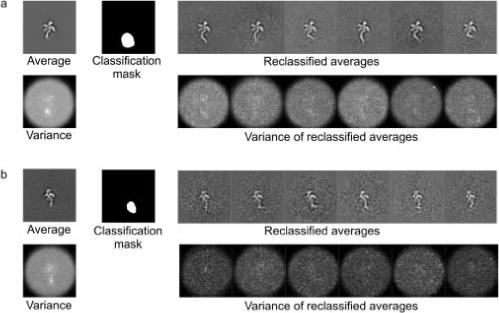
Classifying heterogeneity in experimental 2D projections of eIF3-IRES. a and b show an example of the reclassification for two distinct 2D projections (views). The calculated variance for the initial average shows a distinct region of high variability. By masking this region and subclassifying the particles assigned to this view based on the density within the mask, a further set of class averages is created. This second classification allows multiple conformations of the variable region to be distinguished. The calculated variance for the reclassified averages shows more consistent low values across the image. Variance within the region of the image corresponding to the protein complex appears to be above background. This is likely the result of small alignment errors and/or remaining conformational heterogeneity within the protein complex itself.
Conformational sorting: cross-correlation of common lines (CCCL) approach
The goal of our approach was to identify a subset of distinct views that corresponded to each of the conformations, and could be used to generate consistent 3D reconstructions. These reconstructions would then be used as multiple references for projection matching of the full dataset.
Any two 2D projections of a 3D model share a common 1D projection, known as a common line (van Heel 1987). This can be used to assign relative Euler angles to 2D projections by calculating the cross-correlation between all 1D projections and finding the maximum. In practise this is carried out with class averages, which have improved signal. For our problem, the relative Euler angles of all 2D projections or class averages are estimated from projection matching against a single initial model that describes the general structure of the sample but not its conformational diversity; the common line between any two projections is therefore known. When multiple conformations are apparent in a single view, it is expected that the cross-correlation of common lines (CCCL) between any pair of distinct (corresponding to different views) class averages will be higher when they correspond to the same conformers than when they correspond to different ones. Our strategy is to identify reference images, from the same view of a molecule, that represent the different conformations present in the sample. Then, given these conformational references, of known Euler angles, we can determine the conformation to which any other projections, with different, but still known Euler angles, belongs, by finding the reference that results in the highest CCCL.
The starting point for the approach is a set of 2D images in which heterogeneity is apparent. For the test data these 2-D images consisted of reprojections of three distinct models with added noise. For the real data sub-classified class averages were used. All images had Euler angles assigned by projection matching to a model that does not account for heterogeneity. The IMAGIC suit of programs (van Heel et al. 1996) was used for all image processing procedures. To start the approach a projection view was selected that clearly showed the conformational heterogeneity (Fig. 3a). Sub-classes or projections of this view that clearly show conformational heterogeneity were then used as conformational reference images. The angle of the common line between these reference images and all other images corresponding to different views was calculated from the assigned Euler angles using the ‘PREDICT_SINECORR_PEAKS’ function in the angular reconstitution program within IMAGIC. Using the sinogram program in IMAGIC, 1D projections were then calculated for all images and references over a 15° range, at a 1° step, around the determined common line angle. A 15° range was used because of the expected error in Euler angles assignment due to projection matching against reprojecions of a structure at 15° angular step. These sinograms (van Heel 1987) were used to find the CCCL. A sinogram correlation function (van Heel 1987) was calculated between each reference sinogram and all other sinograms. From this sinogram correlation function, the maximum CCCL for each comparison can be found, i.e. the highest CCCL within a 15° range of the estimated common line. An image was said to be in the same conformation as the reference to which its CCCL was highest (Fig. 3).
Figure 3.
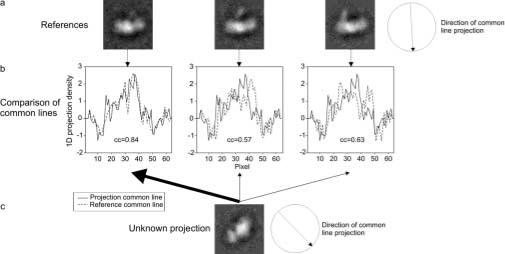
Cross-correlation of common lines to distinguish conformational states. a. Reference projections. All candidate projections will be designated as corresponding to one of the three conformations based on the highest cross-correlation of common lines with these references. b. Cross-correlation of common lines (CCCL), between each of the reference projections and the candidate, for the maximum CCCL within the known 15° angular range. c. Candidate projection, designated as being in the same conformational state as reference 1, due to its highest cross-correlation of common lines.
Results
Synthetic data
For the test data the input to the approach were 450 images, corresponding to 150 projections from each conformation of the model, with increasing amount of added noise. The Euler angle for each image was assigned by projection matching using a model that was an average of all conformations. From one particular view of the molecule three images were chosen for which conformational flexibility was clearly visible (Fig. 3a). These served as conformational reference images for further analysis. Common line cross-correlations were calculated for all common lines, using a 1° step within a 15° range, between the three conformational reference images and each one of the 450 images. For each comparison the value of the cross-correlation used was taken as being the maximum within the 15° range (Fig. 3b). An image was designated as being in the same conformation as that of the reference with which the highest cross-correlation coefficient was obtained (Fig. 3c). This procedure was carried out for data sets with different noise levels (see materials and methods section). For the noise level that most closely matched the real data (1:1), reconstructions were calculated for each of the three groups (Fig, 4 a,b,c).
Figure 4.
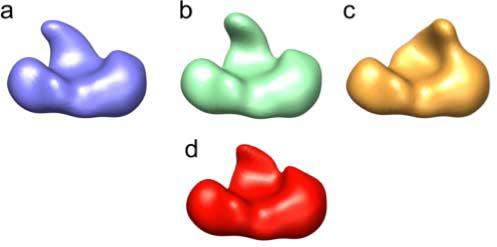
Model reconstructions. a, b and c, reconstructions of the sorted synthetic dataset, showing three distinct conformations of the variable domain (see Figure 1 for the original starting structures). d, reconstruction using a third of the total projections, randomly selected from the entire dataset.
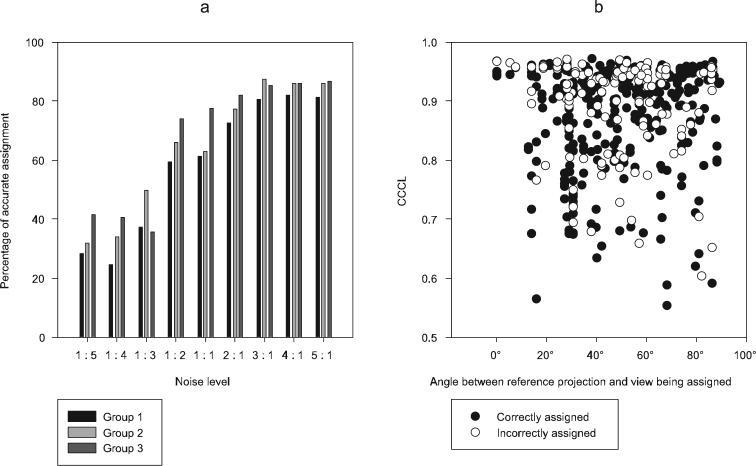
For the test data, the correct assignment of each image to its corresponding conformation is known a priori. Therefore, a true measure of how well the sorting has worked can be obtained for each different noise level dataset (Fig. 5a). From figure 5a it can be seen that at high noise levels (1:5 − 1:3) the percentage of correct assignment is close to what would be expected from randomly grouping images (33%). Accuracy of assignment increases between noise levels of 1:2 and 2:1. For a noise level of 3:1 the accuracy plateaus at ∼80%. The accuracy of assignment may have been expected to increase up to 100%. However Gaussian noise added to the images is not the only noise having an effect on the accuracy of CCCL. The initial alignment and projection matching of images to the starting structure with an undefined variable region introduces errors for both in plane alignment and Euler angle assignment. Searching CCCL over a 15° range should overcome some of the uncertainty in the Euler angle assignment, but no correction is made for any in plane alignment errors. Further analysis of the results was restricted to the noise level that most closely matched the real data (1:1). The percentage of correctly assigned projections for the whole dataset was observed to be 67%, (Table 1a) whereas randomly selecting images would have resulted in 33% correct assignment.
Figure 5.
Model data assignment results. a, graph showing the percentage accuracy of assignment within each classified group across various noise levels. b, graph showing the value of the maximum CCCL and success of assignment in relation to the distance between the Euler angles of the reference and the assigned view.
Table 1.
Assignment results using model data. For each group the number of individual projections for each confirmation is shown together with the overall correct sassignment. a, Initial results after CCCL. b, Results from multi reference alignment to the models built from the initial assignment.
| a | |||
|---|---|---|---|
| Number of projections | Group 1 | Group 2 | Group 3 |
| Conformation 1 | 100 | 35 | 13 |
| Conformation 2 | 41 | 88 | 19 |
| Conformation 3 | 22 | 17 | 110 |
| Assignment | 61% | 63% | 77% |
| b | |||
|---|---|---|---|
| Number of projections | Group 1 | Group 2 | Group 3 |
| Conformation 1 | 127 | 19 | 4 |
| Conformation 2 | 7 | 137 | 6 |
| Conformation 3 | 2 | 2 | 146 |
| Assignment | 93% | 87% | 94% |
If the group of correctly assigned images showed a preference for Euler angles closed to those of the reference images, the newly generated conformer structures will be poorly defined. To be more precise, in the 3D reconstruction for each conformer the heterogeneous region may only be well defined when looking along the view from which the reference was selected. For our test data it is possible to plot the CCCL together with the angular distance between the reference and the image (Fig. 5b). From this plot it is apparent that although there is a certain bias to higher CCCL when the reference is close in Euler space to the image being assigned, there is a good distribution of correct assignments across the whole range of angular distances. In spite of the modest success rate, the approach was successful at producing three reconstructions that clearly reflected the conformational flexibility of the whole dataset. This conclusion was further proved when these three reconstructions were used for further refinement of the whole data set using multi-reference projection matching (Brink et al. 2004; Falke et al. 2005). This final procedure resulted in a final misassignment of only 9% (Table 1b). As a control, a random selection of 150 images was taken from the mixed dataset and used to generate a reconstruction (Fig. 4d). This conformationally heterogeneous reconstruction had poorly defined density in the variable region, making any further refinement unfeasible.
eIF3-IRES data
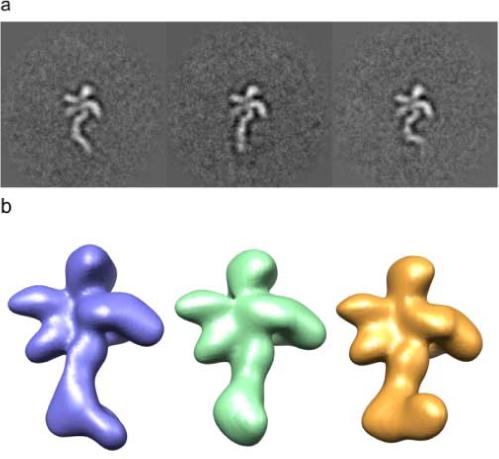
∼19,000 raw particle images of eIF3-IRES were assigned Euler angles and aligned using 186 reprojections from a structure of eIF3. All the raw images that aligned to a particular view were averaged, resulting in 186 class averages. The variance was calculated for each of the 186 averages. 64 showed significant areas of variance and were used for further subclassification. A mask was created for each class-average based on the area of high variance, and classification was then used for the area within the mask. These selected 64 classes corresponded to projections views that were particularly sensitive to the conformational flexibility in the sample and included sufficient coverage of Euler space to to provide reasonably isotropic 3D reconstructions. The remaining projections, in which no conformational flexibility was clearly discernable, likely because differences lie along the projection direction, were initially ignored. As in the calculation with the model data, three subclass averages from one projection view were chosen as conformational references, as they appeared to represent the three major conformations of the IRES based on relative abundance (Fig. 6a). For each of these three conformational references, the CCCL was calculated with each of the other 378 subclass averages (63 projection views × 6 subclasses). A given subclass-average was taken to be in the same structural conformation as the reference to which it had the highest cross-correlation of common lines, using a 15° angular range to account for the initial Euler angle assignment error. 3D reconstructions were then calculated for each of the three conformations using the assigned subclass averages for each of the projection views (Fig. 6b). These reconstructions were in turn used for further sorting of the full dataset using multi-reference projection matching of individual particle images (Fig. 6). The reconstruction coloured blue in figure 6b corresponds to a conformation of IRES that is almost identical to that observed when bound to the 40S ribosomal subunit (Spahn et al. 2001). This allowed the IRES density in our study to be used for alignment and the generation of a 40S-IRES-eIF3 model (Siridechadilok et al. 2005).
Figure 6.
3D conformational sorting of eIF3-IRES
(a) Conformational variability in 2D averages of eIF3-IRES described by three distinct conformations of IRES bound to eIF3 in a single projection view.
(b) Corresponding 3D reconstructions resulting from the application of the CCCL approach. The blue conformer corresponds closely to that of IRES bound to the 40S ribosome (Spahn et al. 2001).
Discussion
We have developed a method for sorting average projections of a structure in multiple conformational states in order to generate 3D reconstructions that account for conformational variability present in the sample. Preceding the application of our 3D sorting method, a number of conventional steps need to be carried out. First, angular assignment of individual particles or class averages must be obtained. This could have been done through projection matching to a reference structure that lacked the variable region (like for our experimental case), or to a reference that is the average of the whole population (as in our test with synthetic data). Conformational variability is then detected and sorted by subclassification within each class-average corresponding to a certain view. For our experimental data set, subclass averages were obtained using focused classification within a mask generated using the region of high 2D variance for each class (i.e. for each projection view). Alternatively, focused classification could use a mask generated by reprojection of a 3D mask generated using a 3D variance map, as recently proposed by Penzcek and co-workers (Penczek et al. 2006). The final, novel step is then the cross-correlation of common lines (CCCL) proposed here to relate the new 2D subclass averages in 3D space. For this last step, a projection view is selected for which the subclass averages are particularly distinct. These subclass averages, corresponding to a single view, but representing the conformers existent in the data, are used as conformational references for conformational assignment of the subclass averages in all other orientations. The subclasses for each orientation are then sorted based on the highest CCCL with one of the conformational references. It is important to remember that the common line between any two class averages is approximately known , as Euler angle assignments preceded our analysis. Particle images corresponding to different conformations of the macromolecular complex are sorted into distinct 3D reconstructions by means of 1) having an assigned relative angle, and 2) by conformational assignment across different projection views. Once a significant part of the data set has been assigned both Euler angles and conformation, multiple reconstructions that reflect the variability in the data set can be generated, then used for multi-reference refinement of all the images.
Here we demonstrate that the method works on model data as well as experimental images. A mixed set of projections (equivalent to experimental class averages) from models of Klenow fragment with a domain in different positions were sorted using three conformational references corresponding to a projection view for which the different conformations appeared most distinct. While conformational assignment was not 100% accurate, the resulting 3D reconstructions showed clear conformational differences, and could be used as starting models for further refinement and classification using projection matching.
We have shown that the method also works with real data. An eIF3-IRES structure in which conformational variability in the IRES RNA was clear from inspection of the 2D variance associated with class averages of different views of the complex, was subjected to the same processing as the model data. The structures of three IRES conformations bound to eIF3 were generated and subjected to further refinement. In one of these structures, the conformation of IRES corresponded to that seen in the 40S-IRES structure from Spahn et al. 2001. This enabled a model of the 40S-IRES-eIF3 complex to be proposed that provided new insight into the role of the initiation factor eIF3 (Siridechadilok et al. 2005).
Our approach should be applicable to other reconstruction problems involving heterogeneity, provided that a reasonable assignment of angles can be given to the projections before classification, and that the conformational states are distinctive enough to allow conformational sorting by CCCL. The first point requires the existence of a 3D structure similar enough to the one under study that can be used as a reference for Euler angle assignment. In the case of eIF3-IRES, where the major conformational variability was in the IRES RNA, the structure of eIF3 alone was used for this purpose. An alternative possibility would have been to generate an average 3D structure of the eIF3-IRES complex, for which the IRES will appeared smeared in the region of flexibility, but that would otherwise be a true representation of the invariable core. In cases of large, global structural changes, initial assignment of angles may be too inaccurate (either by matching to an existing reference or by pooling all the data together into an incorrect structure) to make our approach feasible.
In our experimental and test cases the variable area was small enough that angular assignments could be done relatively accurately, but large enough that the signal in the cross-correlation analysis was sufficient for conformational sorting. For eIF3-IRES this was facilitated by the high-contrast of RNA. For more subtle differences among conformers, the noise in the cross-correlation analysis may hamper our approach. A number of techniques could be used in future implementations to address this problem. One would involve the use of weights for the conformational assignments based on the relative values of the cross-correlation to the references. The other would be to use a maximum likelihood implementation of our method altogether, which is likely to be more robust when facing low signal-to-noise limitations.
A recent approach for detecting and characterizing conformational/biochemical heterogeneity in an EM sample is the use of bootstrap 3D variance calculation followed by focused classification (Penczek et al. 2006). This strategy would provide all the a priori requirements for the use of our CCCL approach, which would then be used to do the final 3D conformational sorting of the subclassified views. Thus, we believe that 3D variance and focused classification, followed by CCCL should prove a powerful and generally applicable scheme to generate multiple 3D references reflecting the heterogeneity of most EM samples.
Many macromolecular complexes are intrinsically flexible and exist in multiple conformations in solution. While cryo-EM and single-particle reconstruction are uniquely suited to visualize this native conformational flexibility, detection and sorting of heterogeneity is still an important challenge in this field (see Leschziner and Nogales, 2007 for a review of recent methodological efforts to analyze macromolecular flexibility and their application to a number of biological systems). The goal of this work was to develop a method that would allow heterogeneous cryo-EM single-particle data to be sorted when a model for the conformational flexibility does not exist a priori. As long as the conformational flexibility of the structure can be used for the subclassification of 2D class averages, the method described here makes it possible to build consistent 3D reconstructions.
Development of methods such as this will allow single-particle cryo-EM to overcome the problems associated with structural heterogeneity and will be crucial in understanding the dynamics of large macromolecular structures.
Acknowledgments
We thank Jennifer Doudna and Chris Fraser for purification of human eIF3, Andres Leschziner for help generating the synthetic data set, and both him and Robert Glaeser for comments on the manuscript. This work was supported in part by NIH grant GM062989, NCI, and the Office of Biological and Environmental Research of the US Department of Energy (EN). EN is a Howard Hughes Medical Institute Investigator. BS is a Thai Scholar.
Footnotes
Publisher's Disclaimer: This is a PDF file of an unedited manuscript that has been accepted for publication. As a service to our customers we are providing this early version of the manuscript. The manuscript will undergo copyediting, typesetting, and review of the resulting proof before it is published in its final citable form. Please note that during the production process errors may be discovered which could affect the content, and all legal disclaimers that apply to the journal pertain.
References
- Beese LS, Friedman JM, Steitz TA. Crystal structures of the Klenow fragment of DNA polymerase I complexed with deoxynucleoside triphosphate and pyrophosphate. Biochemistry. 1993;32:14095–101. doi: 10.1021/bi00214a004. [DOI] [PubMed] [Google Scholar]
- Brink J, Ludtke SJ, Kong Y, Wakil SJ, Ma J, Chiu W. Experimental verification of conformational variation of human fatty acid synthase as predicted by normal mode analysis. Structure (Camb) 2004;12:185–91. doi: 10.1016/j.str.2004.01.015. [DOI] [PubMed] [Google Scholar]
- Burgess SA, Walker ML, Thirumurugan K, Trinick J, Knight PJ. Use of negative stain and single-particle image processing to explore dynamic properties of flexible macromolecules. J Struct Biol. 2004;147:247–58. doi: 10.1016/j.jsb.2004.04.004. [DOI] [PubMed] [Google Scholar]
- Falke S, Tama F, Brooks CL,, 3rd, Gogol EP, Fisher MT. The 13 angstroms structure of a chaperonin GroEL-protein substrate complex by cryoelectron microscopy. J Mol Biol. 2005;348:219–30. doi: 10.1016/j.jmb.2005.02.027. [DOI] [PubMed] [Google Scholar]
- Fu J, Gao H, Frank J. Unsupervised classification of single particles by cluster tracking in multi-dimensional space. J Struct Biol. 2007;157:226–39. doi: 10.1016/j.jsb.2006.06.012. [DOI] [PubMed] [Google Scholar]
- Harauz G, Ottensmeyer FP. Nucleosome reconstruction via phosphorus mapping. Science. 1984;226:936–40. doi: 10.1126/science.6505674. [DOI] [PubMed] [Google Scholar]
- Leschziner A, Nogales E. Visualizing flexibility at molecular resoluiton: analysis of heterogeneity in single-paticle electron microscopy reconstructions. Ann. Rev. Biophys. Biomol. Struct. 2007 doi: 10.1146/annurev.biophys.36.040306.132742. in press. [DOI] [PubMed] [Google Scholar]
- Leschziner AE, Nogales E. The orthogonal tilt reconstruction method: an approach to generating single-class volumes with no missing cone for ab initio reconstruction of asymmetric particles. J Struct Biol. 2006;153:284–99. doi: 10.1016/j.jsb.2005.10.012. [DOI] [PubMed] [Google Scholar]
- Orlova EV, Sherman MB, Chiu W, Mowri H, Smith LC, Gotto AM,, Jr. Three-dimensional structure of low density lipoproteins by electron cryomicroscopy. Proc Natl Acad Sci U S A. 1999;96:8420–5. doi: 10.1073/pnas.96.15.8420. [DOI] [PMC free article] [PubMed] [Google Scholar]
- Penczek PA, Frank J, Spahn CM. A method of focused classification, based on the bootstrap 3D variance analysis, and its application to EF-G-dependent translocation. J Struct Biol. 2006;154:184–94. doi: 10.1016/j.jsb.2005.12.013. [DOI] [PubMed] [Google Scholar]
- Radermacher M, Wagenknecht T, Verschoor A, Frank J. Three-dimensional reconstruction from a single-exposure, random conical tilt series applied to the 50S ribosomal subunit of Escherichia coli. J Microsc. 1987;146(Pt 2):113–36. doi: 10.1111/j.1365-2818.1987.tb01333.x. [DOI] [PubMed] [Google Scholar]
- Roseman AM, Ranson NA, Gowen B, Fuller SD, Saibil HR. Structures of unliganded and ATP-bound states of the Escherichia coli chaperonin GroEL by cryoelectron microscopy. J Struct Biol. 2001;135:115–25. doi: 10.1006/jsbi.2001.4374. [DOI] [PubMed] [Google Scholar]
- Saibil HR, Horwich AL, Fenton WA. Allostery and protein substrate conformational change during GroEL/GroES-mediated protein folding. Adv Protein Chem. 2001;59:45–72. doi: 10.1016/s0065-3233(01)59002-6. [DOI] [PubMed] [Google Scholar]
- Scheres SH, Gao H, Valle M, Herman GT, Eggermont PP, Frank J, Carazo JM. Disentangling conformational states of macromolecules in 3D-EM through likelihood optimization. Nat Methods. 2007;4:27–9. doi: 10.1038/nmeth992. [DOI] [PubMed] [Google Scholar]
- Siridechadilok B, Fraser CS, Hall RJ, Doudna JA, Nogales E. Structural roles for human translation factor eIF3 in initiation of protein synthesis. Science. 2005;310:1513–5. doi: 10.1126/science.1118977. [DOI] [PubMed] [Google Scholar]
- Spahn CM, Kieft JS, Grassucci RA, Penczek PA, Zhou K, Doudna JA, Frank J. Hepatitis C virus IRES RNA-induced changes in the conformation of the 40s ribosomal subunit. Science. 2001;291:1959–62. doi: 10.1126/science.1058409. [DOI] [PubMed] [Google Scholar]
- Staley JP, Guthrie C. Mechanical devices of the spliceosome: motors, clocks, springs, and things. Cell. 1998;92:315–26. doi: 10.1016/s0092-8674(00)80925-3. [DOI] [PubMed] [Google Scholar]
- Valle M, Sengupta J, Swami NK, Grassucci RA, Burkhardt N, Nierhaus KH, Agrawal RK, Frank J. Cryo-EM reveals an active role for aminoacyl-tRNA in the accommodation process. Embo J. 2002;21:3557–67. doi: 10.1093/emboj/cdf326. [DOI] [PMC free article] [PubMed] [Google Scholar]
- van Heel M. Multivariate statistical classification of noisy images (randomly oriented biological macromolecules). Ultramicroscopy. 1984;13:165–83. doi: 10.1016/0304-3991(84)90066-4. [DOI] [PubMed] [Google Scholar]
- van Heel M. Angular reconstitution: a posteriori assignment of projection directions for 3D reconstruction. Ultramicroscopy. 1987;21:111–23. doi: 10.1016/0304-3991(87)90078-7. [DOI] [PubMed] [Google Scholar]
- van Heel M, Harauz G, Orlova EV, Schmidt R, Schatz M. A New Generation of the IMAGIC Image Processing System. J Struct Biol. 1996;116:17–24. doi: 10.1006/jsbi.1996.0004. [DOI] [PubMed] [Google Scholar]
- White HE, Saibil HR, Ignatiou A, Orlova EV. Recognition and separation of single particles with size variation by statistical analysis of their images. J Mol Biol. 2004;336:453–60. doi: 10.1016/j.jmb.2003.12.015. [DOI] [PubMed] [Google Scholar]
- Yang S, Yu X, VanLoock MS, Jezewska MJ, Bujalowski W, Egelman EH. Flexibility of the rings: structural asymmetry in the DnaB hexameric helicase. J Mol Biol. 2002;321:839–49. doi: 10.1016/s0022-2836(02)00711-8. [DOI] [PubMed] [Google Scholar]


