Abstract
Objective
Surprisingly little is known about normal brain development in healthy children. Over the last decade, non-invasive and high-resolution magnetic resonance imaging has allowed investigating this process in more details. However, much is still not known in this context, especially with regard to regional differences in brain morphology between genders.
Design
We conducted a large-scale study utilizing fully automated analysis-approaches, using high-resolution MR-imaging data from 200 normal children and aimed at providing reference data for future neuroimaging studies. Global, regional, and local aspects of normal development of gray and white matter volume were investigated as a function of age and gender while covarying for known nuisance variables.
Results
Global developmental patterns were apparent in both gray and white matter, with gray matter decreasing and white matter increasing significantly with age in all brain areas. Gray matter loss was most pronounced in the parietal lobes and least in the cingulate and in posterior temporal regions. White matter gains were almost uniform, with an accentuation of the pyramidal tract. Gender influences were pronounced for both gray and white matter. A number of regional measures also showed a strong influence of gender. The analysis of local effects confirmed significant differences in brain morphology between genders, like a larger amygdala in boys or a larger caudate in girls, in line with and extending earlier studies.
Conclusion
We could demonstrate profound influences of both age and gender on normal brain morphology, confirming and extending earlier studies. The knowledge of such influence allows for the consideration of age- and gender-effects in future pediatric neuroimaging studies.
Introduction
Surprisingly little was known about normal brain development before the advent of non-invasive imaging methods1, and even large normative neuroanatomical collections contained almost no pediatric specimens, owing to the low mortality of normal children2. Especially magnetic resonance imaging (MRI) has helped in unveiling the global and local processes taking place during normal brain development. The technique gives excellent soft tissue contrast while not carrying the risk of exposing the subject to ionizing radiation as in positron emission tomography (PET) or computed tomography (CT) studies used earlier3.
Normal brain development has been the focus of a number of MRI-studies in the past, looking mainly at local development in certain regions of interest. However, conclusions to be drawn from most of these studies are limited by small numbers of participants, the error-prone manual delineation of anatomical structures or tissue classes, or both1,4,5. Others used only “predominantly non-clinical” populations, a problem inherent in a number of studies6,7, especially investigating younger children where sedation would be necessary in order to obtain high-quality images, but is ethically not justifiable.
A number of larger studies addressing development at the global level used automated image processing and analysis methods and included children aged 5–18 years. The first of these studies used rather low resolution images (up to 7.5 mm effective slice thickness) and clinically indicated scans from 51 subjects referred for medical reasons6. Another study investigating normal development and aging included 45 children in the range from 5–18, with boys outnumbering girls by 3:12. Two recent studies from the same group used data from > 100 normal children after applying extensive exclusionary criteria. These studies also included some longitudinal scans8,9.
The aim of the present study was threefold: first, results from previous studies should be confirmed and extended with regard to global gray and white matter volume. Secondly, using advanced image analysis algorithms, regional and local effects of age and gender on gray matter morphology should be assessed using a whole-brain approach. Thirdly, regional and local development of white matter volume, including laterality effects, should be investigated for the first time. The data obtained in this study, using the largest sample of healthy children investigated to date, is intended as reference data to be taken into account when planning and conducting future pediatric neuroimaging studies.
Subjects & Methods
Subject selection & screening
Children were recruited as part of an ongoing study on normal language development10 from the local community. Participants were not included in the study if one of the following criteria was met: history of previous neurological illness, head trauma with loss of consciousness, current or past psychostimulant medication, learning disability, birth at 37 weeks or less of gestational age, pregnancy, abnormal findings on clinical neurological examination, and clinical or technical contraindications to an MRI-examination (including orthodontic braces). Informed consent and/or assent and institutional review board approval were obtained for all subjects.
Additionally, children were tested regarding their language and cognitive abilities, using the Oral and Written Language Scores (OWLS11) and the age-appropriate version of the Wechsler-scale (Wechsler Preschool and Primary Scale of Intelligence [WPPSI-R], Wechsler Intelligence Scale for Children, third edition [WISC-III], Wechsler Adult Intelligence Scale, third edition [WAIS-III]12,13,14). Abnormal language functions or an IQ-score of less than 80 were considered to be exclusionary criteria. All tests were administered in close temporal proximity to the MRI-scanning. Results from subjects were also excluded if structural abnormalities (as determined by a qualified pediatric neuroradiologist) were found. Images were excluded if moderate or strong motion or blood flow artifacts were present, using a rating scheme described earlier15.
Of 276 children imaged, 76 children did not meet the quality or epidemiological inclusion criteria. Therefore, 200 healthy children could be included in this study, 102 girls (51%) and 98 boys (49%). Mean age was 137.1±43.1 months (11.3±3.6 years), range 60–226.5 months (5 – 18.87 years). Neuropsychological testing revealed an average IQ of 112.7±13.9, range 80–147. All but 20 subjects were right-handed. Ethnic background was Caucasian in 178 (89%), African-American in 12 (6%), Asian in 4 (2%), Multi-Ethnic in 3 (1.5%), Hispanic in 2 (1%), and Native American in 1 (.5%). Image quality was considered optimal in 38 children (19%), very good in 99 (49.5%), and good in 63 (31.5%). None of the above measures (IQ, gender, age, image quality, or handedness) correlated significantly with any of the other measures, i.e., boys and girls not differ significantly on any measure. See also Table 1.
Table 1.
Age- and gender distribution of our sample
| 5 – 6 | 7 – 8 | 9 – 10 | 11 – 12 | 13 – 14 | 15 – 16 | 17 – 18 | Total | |
|---|---|---|---|---|---|---|---|---|
| f | 8 | 19 | 22 | 14 | 15 | 13 | 11 | 102 |
| m | 13 | 18 | 19 | 21 | 13 | 6 | 8 | 98 |
To provide reference data for different ages, the samples (boys and girls) were divided into three equally-sized subgroups as shown in Table 2.
Table 2.
Epidemiological variables in the different subgroups of our sample
| Group | n | Handedness [right/left] | IQ±SD [full-scale] | Age±SD [months] | |
|---|---|---|---|---|---|
| Girls | Young | 34 | 31/3 | 117.79±13.29 | 94.66±13.7 |
| Medium | 34 | 31/3 | 111.38±14.73 | 135.43±14.01 | |
| Old | 34 | 33/1 | 110±12.76 | 193.8±19.12 | |
| Boys | Young | 33 | 31/2 | 110.67±13.55 | 86.63±14.99 |
| Medium | 32 | 28/4 | 113.03±15.2 | 131.47±9.71 | |
| Old | 33 | 26/7 | 113.42±12.48 | 180.05±22.47 | |
MR-image acquisition and processing
Children were imaged using a Bruker Biospec 30/60 3 Tesla MRI scanner, equipped with a dedicated head gradient insert (Bruker SK330). A T1-weighted, whole-brain Modified Driven-Equilibrium Fourier Transform (MDEFT16) image was acquired (TR = 15 ms, TE = 4.3 ms, τ-time = 550 ms, flip angle = 20°, matrix = 128 × 256 × 96, FOV = 19.2 × 25.6 × 14.4 cm, resolution = 1.5 × 1 × 1.5 mm).
All following procedures were completely automated and utilized functions available within the statistical parametrical mapping software package (SPM99, Wellcome Department of Cognitive Neurology, University College London, UK17) running in MATLAB (MathWorks, Natick, MA) unless stated otherwise. In order to achieve a better overlay with the axially oriented templates and to reduce partial voluming during further steps, images were resliced in the axial plane, using a sine-interpolation algorithm (9 × 9 × 9 neighbors). From this step on, all images were written out and analyzed at a spatial resolution of 1 × 1 × 1 mm.
Spatial normalization was achieved with a combined linear (12 parameter) and non-linear transformation, using 7 × 8 × 7 discrete cosine transform basis functions, aiming at minimizing both the sum of squared differences between image and template and the energy cost-function of this transformation18. Images were segmented into tissue classes using the combined pixel-intensity/a priori-knowledge approach implemented in SPM9919, using a correction for magnetic field inhomogeneities20,21.
All of our processing was based on custom-made pediatric data since we could recently show that spatial normalization and segmentation in the pediatric age group is profoundly influenced by the morphological differences between a pediatric and a standard adult reference population15,22. To this end, a study-specific template and a priori reference-data were constructed in a first step, based on all included high-quality images (n = 200). Figure 1 shows an overview, details of this procedure have been published previously15,22.
Figure 1.
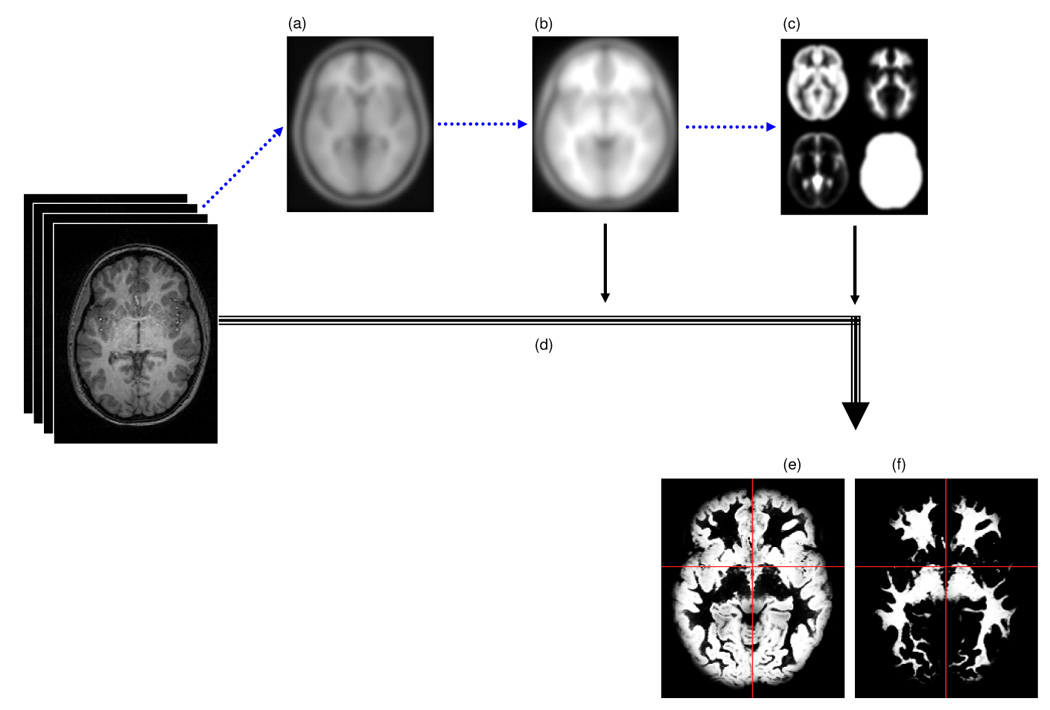
Overview over image pre-processing: images were first normalized to the standard adult template (a) to yield a pediatric template (b). Pediatric tissue reference data was derived from the normalized images (c) and was used during the following optimized processing stream (d) to yield optimally normalized gray (e) and white (f) matter maps.
We implemented an optimized processing protocol for structural imaging studies23. This protocol aims at minimizing the contribution of and contamination by non-brain tissue to spatial normalization and segmentation and also allows for the investigation of true tissue volume instead of the more abstract concept of tissue density. It consists of the following step: images are segmented in native space and “cleaned” by modulating it with an individually derived brain-tissue mask. The cleaned tissue probability map is then normalized to the average, corresponding tissue probability map (i.e., a single native-space gray matter map is normalized to the averaged, normalized gray matter map of all participants). The parameters of this normalization are applied to the original whole-brain image, which is segmented and finally cleaned again. To reintegrate the volume changes occurring during the combined linear and non-linear spatial normalization, images were modulated with the Jacobian determinant of the transformation matrix, finally yielding images representing tissue volume23. These steps have to be completed separately for gray and white matter of each individual subject. CSF-partitions were not investigated since both segmentation and normalization are more prone to errors in subjects with only small amounts of CSF (like especially the younger children)22. The images were analyzed in different ways as described below.
Data Analysis
Approach
We aimed at investigating normal brain development at the global, regional, and local level, in order to examine the influence of gender and age. In order to achieve this, the following approaches were implemented for gray and white matter: a global analysis, providing information about the overall tissue volume (of gray or white matter, respectively); a regional analysis, where the data was subdivided using two automated parcellation schemes (one for gray and one for white matter); and an analysis of local changes, applying the concept of voxel-based morphometry. For the global and local analyses of gray and white matter, raw (uncorrected) tissue volume data was calculated for the whole group and for three (equally sized) subgroups in order to provide reference data for subsequent studies. The approaches shall now be described in more detail.
Epidemiological Variables
The following variables were considered variables of interest in all analyses: age (in months at date of MR-exam) and gender. Due to the substantial influence on brain morphology, the full-scale IQ (as derived from the Wechsler scales), handedness (as per self-report), and an image quality parameter (determined by a single investigator for all images15,22) were considered covariates of no interest (nuisance variables)7,23,24,25. Also, while global effects of tissue volume were investigated in a first step, the effect of globally differing volumes was also accounted for in each analysis in a second step, as described below.
Global analysis
For the investigation of global effects, the final tissue partitions (gray and white matter, respectively) of all subjects were analyzed using a stand-alone script integrating the overall pixel intensity in the image, yielding global tissue volume (in ccm). In a first step, this data was analyzed qualitatively according to age and gender. The results were also entered into a multiple regression analysis, using the above-mentioned nuisance variables as covariates. Following this, the standardized residuals were further examined in order to investigate the effect of age and gender (the covariates of interest). Note that due to the use of the standardized residuals (making the data follow a normal distribution with a mean of 0 and a standard deviation of 1), differences in global tissue volume between the groups are accounted for.
Regional analysis
In order to investigate regional volumetric differences, we analyzed the data using predefined regions of interest, avoiding the error-prone and time-consuming steps of manual delineation in all individual brains. For gray matter, a model recently put forward was used, containing anatomical delineations of a representative brain into 90 GM regions26. However, the suggested sub-lobar breakdown was considered too fragmented for the purpose of this study, so the following regions of interest were defined by condensing the data: frontal, occipital, temporal, and parietal lobe; deep gray matter structures (thalamus and basal ganglia), and the cingulate gyrus as done before27. Since every mask was constructed independently for the left and the right side of the brain, this resulted in 12 individual datasets.
In order to assure an adequate overlap of the resulting masks with our images, the original mask was matched to an average of our final gray matter partitions; these normalization parameters were then applied to the individual lobar masks. To further account for inter-individual anatomical variability, the masks (structure of interest = 1, rest = 0) were smoothed with a Gaussian filter (full width at half maximum [FWHM] = 6 mm).
For white matter, no anatomically predefined masks exist, since those, due to the more uniform character of white matter, would indeed be most difficult to define from anatomical images alone. We therefore took a pragmatic approach in that we divided the normalized image volume into an upper and a lower half, with each half again being subdivided into 4 equally-sized quadrants. This resulted in 8 masked images per subject (right/left upper posterior [UP], right/left upper anterior [UA], right/left lower posterior [LP], right/left lower anterior [LA]). Figure 2 shows an illustration of the masking procedure for both gray and white matter.
Figure 2.
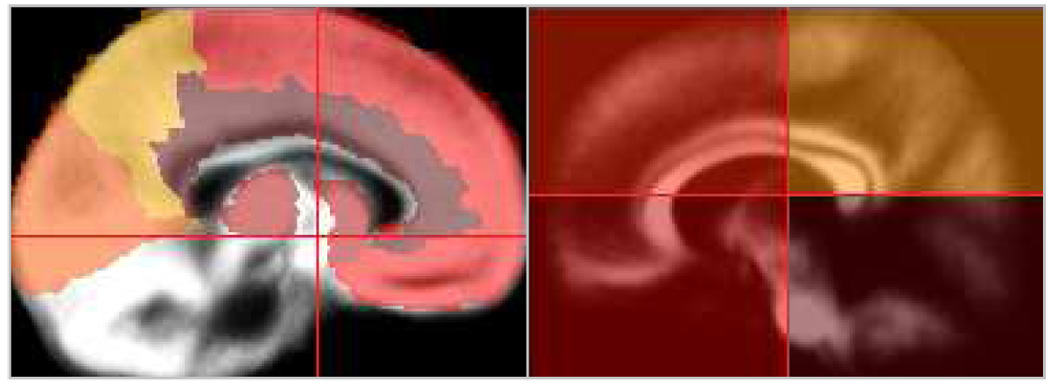
Illustration of the parcellation schemes used for gray matter (left) and white matter (right); see text for details.
As done for the global analysis, the final volumetric measure was derived by determining the overall pixel intensity of a masked image. The influence of the nuisance variables was removed as described above. A laterality index10 was calculated to assess asymmetry effects.
Local analysis
For the local analysis, the concept of voxel-based morphometry was employed20. Initially, the image volumes were smoothed with a Gaussian filter (FWHM = 12 mm). This step conditions the images to conform to the normality assumption underlying the subsequent statistical tests20,23. Due to the matched filter theorem, it also determines the spatial scale at which structural changes are most sensitively detected28. Employing the framework of the general linear model, the data was analyzed within SPM99 treating age and gender as the covariates of interest, while handedness, full-scale IQ, image quality and global tissue volume were considered covariates of no interest. Two separate analyses were done for gray and white matter.
Data visualization
The data was analyzed for significant influences of gender and age, respectively. The best fit to the data was determined using an algorithm that ensures that the “merit function” (describing the disagreement between the data and the model) is minimized. The model explaining most of the variance in the data, as reflected in the correlation coefficient (r), was chosen. For the regional analyses, fits were constrained to conform to the same model as the corresponding global tissue. Significance was assumed at p = .05, which, in the case of the correlation coefficient, was derived using a Fisher Z-transformation. For the voxel-based analysis, a correction for multiple comparisons was employed29, as well as an additional extent threshold of 25 voxels. Statistical overlays were generated using functions within SPM99 or MRIcro30.
Results
Global Analysis
Gray matter
Gray matter volume correlated with gender, with boys having significantly more global gray matter (842 ± 103 ccm vs. 745 ± 115 ccm, p < .0001). Factoring out global as well as nuisance effects showed a strong influence of gender and age. For both genders, the correlation with age was best described by a 3rd order polynomial function (boys: r = .401, p < .0001, maximum/minimum: 91/183 months; girls: r = .365, p < .0001, maximum/minimum: 102/202 months); see Figure 3. For volumetric data according to ages, see Table 3.
Figure 3.
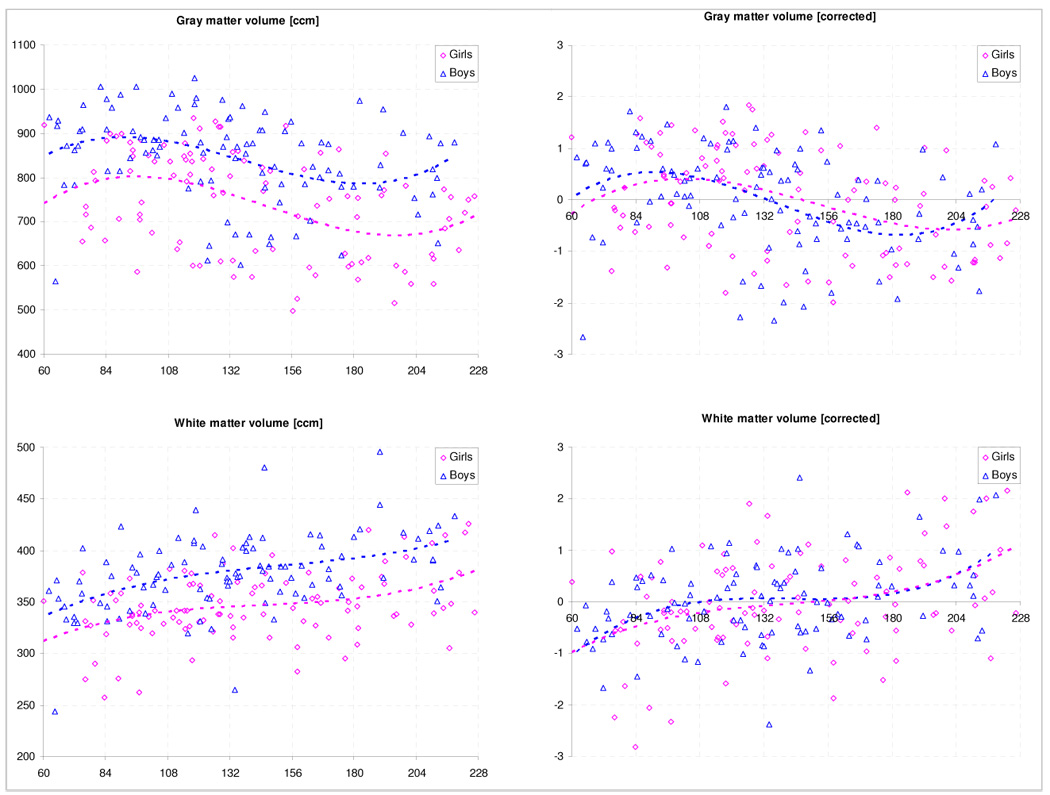
Global gray and white matter volume: uncorrected (left [ccm]) and corrected (right [standardized residuals]) for effects of image quality, handedness, and IQ.
Table 3.
Global gray matter volumes [ccm; uncorrected] for young, medium, and old children in this sample [Y, M, O].
| Global GM | Global WM | |
|---|---|---|
| Y | Y | |
| M | M | |
| O | O | |
| 789.19±92.12 | 335.52±30.18 | |
| Girls | 757.63±129.27 | 349.35±30.09 |
| 686±93.02 | 359.1±34.44 | |
| 890.72±82.43 | 360.96±32.33 | |
| Boys | 836.51±115.55 | 380.03±37.86 |
| 808.03±86.18 | 391.52±32.22 | |
White Matter
White matter also correlated with gender, with boys having significantly more global white matter (378 ± 37 ccm vs. 347 ± 33 ccm, p < .0001). Factoring out global as well as nuisance effects again showed a strong influence of age, with a weaker influence of gender. Again, the relation was best described with a 3rd order polynomial function (boys: r = .357, p = .0001; girls: r =.391, p < .0001); see also Figure 3. For volumetric data according to ages, see Table 3.
Regional Analysis
Gray Matter
There was pronounced regional variability for gray matter in both genders, and a significant negative correlation with age was found for all regions (p < .02 for all correlations, Figure 4). Laterality effects were apparent in boys and girls for the cingulate (L > R, p = .014/.029 [boys, girls]), for the occipital lobe (L > R, p < .0001 [boys, girls]), and the temporal lobe (L < R, p < .0001 [boys, girls]). Changes in the laterality index with age could be found in the cingulate, where the leftward asymmetry significantly decreased with age (boys: r = −.201, p = .04; girls: r = −.203, p = .04). For volumetric data according to ages, see Table 4.
Figure 4.
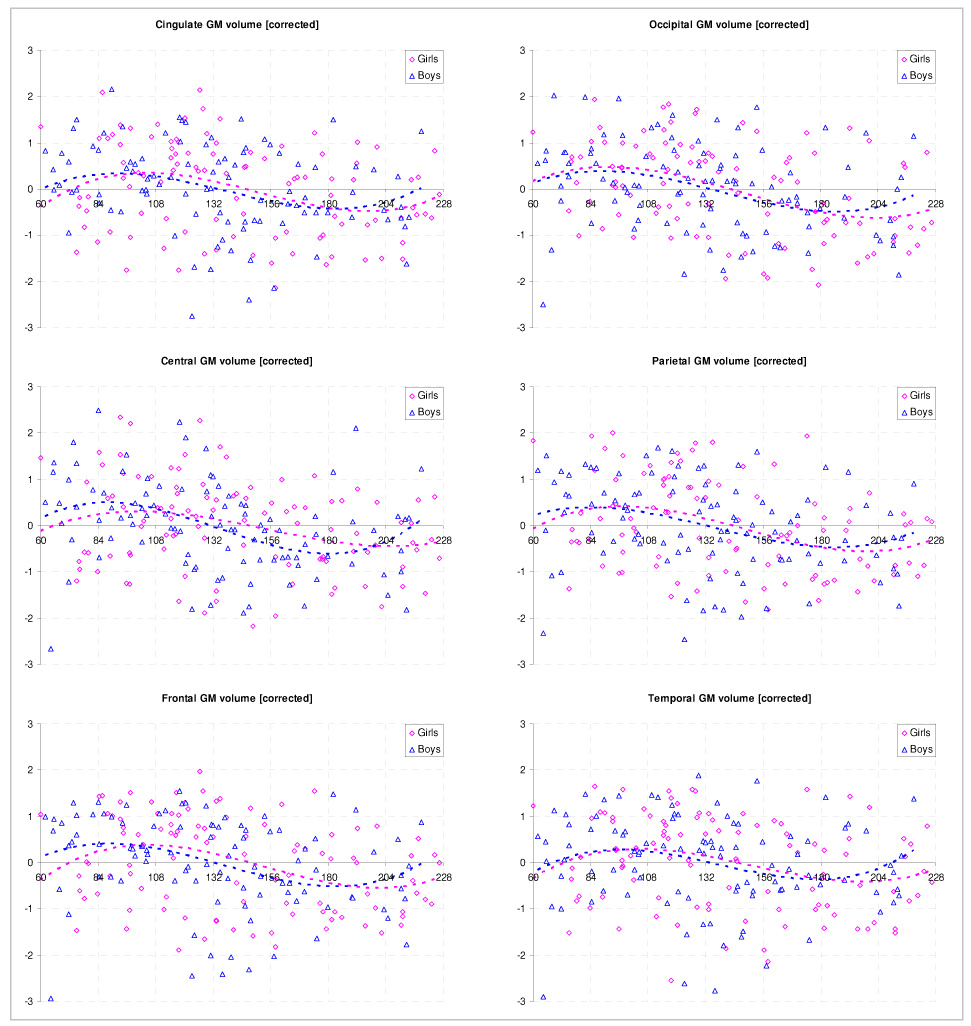
Regional gray matter volume: corrected [standardized residuals] for effects of image quality, handedness, and IQ. Note that data from both sides was combined for ease of visualization.
Table 4.
Regional gray matter volumes [ccm; uncorrected] for young, medium, and old children in this sample [Y, M, O]; see text for details on region definitions.
| Cingulate | Central | Occipital | Parietal | Temporal | Frontal | ||
|---|---|---|---|---|---|---|---|
| Y | Y | Y | Y | Y | Y | ||
| M | M | M | M | M | M | ||
| O | O | O | O | O | O | ||
| 16.06±2.11 | 12.62±1.84 | 51.22±4.65 | 45.56±7.05 | 59.84±6.05 | 104.77±15.53 | ||
| Left | 15.61±2.53 | 12.2±1.82 | 48.38±6.77 | 44.5±8.42 | 58±8.04 | 101.48±20.17 | |
| 14.33±1.92 | 11.27±1.45 | 45.03±5.54 | 39.35±5.92 | 54.83±6.79 | 90.32±14.41 | ||
| Girls | |||||||
| 15.25±2.04 | 12.85±1.6 | 44.71±3.76 | 45.5±6.9 | 66.59±7.27 | 106.12±15.85 | ||
| Right | 14.88±2.3 | 12.42±1.77 | 42.28±5.73 | 43.35±8.1 | 64.17±10.4 | 101.03±20.59 | |
| 13.79±1.85 | 11.34±1.34 | 39.25±4.29 | 38.82±5.51 | 61.18±7.83 | 90.59±14.53 | ||
| 18.22±1.9 | 14±1.69 | 55.21±4.99 | 52.49±6.25 | 66.36±5.74 | 119.98±12.97 | ||
| Left | 17.31±2.43 | 13.26±1.85 | 53.02±6.13 | 48.27±7.93 | 64.56±7.66 | 111.46±17.91 | |
| 16.79±1.82 | 12.66±1.49 | 51.18±4.95 | 47.02±6.05 | 63.35±5.35 | 107.81±13.46 | ||
| Boys | |||||||
| 17.27±1.84 | 14.38±1.48 | 48.23±4.36 | 51.87±5.93 | 74.61±6.97 | 121.36±12.96 | ||
| Right | 16.5±2.39 | 13.48±1.74 | 46.36±5.13 | 47.34±7.87 | 71.49±9.21 | 112.53±18.46 | |
| 16.12±1.62 | 12.78±1.37 | 44.8±3.96 | 45.8±5.9 | 70.4±7.17 | 108.93±13.94 | ||
White Matter
Regional variability was much less pronounced for white matter in both genders, although a significant positive correlation with age was found for all regions (p < .02 for all correlations, Figure 5). Laterality effects were significant in boys and girls for the lower posterior quadrant (L > R, p < .0001 [boys, girls]) and the lower anterior quadrant (L > R, p = .003/.019 [boys, girls]). Differences in laterality between girls and boys were also significant for the lower posterior (pboys vs. girls = .003) and the lower anterior quadrant (pboys vs. girls = .005), with boys showing stronger lateralization. Changes in the laterality index with age could be found in the upper posterior quadrant for girls only (decreasing leftward asymmetry, r = −.232, p = .018) and in the upper anterior quadrant, again with the leftward asymmetry significantly decreasing with age (boys: r = −.313, p = .001; girls: r = −.416, p < .0001). For volumetric data according to ages, see Table 5.
Figure 5.
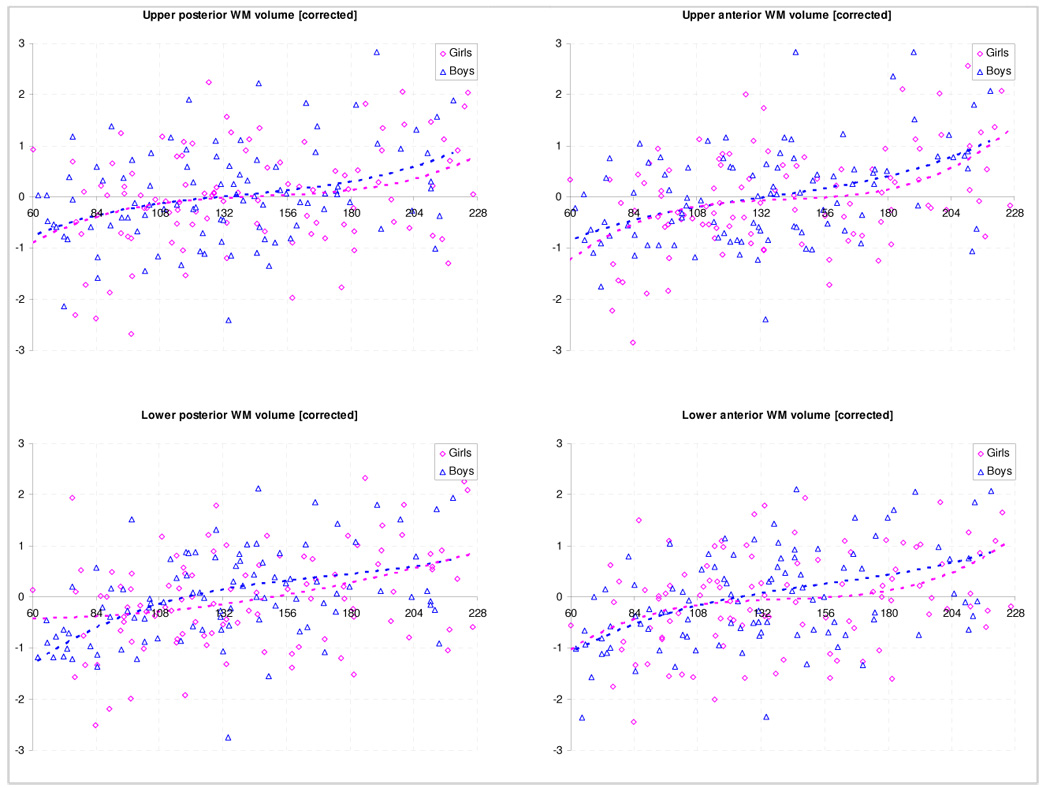
Regional white matter volume: corrected [standardized residuals] for effects of image quality, handedness, and IQ. Note that data from both sides was combined for ease of visualization.
Table 5.
Regional white matter volumes [ccm; uncorrected] for young, medium, and old children in this sample [Y, M, O]; UA: upper anterior, UP: upper posterior, LA: lower anterior, LP: lower posterior quadrant; see text for details on region definition
| UA | UP | LA | LP | ||
|---|---|---|---|---|---|
| Y | Y | Y | Y | ||
| M | M | M | M | ||
| O | O | O | O | ||
| 42.19±4.54 | 50.09±5.91 | 30.95±3.08 | 46.84±4.66 | ||
| Left | 44.81±4.3 | 52.91±5.5 | 32.34±3.49 | 48.2±4.13 | |
| 45.9±5.44 | 52.83±6.01 | 33.07±3.29 | 49.84±5.38 | ||
| Girls | |||||
| 41.18±4.65 | 50.42±5.91 | 29.8±2.75 | 41.95±4.06 | ||
| Right | 43.71±4.66 | 53.78±5.46 | 31±2.82 | 43.61±3.97 | |
| 45.45±5.15 | 54.19±5.89 | 32.36±2.64 | 46.56±4.43 | ||
| 46.52±5.15 | 55.39±5.65 | 33.96±2.96 | 49.17±4.36 | ||
| Left | 48.47±5.85 | 57.56±6.21 | 35.69±3.87 | 52.44±5.15 | |
| 50.11±4.68 | 58.73±5.31 | 36.45±4.02 | 53.37±4.37 | ||
| Boys | |||||
| 45.3±5.13 | 56.61±5.92 | 31.56±2.52 | 43.46±4.32 | ||
| Right | 47.04±5.93 | 58±6.47 | 34.44±3.7 | 47.49±4.61 | |
| 49.61±7.74 | 60.26±5.39 | 35.28±3.77 | 48.87±4.7 | ||
Local Analysis
Gray Matter
Gray matter volume loss was most pronounced in the parietal lobe, while large aspects of the frontal and temporal lobes showed a positive effect of age (green and red in Figure 6). Gray matter volume is also influenced by gender in that girls have proportionally a larger caudate and cingulate gyrus, while boys show proportionally higher volumes in posterior temporal and insula regions (green and red in Figure 7). Also note distinct area of higher volume in girls in left inferior frontal region.
Figure 6.
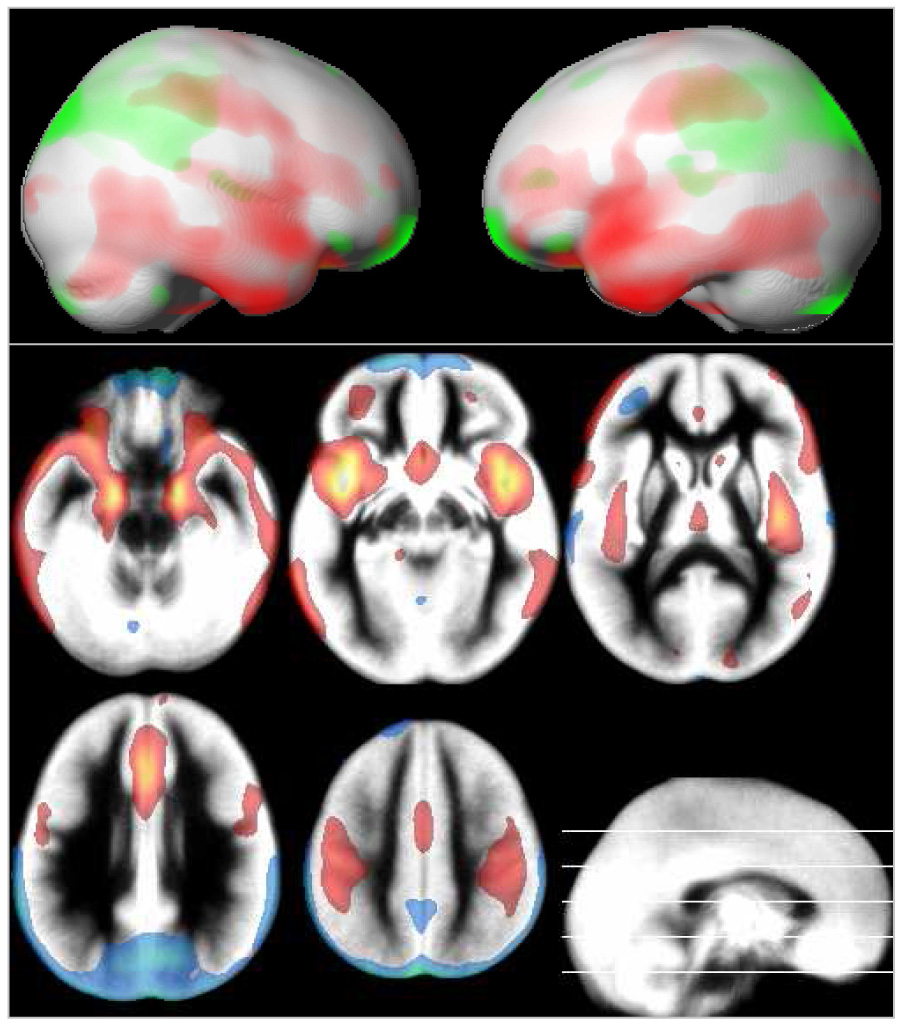
Local gray matter volume: effect of age, rendered and overlaid on the averaged gray matter partition. Blue-green: negative effect of age; yellow-red: positive effect of age; p = .05, corrected, extent threshold = 25 voxels; neurological orientation (r = r).
Figure 7.
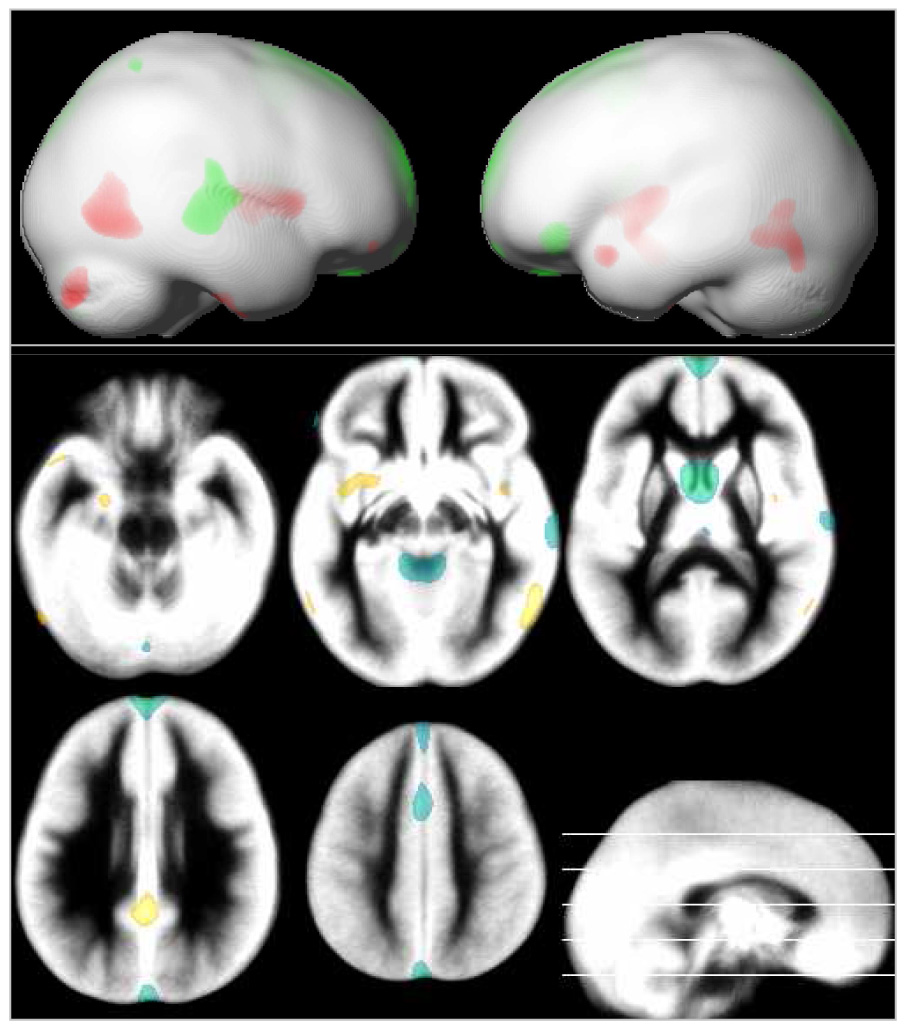
Local gray matter volume: effect of gender, rendered and overlaid on the averaged gray matter partition. Blue-green: gray matter increases in girls; yellow-red: gray matter increases in boys; p = .05, corrected, extent threshold = 25 voxels; neurological orientation (r = r). Note increased amygdala volume in boys and larger caudates in girls.
White Matter
The positive effect of age on white matter is most pronounced in the pyramidal tract, in fronto-polar and temporal regions (red in Figure 8). Negative effects were only found in one small high-parietal cluster. Boys had proportionally higher volume in most brain regions, with a relative sparing of the pyramidal tract (red Figure 9). No regions were found where girls had proportionally higher volumes.
Figure 8.
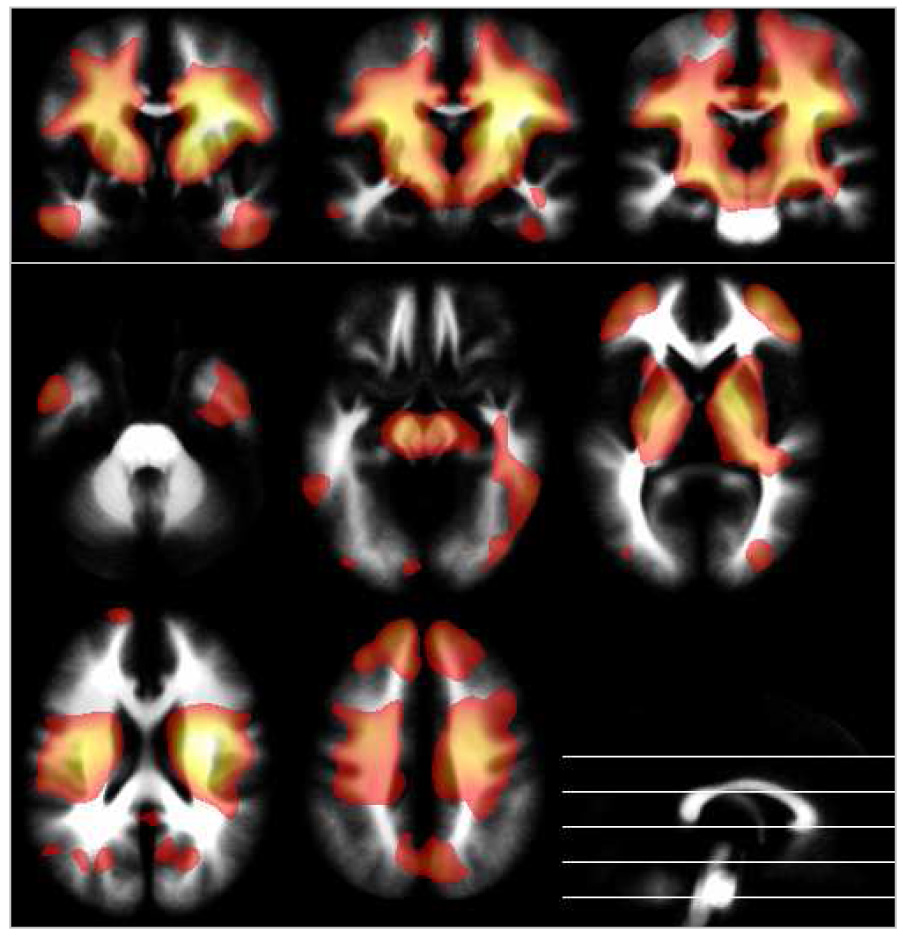
Local white matter volume: effect of age, overlaid on the averaged white matter partition. Blue-green: negative effect of age; yellow-red: positive effect of age; p = .05, corrected, extent threshold = 25 voxels; neurological orientation (r = r). Note accentuation of the pyramidal tract.
Figure 9.
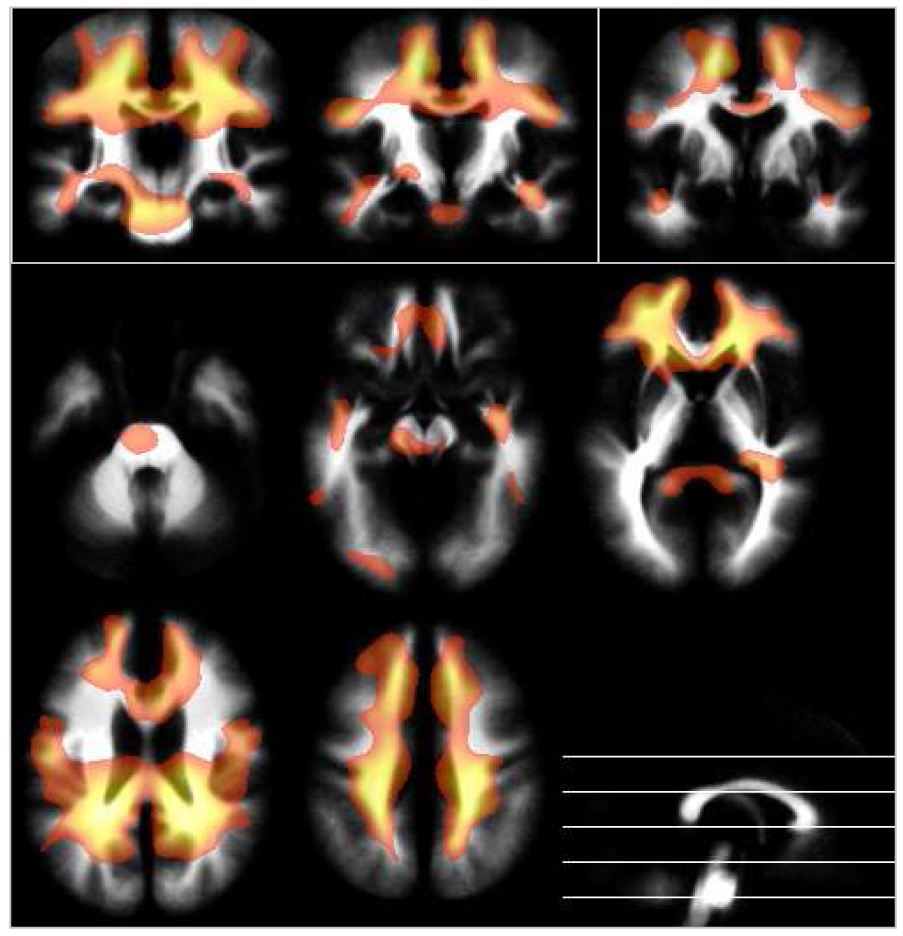
Local white matter volume: effect of gender, overlaid on the averaged white matter partition. Blue-green: white matter increases in girls; yellow-red: white matter increases in boys; p = .05, corrected, extent threshold = 25 voxels; neurological orientation (r = r). Note relative sparing of the pyramidal tract.
Discussion
Subjects and Methods
In this study, we have tried to provide reference data on normal brain development as assessed with magnetic resonance imaging in a large group of carefully selected, healthy and normal children. Such large samples seem necessary in order to account for the high degree of variability in brain morphology in children25. Investigating normal children avoids the pitfalls of using “apparently normal” subjects31 and allows for the generalization of findings to the population as a whole32.
Regarding our methodology, we were able to the most refined processing protocol currently in use within a widely-used software solution, allowing to investigate true tissue volume23. We also used our own, customary reference data for spatial normalization and segmentation which significantly influences the results from such studies23, especially in children15,22. All of these measures should result in an increased sensitivity and specificity compared to conventional approaches using possibly non-appropriate reference data.
The data obtained in this study was meant to confirm and extend earlier findings in one comprehensive study, providing current reference data for normal brain development. Selected findings will be discussed shortly below. For a more extensive review of the topic in general, a number of recent overviews is available33,34,35,36,37.
Global analyses
Gray matter
Gray matter volume shows a significant decline in childhood, in line with earlier studies1,2,4,6,8,9. As described before, boys do not only have significantly more gray matter but also show a different pattern in that both the first and the second inflection point of the curve (maximum and minimum gray matter volume) are reached earlier in boys than in girls. The global gray matter “gender gap” widens slightly from about 11% (higher gray matter volume in boys) in the young children to about 15% in the older ones. This could be explained by similar mechanisms taking place, but to a different extent in girls and boys. Alternatively, similar processes could occur, but with different time courses. Both interpretations would be consistent with what we find in the regional analyses (see below). There is at present not enough data to demonstrate which underlying influences model these differences: genetic, environmental, hormonal, or combined influences would seem to be the most likely candidates4,38,39.
We modeled the trends in our data using a 3rd order polynomial function, explaining most of the variance in our data. Such functions were used before to describe developmental effects in brain morphology6,7,27. While earlier studies limited the model so that only a decline in volume would be allowed after puberty6, we have specifically abstained from constraining our model in such a way. While global effects must be expected to dominate the whole-brain tissue volume, regional and local increases in gray matter volume have been shown here (see local analyses, below) and in other studies40 even in late adolescence and adulthood, which could very well influence the global pattern. Therefore, while it must be acknowledged that the global volume increase in the older children predicted by our model could reflect an artifact influenced by a small number of children at the upper end of the age-bracket, it could also signal a shift in the balance between processes leading to volume decreases or increases, respectively.
White matter
White matter volume increases significantly in the age range studied, and in an almost linear fashion. Differences between the genders again are significant in that boys have significantly more white matter than girls (see Fig. 3, Table 3). The relative increase with age, though, is almost identical (7.81%/7.4% [boys/girls]), as is the pattern best describing this process. Most of these findings are in line with earlier studies on this issue4,8 except for the fact that these studies had found greater volume increases in boys than in girls. At least when expressed in percentage changes, this trend is not apparent in our data. Boys did, however, gain more white matter in absolute terms (30.56/26.57 ccm [boys, girls]), showing the value of examining such effects in both absolute and relative terms.
Regional analyses
Gray matter
A pattern of regional variation in gray matter volume decline is evident in our data, again consistent with earlier studies8,40 and pointing towards a heterochronous pattern of human cortical development. As shown before5, gray matter volume decline is strongest in the parietal lobe in both genders (both sides: −11.05%/−15.08% [boys, girls]) and smallest in the temporal lobe (−5.12%/−8.24% [boys, girls]). It is interesting to note that, in boys, the basal ganglia/thalamus volume shows the strongest decrease after the parietal lobe (−10.31%), while in girls, it is only fourth in line (−11.27%) after the frontal and occipital lobe. It is also the only region in which the absolute volume decline is larger in boys than in girls (−2.93/−2.86 ccm [boys, girls]). Generally, the region-specific decline is stronger in girls than in boys, which is also reflected by the more accentuated age-related decline in global tissue volume (see above). Considering the strong influence of gender on a number of neuropsychiatric disorders with a putative developmental mechanism (like attention deficit/hyperactivity disorder34), our observations seem to strengthen the case for neurodevelopmental factors to play a decisive role.
The asymmetry observed in the cingulate is interesting in that the left side is larger in both boys and girls, but this asymmetry decreases significantly with age. The cingulate is a region involved in a multitude of cognitive tasks41,42, and gray matter volume in this region has recently been linked to cognitive abilities27. Our observation, indicating localized increases in the right cingulate, could therefore be seen in the framework of unfolding cognitive abilities in children of our age range. The cingulate seems to be a likely candidate region for further studies on cognitive development. The strong asymmetry in the occipital (L > R) and in the temporal lobe (L < R) is in very good agreement with earlier studies on adults23,43.
White matter
Regional variation is much less pronounced in white matter than in gray matter, again in accordance with previous results8,9. Significant laterality effects are present in our sample; these have as yet not been studied for white matter in children. For example, in the upper anterior quadrant, the original leftward asymmetry in younger children decreases significantly with age. This is concordant with the pattern observed in the cingulate in the gray matter analysis, validating that finding and suggesting that, for white matter, it could represent a secondary phenomenon, a mechanism suggested before in adults23. A similar trend, with significant decreases in the leftward asymmetry, is also present in the upper posterior quadrant, but only in girls. This seems especially interesting on the background of specific parietal tissue abnormalities in girls with Turner-syndrome (X-monosomy) reported earlier, leading to the suggestion that the X-chromosome and/or hormonal influences influence development in this brain region in particular44,45. Our results seem to indicate that such factors also influence normal brain morphology in children as a function of sex.
Local analyses
Gray matter
It should be noted that, in the local analyses, the corresponding global tissue volume was used as a covariate of no interest. Therefore, the results shown represent changes independent of and not explained by global changes. If, for example, boys and girls were compared without accounting for global differences, boys would be found to show more gray matter everywhere in the brain. It is only by taking into account such global effects that local differences between such groups can be uncovered23.
The effect of age is striking in that mostly posterior brain regions (parietal lobe) show a pronounced negative effect of age on gray matter volume, while mostly anterior and inferior brain regions (frontal, temporal lobe) show a positive effect of age. Confirming earlier studies5,8,40,46, this mirrors the general pattern of brain maturation (as, for example, seen during myelination36,47,48), ie, posterior to anterior and inferior to superior, but with inverted polarity: the earlier-maturing cortical regions show a more pronounced loss of gray matter. In other words, later-developing brain regions seem to be relatively spared from such regressive events, allowing for interesting speculations on the phylogenetic role of different brain regions49. It is also interesting to note that, according to earlier morphometric studies, it seems to be mostly the formation and elimination of synapses that account for the volume changes, while absolute neuronal numbers do not seem to change significantly50. In line with this observation and earlier studies51, medial temporal lobe structures were detected to show a volume increase in childhood in our sample. Interestingly, a region in the posterior temporal/inferior parietal/posterior insula bilaterally was also detected to exhibit relative volume increases in this sample, again confirming and extending earlier studies on smaller samples40,46. This region may be involved in the continued development of cognitive functions in and after childhood27.
A larger size of the amygdala complex in males has been described before in both children and adults23,33, and it is again interesting to consider the influence of genetics on this difference as possible in cases of sex chromosomal aneuploidy: children with the chromosomal pattern of Klinefelter-syndrome (47, XXY) have been shown to have smaller amygdala than comparable boys52, again pointing towards a direct or indirect influence of sex chromosomes on brain structure. Such effects have long since been hypothesized on theoretical grounds, and a number of recent studies have lent support to this theory39. Interestingly, the differences are more prominent in the left amygdala and are only apparent on the right side when exploring lower thresholds (data not shown). They do, however, also reach significance on the right if only changes in the temporal lobe are considered (small volume correction, corrected p = .02), hinting at the problem of possibly too strict corrections for multiple comparisons29 in studies like this one.
In a number of studies, girls have been reported to show relatively higher caudate volumes (see Durston et al.33 for review), which again we are able to confirm in our sample. Note that, due to the size of the smoothing filter, the bilateral changes in the caudate are detected as one significant cluster in the midline. The use of smaller filter widths might be necessary in order to detect such small-scale changes more sensitively28. Still, we were able to confirm earlier studies on such small structures like the amygdala and the caudate without restricting our search volume to either, or indeed, any structure of interest. In our opinion, this conclusively demonstrates the sensitivity and reliability of this approach.
It is also interesting to note that girls were found to have a proportionally higher gray matter volume in a very distinct area of the inferior frontal gyrus on the left side only (see Fig. 7). This is in line with earlier results from manual tracing studies demonstrating such differences in language-related areas53, allowing for speculations as to the underlying mechanism for the overall higher performance of girls in tests of verbal functions for which as yet no clear neurophysiological basis has been found54. While the exploration of such relationships would principally be possible in our data, it was not the focus of the current study. In this context, the proportionally higher gray matter volume in portions of the anterior cingulate is also interesting since it is among the brain regions involved in semantic processing54 and, again, replicates earlier findings23. It should be noted that at least part of this effect is likely explained by a higher volume of CSF in the intrahemispheric fissure in boys, as demonstrated before in adults23.
White matter
While overall white matter volume almost monotonously increases with age, certain regions show an accentuated correlation with age, especially the pyramidal tract. This very nicely confirms earlier structural55 and diffusion tensor imaging studies56. Again in line with data on myelination, other central white matter regions seem relatively stable, while more peripheral regions, myelinating later47,48, are heavily correlated with age. Only one very small high-parietal cluster was found to have a negative correlation with age, possibly reflecting an effect secondary to the accentuated parietal gray matter volume loss (see above). With regards to gender effects, girls did not show any region with proportionally higher tissue volumes than boys. In contrast to this, there are a number of regions where boys have proportionally higher white matter volumes than girls, interestingly with a relative sparing of central aspects of white matter. This is in line with earlier observations of white matter increases being mostly secondary to gray matter increases23, which are not very prominent for girls in this sample. Again, a different smoothing width might be able to more sensitively detect such changes on a smaller scale, but such explorations were not the main focus of this project.
Possible implications
There are a number of possible implications studies like this one have:
relevance for future neuroimaging studies: future studies trying to assess differences between groups need to take into account that a number of brain regions show strong differences between the genders and strong changes with age. This is not only important for structural, but also for studies using functional imaging methods32,37, since the underlying morphology of a given structure will also influence the amount and/or quality of signal derived from them.
relevance for basic neuroscientific questions: it is tempting to speculate that a (simple or complicated) structure-function relationship may, at least in part, be responsible for some well-known clinical observations: larger language cortex in girls better language functions; larger caudate nucleus in girls less prone to develop ADHD; larger amygdala in boys less prone to develop mood disorders33,34,54. While the simple arrow in such relations certainly is a huge oversimplification, these examples may serve to illustrate what kind of information may be gained by investigating such a “normal”, but immensely complex process as the orderly development of the human brain. The task of unraveling the details of this process has only just begun.
relevance for our understanding of normal development: the developmental patterns that emerge following this and other MRI-studies allow to develop and test theories on how normal development is influenced and how the observable changes in different areas interrelate. Establishing such patterns would allow observing developmental abnormalities much earlier.
relevance for our understanding of pathological processes: both the knowledge of normal and the only thus-possible description of abnormal development allow to further investigate diseases with a putative developmental component, like ADHD or obsessive-compulsive disorder33,34. The strong influence of gender on the many of the epidemiological features of those disorders (e.g., prevalence, age of onset, and clinical symptomatology) may itself be a manifestation of underlying structural differences between the genders; knowledge of such differences will thus further our understanding of these common childhood disorders.
Possible limitations of this study
It should be noted that our three age groups cover different age ranges and that the gender subgroups groups are partly significantly different with regard to age (e.g., the young girls are older than the young boys). This precludes straightforward comparisons between these subgroups and should be kept in mind when analyzing the respective tables.
As noted before27, our approach to study volumetric effects has the advantage of being fast, accurate, and reproducible, but (in a given single case) may yield less accurate results than a careful manual delineation of the structures of interest. Nevertheless, we think that by choosing an advanced image processing stream and taking into account the specific problems when analyzing pediatric brain data15,22, reliability of our data should be high. Moreover, due to the large sample size we were able to investigate, a manual tracing procedure would have been extremely time-consuming, effectively requiring the use of an automated approach.
As to the “local” analyses, it should be noted that, due to the matched filter theorem, we were most sensitive to tissue changes on the spatial order of the smoothing filter (i.e., 12 mm28). While comparable widths have been used repeatedly in gray matter studies57,58, the adequate filter size for white matter has not yet been thoroughly investigated. For ease of comparability, we chose to apply the same filter widths for both analyses, but it should be kept in mind that choosing a different width would have influenced the resulting pattern.
We did not examine cerebellar volume specifically (i.e., other than as part of the global tissue volume). This was done due to the less reliable tissue segmentation achievable in this structure with the current software20 and considerations of non-optimal coverage in some subjects. Dedicated high-resolution images of this very interesting structure and the use of more appropriate segmentation algorithms may be necessary in order to adequately examine the exact volumetric changes taking place there.
Acknowledgements
We would like to thank Anna M. Weber Byars, PhD, and Richard H: Strawsburg, MD, for performing the neuropsychological testing and the neurological examination. We also thank William S. Ball, Jr., MD, for reading the anatomical scans for structural abnormalities. Finally, our gratitude belongs to the large number of subjects and families: without their enthusiastic participation, this study would not have been possible.
This work was funded in part by a grant from the National Institutes of Child Health and Human Development, RO1-HD38578-01.
References
- 1.Giedd JN, Snell JW, Lange N, et al. Quantitative magnetic resonance imaging of human brain development: ages 4–18. Cereb Cortex. 1996;6:551–560. doi: 10.1093/cercor/6.4.551. [DOI] [PubMed] [Google Scholar]
- 2.Courchesne E, Chisum HJ, Townsend J, et al. Normal brain development and aging: quantitative analysis at in vivo MR imaging in healthy volunteers. Radiology. 2000;216:672–682. doi: 10.1148/radiology.216.3.r00au37672. [DOI] [PubMed] [Google Scholar]
- 3.Ball WS, Jr, Dunn RS. Computed tomography and magnetic resonance imaging. In: Ball WS Jr, editor. Pediatric Neuroradiology. 1st ed. Philadelphia, PA: Lippincott Raven; 1997. p. 17. [Google Scholar]
- 4.DeBellis MD, Keshavan MS, Beers SR, et al. Sex differences in brain maturation during childhood and adolescence. Cereb Cortex. 2001;11:552–557. doi: 10.1093/cercor/11.6.552. [DOI] [PubMed] [Google Scholar]
- 5.Sowell ER, Thompson PM, Holmes CJ, et al. Localizing age-related changes in brain structure between childhood and adolescence using statistical parametric mapping. NeuroImage. 1999;9:587–597. doi: 10.1006/nimg.1999.0436. [DOI] [PubMed] [Google Scholar]
- 6.Pfefferbaum A, Mathalon DH, Sullivan EV, Rawles JM, Zipursky RB, Lim KO. A quantitative magnetic resonance imaging study of changes in brain morphology from infancy to late adulthood. Arch Neurol. 1994;51:874–887. doi: 10.1001/archneur.1994.00540210046012. [DOI] [PubMed] [Google Scholar]
- 7.Reiss AL, Abrams MT, Singer HS, Ross JL, Denckla MB. Brain development, gender and IQ in children. A volumetric imaging study. Brain. 1996;119:1763–1774. doi: 10.1093/brain/119.5.1763. [DOI] [PubMed] [Google Scholar]
- 8.Giedd JN, Blumenthal J, Jeffries NO, et al. Brain development during childhood and adolescence: a longitudinal MRI study. Nat Neurosci. 1999;2:861–863. doi: 10.1038/13158. [DOI] [PubMed] [Google Scholar]
- 9.Castellanos FX, Lee PP, Sharp W, et al. Developmental trajectories of brain volume abnormalities in children and adolescents with attention-deficit/hyperactivity disorder. JAMA. 2002;288:1740–1748. doi: 10.1001/jama.288.14.1740. [DOI] [PubMed] [Google Scholar]
- 10.Holland SK, Plante E, Weber Byars A, Strawsburg RH, Schmithorst VJ, Ball WS., Jr Normal fMRI brain activation patterns in children performing a verb generation task. NeuroImage. 2001;14:837–843. doi: 10.1006/nimg.2001.0875. [DOI] [PubMed] [Google Scholar]
- 11.Carrow-Woolfolk E. Oral and Written Language Scales: Written Expression Scale Manual. Circle Pines, MN: American Guidance Service; 1996. [Google Scholar]
- 12.Wechsler D. Manual for the Wechsler preschool and primary scale of intelligence, rev. San Antonio, TX: The Psychological Corporation; 1989. [Google Scholar]
- 13.Wechsler D. Manual for the Wechsler intelligence scale for children. 3rd ed. San Antonio, TX: The Psychological Corporation; 1991. [Google Scholar]
- 14.Wechsler D. Manual for the Wechsler Adult Intelligence Scale-III. New York, NY: The Psychological Corporation; 1997. [Google Scholar]
- 15.Wilke M, Schmithorst VJ, Holland SK. Assessment of spatial normalization of whole-brain MR-images in children. Hum Brain Mapp. 2002;17:48–60. doi: 10.1002/hbm.10053. [DOI] [PMC free article] [PubMed] [Google Scholar]
- 16.Ugurbil K, Garwood M, Ellermann J, et al. Imaging at high magnetic fields: initial experiences at 4 T. Magn Reson Q. 1993;9:259–277. [PubMed] [Google Scholar]
- 17.Friston KJ, Holmes AP, Worsley KJ, Poline JP, Frith CD, Frackowiak RSJ. Statistical parametric maps in functional imaging: A general linear approach. Hum Brain Mapp. 1995;2:189–210. [Google Scholar]
- 18.Ashburner J, Friston KJ. Nonlinear spatial normalization using basis functions. Hum Brain Mapp. 1999;7:254–266. doi: 10.1002/(SICI)1097-0193(1999)7:4<254::AID-HBM4>3.0.CO;2-G. [DOI] [PMC free article] [PubMed] [Google Scholar]
- 19.Ashburner J, Friston KJ. Multimodal Image Coregistration and Partitioning - a Unified Framework. NeuroImage. 1997;6:209–217. doi: 10.1006/nimg.1997.0290. [DOI] [PubMed] [Google Scholar]
- 20.Ashburner J, Friston KJ. Voxel-based morphometry - the methods. NeuroImage. 2000;11:805–821. doi: 10.1006/nimg.2000.0582. [DOI] [PubMed] [Google Scholar]
- 21.Chard DT, Parker GJ, Griffin CM, Thompson AJ, Miller DH. The reproducibility and sensitivity of brain tissue volume measurements derived from an SPM-based segmentation methodology. J Magn Reson Imaging. 2002;15:259–267. doi: 10.1002/jmri.10064. [DOI] [PubMed] [Google Scholar]
- 22.Wilke M, Schmithorst VJ, Holland SK. Normative pediatric brain data for spatial normalization and segmentation differs from standard adult data. Magn Res Med. 2003 doi: 10.1002/mrm.10606. in press. [DOI] [PubMed] [Google Scholar]
- 23.Good CD, Johnsrude I, Ashburner J, Henson RN, Friston KJ, Frackowiak RS. Cerebral asymmetry and the effects of sex and handedness on brain structure: a voxel-based morphometric analysis of 465 normal adult human brains. NeuroImage. 2001;14:685–700. doi: 10.1006/nimg.2001.0857. [DOI] [PubMed] [Google Scholar]
- 24.Amunts K, Schlaug G, Schleicher A, et al. Asymmetry in the human motor cortex and handedness. NeuroImage. 1996;4:216–222. doi: 10.1006/nimg.1996.0073. [DOI] [PubMed] [Google Scholar]
- 25.Lange N, Giedd JN, Castellanos FX, Vaituzis AC, Rapoport JL. Variability of human brain structure size: ages 4–20 years. Psychiatry Res. 1997;4:1–12. doi: 10.1016/s0925-4927(96)03054-5. [DOI] [PubMed] [Google Scholar]
- 26.Tzourio-Mazoyer N, Landeau B, Papathanassiou D, et al. Automated anatomical labeling of activations in SPM using a macroscopic anatomical parcellation of the MNI MRI single-subject brain. NeuroImage. 2002;15:273–289. doi: 10.1006/nimg.2001.0978. [DOI] [PubMed] [Google Scholar]
- 27.Wilke M, Sohn JH, Weber Byars AM, Holland SK. Bright spots: correlations of gray matter volume with IQ in a normal pediatric population. NeuroImage. 2003 doi: 10.1016/s1053-8119(03)00199-x. in press. [DOI] [PubMed] [Google Scholar]
- 28.White T, O'Leary D, Magnotta V, Arndt S, Flaum M, Andreasen NC. Anatomic and Functional Variability: The Effects of Filter Size in Group fMRI Data Analysis. NeuroImage. 2001;13:577–588. doi: 10.1006/nimg.2000.0716. [DOI] [PubMed] [Google Scholar]
- 29.Genovese CR, Lazar NA, Nichols T. Thresholding of statistical maps in functional neuroimaging using the false discovery rate. NeuroImage. 2002;15:870–878. doi: 10.1006/nimg.2001.1037. [DOI] [PubMed] [Google Scholar]
- 30.Rorden C, Brett M. Stereotaxic display of brain lesions. Behav Neurol. 2000;12:191–200. doi: 10.1155/2000/421719. [DOI] [PubMed] [Google Scholar]
- 31.Courchesne E, Plante E. Measurement and analysis issues in neurodevelopmental magnetic resonance imaging. In: Thatcher RW, Lyon GR, Rumsey J, Krasnegor N, editors. Developmental neuroimaging: mapping the development of brain and behavior. 1st ed. San Diego, CA: Academic Press; 1996. p. 43. [Google Scholar]
- 32.Rivkin MJ. Developmental neuroimaging of children using magnetic resonance techniques. Ment Retard Dev Disabil Res Rev. 2000;6:68–80. doi: 10.1002/(SICI)1098-2779(2000)6:1<68::AID-MRDD9>3.0.CO;2-9. [DOI] [PubMed] [Google Scholar]
- 33.Durston S, Hulshoff Pol HE, Casey BJ, Giedd JN, Buitelaar JK, van Engeland H. Anatomical MRI of the developing human brain: what have we learned? J Am Acad Child Adolesc Psychiatry. 2001;40:1012–1020. doi: 10.1097/00004583-200109000-00009. [DOI] [PubMed] [Google Scholar]
- 34.Eliez S, Reiss AL. MRI neuroimaging of childhood psychiatric disorders: a selective review. J Child Psychol Psychiatry. 2000;41:679–694. [PubMed] [Google Scholar]
- 35.Various authors. Fundamentals of developmental neurobiology. In: Nelson CA, Luciana M, editors. Handbook of developmental cognitive neuroscience. 1st ed. Cambridge, MA: MIT Press; 2001. p. 3. [Google Scholar]
- 36.Barkovich AJ. Normal development of the neonatal and infant brain, skull, and spine. In: Barkovich AJ, editor. Pediatric Neuroimaging. 3rd ed. Philadelphia, PA: Lippincott Williams & Wilkins; 2000. p. 13. [Google Scholar]
- 37.Casey BJ, Giedd JN, Thomas KM. Structural and functional brain development and its relation to cognitive development. Biol Psychol. 200;54:241–257. doi: 10.1016/s0301-0511(00)00058-2. [DOI] [PubMed] [Google Scholar]
- 38.Thompson PM, Cannon TD, Narr KL, et al. Genetic influences on brain structure. Nat Neurosci. 2001;4:1253–1258. doi: 10.1038/nn758. [DOI] [PubMed] [Google Scholar]
- 39.Cameron JL. Effects of sex hormones on brain development. In: Nelson CA, Luciana M, editors. Handbook of developmental cognitive neuroscience. 1st ed. Cambridge, MA: MIT Press; 2001. p. 59. [Google Scholar]
- 40.Sowell ER, Peterson BS, Thompson PM, Welcome SE, Henkenius AL, Toga AW. Mapping cortical change across the human life span. Nat Neurosci. 2003;6:309–315. doi: 10.1038/nn1008. [DOI] [PubMed] [Google Scholar]
- 41.Cabeza R, Nyberg L. Imaging cognition II: An empirical review of 275 PET and fMRI studies. J Cogn Neurosci. 2001;12:1–47. doi: 10.1162/08989290051137585. [DOI] [PubMed] [Google Scholar]
- 42.Swick D, Jovanovic J. Anterior cingulate cortex and the Stroop task: neuro-psychological evidence for topographic specificity. Neuropsychologia. 2002;40:1240–1253. doi: 10.1016/s0028-3932(01)00226-3. [DOI] [PubMed] [Google Scholar]
- 43.Ashburner J, Hutton C, Frackowiak R, Johnsrude I, Price C, Friston K. Identifying global anatomical differences: deformation-based morphometry. Hum Brain Mapp. 1998;6:348–357. doi: 10.1002/(SICI)1097-0193(1998)6:5/6<348::AID-HBM4>3.0.CO;2-P. [DOI] [PMC free article] [PubMed] [Google Scholar]
- 44.Reiss AL, Mazzocco MM, Greenlaw R, Freund LS, Ross JL. Neurodevelopmental effects of X monosomy: a volumetric imaging study. Ann Neurol. 1995;38:731–738. doi: 10.1002/ana.410380507. [DOI] [PubMed] [Google Scholar]
- 45.Brown WE, Kesler SR, Eliez S, et al. Brain development in Turner syndrome: a magnetic resonance imaging study. Psychiatry Res. 2002;116:187–196. doi: 10.1016/s0925-4927(02)00086-0. [DOI] [PMC free article] [PubMed] [Google Scholar]
- 46.Sowell ER, Thompson PM, Tessner KD, Toga AW. Mapping continued brain growth and gray matter density reduction in dorsal frontal cortex: Inverse relationships during postadolescent brain maturation. J Neurosci. 2001;21:8819–8829. doi: 10.1523/JNEUROSCI.21-22-08819.2001. [DOI] [PMC free article] [PubMed] [Google Scholar]
- 47.Sampaio RC, Truwitt CL. Myelination in the developing brain. In: Nelson CA, Luciana M, editors. Handbook of developmental cognitive neuroscience. MIT Press; 2001. pp. 35–44. [Google Scholar]
- 48.Staudt M, Schropp C, Staudt F, et al. MRI assessment of myelination: an age standardization. Pediatr Radiol. 1994;24:122–127. doi: 10.1007/BF02020169. [DOI] [PubMed] [Google Scholar]
- 49.Bourgeois JP. Synaptogenesis in the neocortex of the newborn: the ultimate frontier for individuation? In: Nelson CA, Luciana M, editors. Handbook of developmental cognitive neuroscience. 1st ed. Cambridge, MA: MIT Press; 2001. p. 23. [Google Scholar]
- 50.Huttenlocher PR. Morphometric study of human cerebral cortex development. Neuropsychologia. 1990;28:517–527. doi: 10.1016/0028-3932(90)90031-i. [DOI] [PubMed] [Google Scholar]
- 51.Pfluger T, Weil S, Vollmar C, et al. Normative volumetric data of the developing hippocampus in children based on magnetic resonance imaging. Epilepsia. 1999;40:414–423. doi: 10.1111/j.1528-1157.1999.tb00735.x. [DOI] [PubMed] [Google Scholar]
- 52.Patwardhan AJ, Brown WE, Bender BG, Linden MG, Eliez S, Reiss AL. Reduced size of the amygdala in individuals with 47,XXY and 47,XXX karyotypes. Am J Med Genet. 2002;114:93–98. doi: 10.1002/ajmg.10154. [DOI] [PubMed] [Google Scholar]
- 53.Harasty J, Double KL, Halliday GM, Kril JJ, McRitchie DA. Language-associated cortical regions are proportionally larger in the female brain. Arch Neurol. 1997;54:171–176. doi: 10.1001/archneur.1997.00550140045011. [DOI] [PubMed] [Google Scholar]
- 54.Binder JR. Functional MRI of the language system. In: Moonen CTW, Bandettini PA, editors. Functional MRI. Berlin Heidelberg New York: Springer; 2000. p. 407. [Google Scholar]
- 55.Paus T, Zijdenbos A, Worsley K, et al. Structural maturation of neural pathways in children and adolescents: in vivo study. Science. 1999;283:1908–1911. doi: 10.1126/science.283.5409.1908. [DOI] [PubMed] [Google Scholar]
- 56.Schmithorst VJ, Wilke M, Dardzinski BJ, Holland SK. Correlation of white matter diffusivity and anisotropy with age during childhood and adolescence: a cross-sectional diffusion-tensor MR imaging study. Radiology. 2002;222:212–218. doi: 10.1148/radiol.2221010626. [DOI] [PMC free article] [PubMed] [Google Scholar]
- 57.Wilke M, Kaufmann C, Grabner A, Pütz B, Wetter TC, Auer DP. Gray matter-changes and correlates of disease severity in schizophrenia: a statistical parametric mapping study. NeuroImage. 2001;13:814–824. doi: 10.1006/nimg.2001.0751. [DOI] [PubMed] [Google Scholar]
- 58.Wright IC, Ellison ZR, Sharma T, Friston KJ, Murray RM, McGuire PK. Mapping of grey matter changes in schizophrenia. Schizophr Res. 1999;35:1–14. doi: 10.1016/s0920-9964(98)00094-2. [DOI] [PubMed] [Google Scholar]


