Abstract
Differentiation and proliferation of haematopoietic progenitor cells occur in intimate contact with the bone marrow microenvironment which is composed of stromal cells and extracellular matrix proteins. MOP3 (also known as brain and muscle Arnt-like protein-1, BMAL1), a master regulator of circadian rhythm, plays important roles in the regulation of cell differentiation and general physical functions. In the present studies, MOP3-deficient mice had significantly reduced levels of B cells in the peripheral blood, spleen and bone marrow compared MOP3+/− or MOP3+/+ littermates. Flow cytometry analysis showed the levels of pre-B cells in bone marrow of MOP3−/− mice were similar as that in control mice. Adoptive transfer of MOP3−/− bone marrow cells (BMC) to lethally irradiated BALB/c Rag2−/− recipients, normal T and B cell development was observed, whereas Adoptive transfer of BALB/c BMC to lethally irradiated MOP3−/− recipients, B-cell development was significantly impaired. These results presented herein with MOP3-deficient mice reveal the involvement of MOP3 in the development of B cells, but not other immune cells. The effect of MOP3 on the differentiation of pre-B cells to mature B cells might be mediated by the bone marrow microenvironment. This study also showed a connection between a master regular of circadian rhythm with B-cell development in mice.
Keywords: MOP3, B-cell development, molecular clock, PAS, bone marrow cells
Introduction
The basic-helix-loop-helix (bHLH)-product of the Drosophila period gene (PER)-aryl hydrocarbon receptor nuclear translocator (ARNT)-SIM (PAS) superfamily plays crucial roles in adaptive responses to low atmospheric and cellular oxygen levels, exposure to certain environmental pollutants, and diurnal oscillations in light and temperature.1–3 MOP3, also known as ARNT3 or brain and muscle Arnt-like protein-1 (BMAL1), is a member of the PAS superfamily, and a key transcription factor in the transcriptional/translational feedback loop of mammalian circadian genes.4 It was previously shown that mice deficient in the BMAL1/MOP3 gene become immediately arrhythmic in constant darkness and have reduced locomotor activity levels under entrained and constant conditions. MOP3 forms heterodimers with another bHLH/PAS protein, CLOCK (product of the clock locus in mice), which drive transcription from E-Box elements found in the promoter of circadian responsive genes, including period 1 and cryptochrome.5
Although the precise role of peripheral clocks and the mechanisms that link them to the hypothalamic suprachiasmatic nucleus remain largely obscure, the genetic techniques, including gene mutation or deletion, have indicated that some these genes may play a regulatory role in cellular function, including cell division, oestrous and phospholipid metabolism.3,6,7 Recent studies indicate that BMAL1, a master regulator of circadian rhythm, also plays important roles in the regulation of adipose differentiation and lipogenesis in mature adipocytes, the glucose homeostasis, and energy balance.8–10
Differentiation and proliferation of haematopoietic progenitor cells occurs in intimate contact with the bone marrow microenvironment, which is composed of stromal cells, including vascular endothelial cells, adipocytes and bone-lining cells, as well as extracellular matrix proteins. Haematopoiesis occurs under relatively hypoxic conditions in the bone marrow.11 Vascular endothelial growth factor (VEGF), a putative target gene for hypoxia inducible factor-1α (HIF-1α)-containing and endothelial PAS-2 (EPAS1)/HIF-2α-containing HIF transcription factor complexes, is induced by hypoxia and has been implicated in haematopoietic development.12 It is reported that disordered circadian rhythm would change the host immunity.13,14 In order to determine whether the circadian rhythm-related gene MOP3 plays a role in immunity, we evaluated the immune system and function in MOP3-deficient mice. Here, our experimental results have shown that MOP3 deficiency significantly affected B-cell development in mice.
Materials and methods
Animals
Five to 7-week-old BALB/c (H-2d), BALB/c Rag2–/–, C57BL/6 (B6, H-2b) and C3H (H-2 k) mice were purchased from Taconic (Germantown, NY). Lewis rats were purchased from Charles River Laboratories (Wilmington, MA). Homozygous MOP3 deficient mice (MOP3–/–) in C57BL/6 background were produced by breeding heterozygous MOP3-deficient pairs (MOP3+/–) that were kindly provided by Dr Christopher A. Bradfield, University of Wisconsin Medical School (Madison, WI), and confirmed by reverse transcription–polymerase chain reaction (RT–PCR) as reported before.4 All mice and rats were maintained in a specific pathogen-free facility and were housed in microisolator cages containing autoclaved feed, bedding, and water. Animal care was in accordance with the American Association for the Accreditation of Laboratory Animal Care and institutional guidelines.
Monoclonal antibodies (mAb)
The following mAb were purchased from BD PharMingen (San Diego, CA). Fluoroscein isothiocyanate (FITC)-conjugated anti-mouse B220 mAb (RA3-6B2, rat immunoglobulin G2a (IgG2a)), FITC-labelled anti-mouse I-Ab mAb (AF6-120·1; mouse IgG2a), FITC-labelled anti-mouse I-Ad mAb (34-5-3, IgG2a), FITC-labelled anti-mouse T-cell receptor (TCR) β-chain mAb (H57-597, Armenian hamster IgG2), FITC-labelled anti-CD21/CD35 mAb (CR2/CR1; 7G6, rat IgG2b), FITC-labelled anti-mouse CD23 mAb (FcεRII; B3B4, rat IgG2a), FITC-labelled anti-mouse CD43 mAb (Ly-48, leukosialin; S7, rat IgG2a), FITC-conjugated mouse anti-mouse NK1.1 (Ly-55) mAb (PK136, IgG2a), FITC-conjugated rat anti-mouse IgG1 mAb (A85-1, IgG1), FITC-conjugated rat anti-mouse IgG2a mAb (R19-15, IgG1), FITC-conjugated rat anti-mouse IgG2b mAb (R12-3, IgG2a), FITC-conjugated rat anti-mouse IgG3 mAb (R40-82, IgG2a), phycoerythrin (PE)-labelled anti-mouse CD4 mAb (RM4-5; rat IgG2a), PE-labelled anti-mouse CD8α mAb (53-6.7; rat IgG2a), PE-labelled anti-mouse IgM mAb, PE-labelled anti-mouse B220 mAb, PE-labelled anti-mouse CD23 mAb, PE-labelled anti-mouse CD21 mAb, PE-labelled anti-mouse Mac1 mAb and biotin-labelled anti-mouse H-2Kb mAb (AF6-88·5, IgG2a). In addition, anti-mouse FcεII/IIIR mAb (2.4G2, rat IgG2b) was produced by 2.4G2 hybridoma in vitro in our laboratory (ATCC, Rockville, MD).
Cell staining and flow cytometry (FCM)
Mouse splenocytes were prepared, and red blood cells were lysed with ACK Lysis buffer (Invitrogen, San Diego, CA) as described before.15,16 Peripheral blood mononuclear cells (PBMC) were prepared with Histopaque-1077 (Sigma Chemical Co., St. Louis, MO). Cells were stained with PE-labelled anti-CD4 or CD8 mAb versus FITC-labelled anti-TCR β mAb or different FITC- or PE-labelled mAb combinations. Non-specific FcR binding was blocked by anti-mouse FcR mAb 2.4G2. Cells were analysed by two-colour FCM. Non-viable cells were excluded using the vital nucleic acid stain propidium iodide (PI). Ten thousand cells were assayed by one-colour or two-colour FCM using a FACSCalibur instrument (BD Biosciences, San Jose, CA). The percentage of cells staining with a particular reagent or reagents was determined by subtracting the percentage of cells staining non-specifically with the negative control mAb from staining in the same dot-plot region with the anti-mouse mAb.
Detection of antixenoantigen Ab production in sera by FCM
For immunization, MOP3+/+ and MOP3–/– mice were intraperitoneally injected with human peripheral blood lymphocytes (PBL).17 The levels of anti-donor antibody products in sera were detected as reported before.18,19 Briefly, 1 × 10⁶ donor PBL were stained with 10 µl of mouse serum for 30 min at 4°, washed, then incubated with each of FITC-conjugated rat anti-mouse IgG1, IgG2a, IgG2b, IgG3 or IgM mAb at 4° for 30 min 10 000 cells for each sample were analysed by using a FACScan flow cytometer. Non-viable cells were excluded using PI. The levels of anti-donor antibodies in sera were determined by subtracting the median fluorescence intensity (MFI) of cells staining non-specifically with naïve mouse serum from MFI staining with mouse serum samples.
Adoptive transfer animal models
T-cell depleted MOP3+/+, MOP3+/–, MOP3–/– or BALB/c mouse bone marrow cells (BMC) were prepared as reported previously.20 Six to 8-week-old BALB/c Rag2–/– or B6 Rag2–/– mice received 8 Gy whole body X-ray irradiation and an intravenous (i.v.) injection of 1 × 10⁷ T-cell depleted BMC during 4–8 hr after irradiation. In some experiments, MOP3+/+ or MOP3–/– mice were used as recipients that received lethal whole body irradiation (10 Gy X-rays) and an i.v. injection of 1 × 10⁷ T-cell depleted allogeneic BALB/c BMC.
RT–PCR analysis of MOP3 mRNA expression in the peripheral tissues
The brain and peripheral tissues were used for mRNA isolation using Trizol (Life Technologies Inc., Gaithersburg, MD). cDNA was prepared from 2 µg total RNA with 50 µm oligo(dT)20 and 15 units of Thermo ScriptTM reverse transcriptase (Gibco-BRL); 2 µl of the cDNA mixture was used in a PCR reaction with 10 pmol of forward and reverse primers and 2 U of Platinum Taq DNA polymerase (Life Technologies/Gibco-BRL). The primer sequences and sizes of specific PCR products were as follows. Primers for MOP3: sense, 5′-ACCGACCTACTCTCCGG-3′; antisense, 5′-CAATCTGACTGTGGGCC-3′ (202 bp). The primers for β-actin: sense, 5′-ATGGATG ACGATATCGCT-3′, and antisense, 5′-ATGAGGTAGTC TGTCAGGT-3′ (569 bp). The intensity of each band was determined by densitometry analysis of gels using a Kodak DC 120 zoom digital camera and Kodak 1D image analysis software. Semiquantitative analysis of gene expression level was determined using the housekeeping gene β-actin, which is generally assumed to be constitutively expressed at similar levels in all cell types and tissues21 as an internal standard. Data are presented as the ratio between the optical density (OD) of cytokine gene and the OD value of its internal standard β-actin.
Peripheral blood cell counts
The cell numbers of immune cells in peripheral blood were detected by a Sysmex PocH-100iTM Automated Hematology Analyzer (Sysmex Inc., Mundelein, IL) in the Clinical Laboratories of The Nebraska Medical Center.
Statistical analysis
All data are reported as the mean ± SD. Student's t-test for comparison of means was used to compare groups. A P-value less than 0·05 was considered to be statistically significant.
Results
The expressions of MOP3 mRNA in primary and secondary lymphoid organs
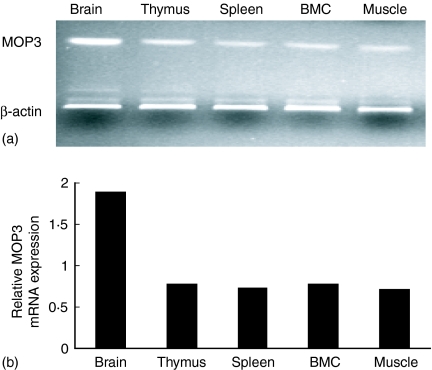
Although it has been reported that brain, thymus, and skeletal muscle expressed high levels of MOP3 in neonatal and adult mice,5 whether other tissues in immune system express MOP3 or not has not been determined. We therefore detected the expression of MOP3 mRNA in the primary and secondary immune tissues using RT–PCR. As shown in Fig. 1, C57BL/6 mouse thymus, spleen and bone marrow tissues expressed high levels of MOP3 mRNA, although their levels were somewhat lower than brain. Identical results were observed in BALB/c mice (data not shown).
Figure 1.
The expressions of MOP3 mRNAs in the immune system. The mRNA levels in B6 mouse primary and secondary immune tissues were determined by RT–PCR as described in Materials and methods. (a) One representative of the expression of MOP3 mRNA in brain, thymus, spleen, bone marrow and muscle was shown. (b) The quantification of the MOP3 mRNA expression in mouse brain, thymus, spleen, bone marrow and muscle. The ratio of the OD value of MOP mRNA product to its internal standard β-actin was calculated. Data are one representative of two independent experiments, with similar results.
No detectable changes of the cell numbers and function of T cells in MOP3–/– mice
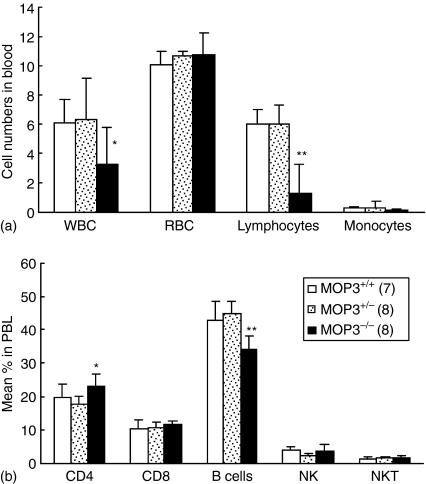
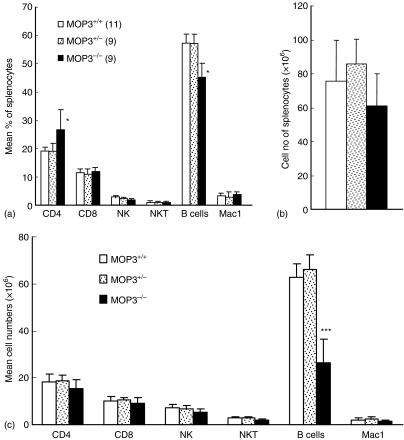
The cell numbers of white blood cells (WBC) and lymphocytes in the peripheral blood of MOP3–/– mice were significantly lower than that of age-matched MOP3+/– or MOP3+/+ mice, whereas red blood cells (RBC) and monocytes showed normal levels in MOP3–/– mice (Fig. 2a). In order to determine whether or not the decreased lymphocyte numbers in the blood of MOP3–/– mice is caused by the impaired development and/or peripheral maintenance of T cells, we subsequently compared the levels of CD4+ or CD8+ T cells in the peripheral blood and spleens of wild type, MOP3+/– or MOP3–/– littermates. As assessed by flow cytometry, the percentage of CD4+ T cells were significantly enhanced in MOP3–/– mice compared with either MOP3+/– or MOP3+/+ littermates (P < 0·05, Fig. 2b), whereas the levels of other WBC including CD8+ T cells, natural killer (NK) cells, and NKT cells displayed normal in these mice. In accordance with the peripheral blood, there were significantly higher percentages of CD4+ T cells in the spleens of MOP3–/– mice compared with the controls (P < 0·05, Fig. 3a). However, together with the tendency of total cell numbers of spleens in MOP3–/– mice, the absolute cell numbers of CD4+ T cells in MOP3–/– mice did not exhibit meaningful changes (P > 0·05, Fig. 3b). In addition, the expressions of naive or memory markers such as CD45RB, CD62L, CD44 or CD25 on CD4+ splenocytes in MOP3–/– mice were similar as in wild type or MOP3 heterozygous mice (data not shown). These data collectively indicated that relatively enhanced percentages of CD4+ T cells but unchanged cell numbers of CD4+ T cells might present in the periphery of MOP3–/– mice.
Figure 2.
The levels of immune cells in the peripheral blood of MOP3+/+, MOP3+/– and MOP3–/– littermates. (a) WBC counts in each mouse line were performed by an automated haematology analyser. The data were presented as ×103 cells/µl for WBC, ×106 cells/µl for RBC, ×103 cells/mm3 for lymphocytes and monocytes. (b) The percentages of CD4+ T, CD8+ T, B, and NK cells in the peripheral blood of MOP3+/+, MOP3+/– and MOP3–/– mice were detected by FCM. Data were presented as mean ± SD. *P < 0·05; **P < 0·01, compared with either MOP3+/+ or MOP3+/– mice. A summary of three independent experiments is shown.
Figure 3.
The levels of immune cells in the spleens of MOP3+/+, MOP3+/– and MOP3–/– mice. The percentages of immune cells in spleens of MOP3+/+, MOP3+/– and MOP3–/– mice were detected by FCM. (a) The percentages of CD4+ T, CD8+ T, B, macrophage, NK and NKT cells in spleens of MOP3+/+, MOP3+/– and MOP3–/– mice.(b) The total cell numbers in spleens of MOP3+/+, MOP3+/– and MOP3–/– mice. (c) The cell numbers of CD4+ T, CD8+ T, B, macrophage, NK and NKT cells in spleens of MOP3+/+, MOP3+/– and MOP3–/– mice. Data were presented as mean ± SD. *P < 0·05; **P < 0·01, ***P < 0·001 compared with either MOP3+/+ or MOP3+/– mice. A summary of three independent experiments is shown.
T cell development in the thymus is controlled at multiple stages by signals emanating from cell surface receptors
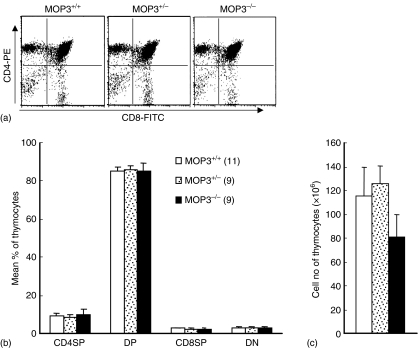
Different developmental stages of T cells within the thymus can be defined by expression of coreceptor molecules CD4 and CD8.22,23 When the thymocytes in these mouse lines were assayed by two-colour FCM, no significant difference for the levels of CD4 single positive (SP), CD8SP, CD4/CD8 double positive (DP) or CD4/CD8 double negative (DN) thymocytes in MOP3–/–, MOP3+/– or MOP3+/+ mice was observed (Fig. 4). The total cell numbers of thymocytes in all these mouse lines were comparable (Fig. 4c). Thus, MOP3 does not play a critical role in T-cell development in the thymus in mice.
Figure 4.
The thymocyte subsets in MOP3+/+, MOP3+/– and MOP3–/– mice. (a) One representative of thymocyte subsets detected by two-colour FCM was shown. (b) The percentages of CD4SP, CD8SP, CD4CD8DP, and CD4CD8DN thymocytes in MOP3+/+, MOP3+/– and MOP3–/– mice. SP, single positive; DP, double positive; DN, double negative. (c) The total cell numbers of thymocytes in MOP3+/+, MOP3+/– and MOP3–/– mice. Data were presented as mean ± SD. A summary of three independent experiments were shown. No statistical difference was observed among the comparable groups (P > 0·05).
Although slightly enhanced percentages of CD4+ T cells in the periphery, T cells in MOP3–/–mice showed normal responses to mitogen (concanavalin A), as well as allogeneic or xenogeneic antigens in vitro as the control wild type or MOP3+/– mice, when detected by the classic 3H-thymidine incorporation assay for cell proliferation (data not shown). Thus, the development and function of T cells were not remarkably altered in MOP3-deficient mice.
Significantly reduced numbers of B cells in the peripheral blood and spleens of MOP3–/– mice
Although there were no remarkable changes for T cells in the periphery of MOP3–/– mice, significantly reduced percentages of B cells in the peripheral blood of MOP3–/– mice were observed, as detected by FCM (P < 0·01, compared with MOP3+/+ or MOP3+/– mice, respectively; Fig. 2). In accordance with the peripheral blood, there were significantly lower percentages and total cell numbers of B cells in the spleens of MOP3–/– mice compared with the controls (P < 0·05, or P < 0·01, respectively; Fig. 3a). The levels of B cells in spleens and peripheral blood in MOP3+/– and MOP3+/+ did not show statistic difference (P > 0·05). In addition, B cells in MOP3–/– mice showed normal response to LPS in vitro as the wild type or heterozygous control mice (data not shown), indicating that the peripheral mature B cells in MOP3-deficient mice might be functional.
Changes of B-cell subpopulations in the spleens of MOP3–/– mice
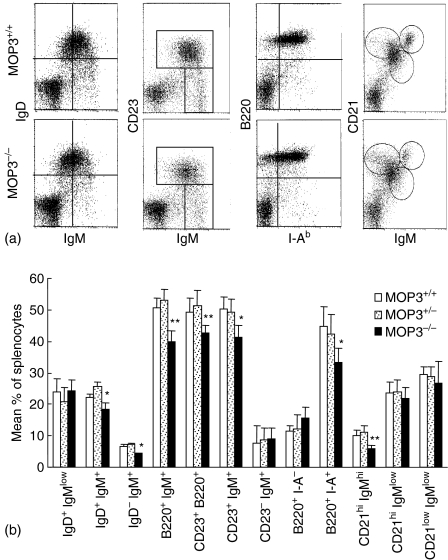
To evaluate the effects of MOP deficiency on the development and maintenance of B-cell subpopulations, we compared the cellular composition and cell surface phenotype of splenic B cells obtained from MOP3–/–, MOP3+/– and MOP+/+ mice using FCM. The levels of B220+ IgM+, CD23+ B220+, or B220+ I-Ab+ cells in MOP3–/– mice were significantly decreased (P < 0·01, compared with MOP3+/+ or MOP3+/– mice, respectively; Fig. 5), suggesting the decreased mature B-cell level in MOP3-deficient mice existed. B cells expressing low levels of CD21, high levels of mIgM and no IgD are recently immigrants from the bone marrow and designed type I transitional B cells. The fraction of B cells that expresses high levels of both IgM and CD21 and is positive for IgD is type II transitional B cells.24 The percentages of IgD– IgM+ cells in MOP3–/– mice were significantly lower than MOP3+/– or MOP3+/+ mice (P < 0·05). Furthermore, as is shown in Fig. 5, the fraction of IgM+CD23+ cells, denoting follicular B cells, was significantly different in the spleen of MOP3–/– mice from that in wild-type mice. Staining with CD21 revealed a reduction of CD21+ IgMhigh T2 transitional B cells in MOP3–/– mice. Thus, several B-cell subpopulations in spleens were altered in MOP3 deficient mice.
Figure 5.
The B-cell subpopulations in the spleens of MOP3+/+, MOP3+/– and MOP3–/– mice. (a) One representative of B-cell subsets detected by two-colour FCM was shown. (b) The mean percentages of B-cell subpopulations in spleens of MOP3+/+, MOP3+/– and MOP3–/– mice. Data are presented as mean ± SD. A summary of three independent experiments were shown. More than nine mice in each group were used. *P < 0·05, **P < 0·01, ***P < 0·001 compared with either age-matched MOP3+/+ or MOP3+/– mice.
Decreased antibody products in MOP3–/– mice immunized with xenoantigens
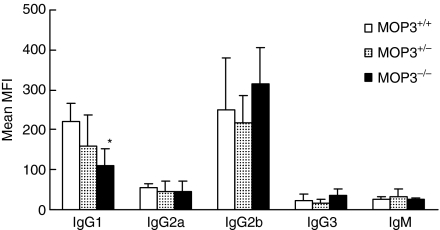
To determine whether or not the humoral immune response in MOP3–/– mice was impaired, we detected the levels of anti-donor antibodies in MOP3–/– mice after immunization with xenogeneic human PBLs as described in Materials and methods.19 As is shown in Fig. 6, the levels of anti-donor IgG1 antibody but not anti-donor IgG2a, IgG2b, IgG3 and IgM antibodies in MOP3–/– mice were significantly lower than those of MOP3+/– or MOP+/+ mice at 3 weeks after immunization (P < 0·05), whereas no significant difference was observed between MOP3+/– and MOP+/+ mice. These data indicated that the in MOP3–/– mice had a slightly decreased humoral immunity.
Figure 6.
The anti-donor antibody levels in MOP3–/–, MOP3+/– or MOP3+/+ mice after immunization. Age-matched MOP3+/+, MOP3+/– and MOP3–/– mice were immunized with human PBL and the anti-donor antibodies were detected as described in Materials and methods. Data were presented as mean ± SD. *P < 0·05, compared with either MOP3+/+ mice. Seven mice were used in each group.
Significant changes in differentiating B cells in the bone marrow of MOP3–/– mice
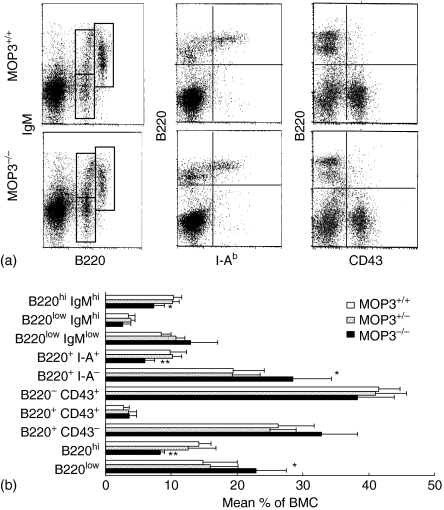
The development of B cells from haematopoietic stem cells is a complex and highly regulated process that results in antigen-specific B cells with individual immunoglobulin receptors. To assess the effect of MOP3 on B-cell development more clearly, we analysed the B-cell precursor populations in the bone marrow in each mouse line. The total cell numbers of BMC in each mouse line, MOP3–/–, MOP3+/– or MOP3+/+ were identical (data not shown). In addition, MOP3–/– mice had normal levels of B220+ CD43+ progenitor B cells (pro-B cells) and B220+ CD43– cells, suggesting the transition from CD43+ to CD43– stage is unimpaired in MOP3-deficient mice. However, the progress from the immature B220low to the mature B220high B-cell stage in MOP3–/– mice was partially but significantly blocked as indicated by the accumulated B220low cells and decreased percentages of more mature, recirculating B220high, B220high IgMhigh or B220+ I-A+ B cells in the bone marrow of MOP3–/– mice (Fig. 7). No significant differences for B-cell subpopulations between MOP3+/– and MOP+/+ mice were observed (P > 0·05).
Figure 7.
The levels of developing B cells in MOP3+/+, MOP3+/– and MOP3–/– mice. (a) One representative of B cell staining detected by two-colour FCM was shown. (b) The mean percentages of B-cell subpopulations in spleens of MOP3+/+, MOP3+/– and MOP3–/– mice. Data were presented as mean ± SD. *P < 0·05, **P < 0·01, ***P < 0·001 compared with either age-matched MOP3+/+ or MOP3+/– mice. A summary of three independent experiments were shown. More than nine mice were used in each group.
MOP3–/– BMC differentiated into B cells normally in MOP3+/+ recipients
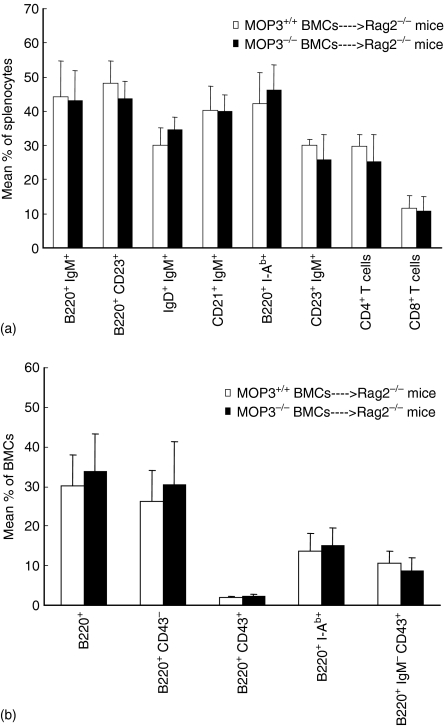
Bone marrow provides an essential microenvironment for B-cell maturation. Disruption of B-cell haematopoiesis may be caused by abnormalities in either stem cells or the developing microenvironment. To determine whether or not stem cells themselves were directly impaired in MOP3-deficient mice, we adaptively transferred MOP3–/– BMCs to 8 Gy-irradiated BALB/c Rag2–/– mice. No detectable differences for CD4+ T cells, CD8+ T cells, NK, NKT, monocytes and granulocytes in the peripheral blood were observed in BALB/c Rag2–/– recipients received either MOP3–/– or MOP3+/+ BMC at different time points after bone marrow transplantation, as evaluated by FCM (data not shown). The percentages and the total cell numbers of CD4+ T cells, CD8+ T cells, NK, NKT, monocytes and granulocytes in the spleens, as well as the numbers of different thymocyte subsets in the thymi, of BALB/c Rag2–/– mice that received MOP3–/– BMC were similar to those mice that received MOP3+/+ BMC by 4 months after bone marrow transplantation (data not shown). Surprisingly, the levels of different B-cell subpopulations or B cells in different developing stages in spleens or BMC of BALB/c Rag2–/– mice received MOP3–/– BMC did not show detectable differences compared with mice received MOP3+/+ BMC (Fig. 8). Thus, MOP3 expressed on bone marrow cells did not directly impair B-cell development in mice.
Figure 8.
Normal differentiation to B and T cells of MOP3–/– BMC in MOP3+/+ BALB/c Rag2–/– recipients. Four months after Rag2–/– mice received lethal X-rays irradiation and an injection of T-cell depleted MOP3+/+ or MOP3–/– BMC, the levels of T, B and other immune cells in peripheral blood, spleens and bone marrow were determined by two-colour FCM. (a) The levels of T and B subsets in spleens of Rag2–/– mice received either MOP3+/+ or MOP3–/– BMC. (b) The percentages of B-cell subpopulations in bone marrow of Rag2–/– mice received MOP3+/+ or MOP3–/– BMC. Data were presented as mean ± SD. Two independent experiments showing similar results were performed. No significant differences were found among the identical groups (P > 0·05).
Differentiation to B cells of allogeneic MOP3+/+ BMC was blocked in irradiated MOP3–/– recipients
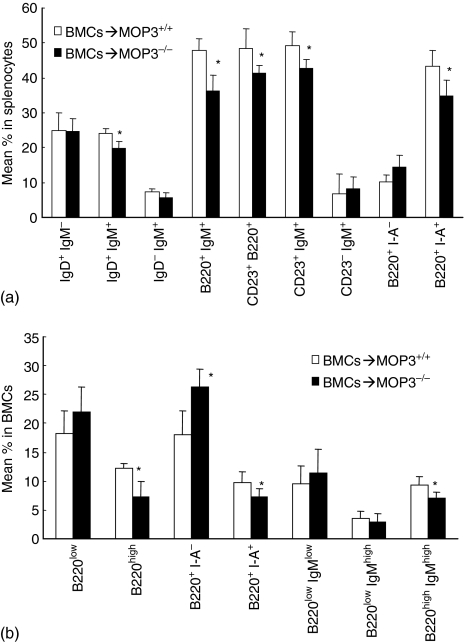
To determine the role of MOP3–/– mouse bone marrow microenvironment on B-cell maturation, we adoptively transferred allogeneic BALB/c T-cell depleted BMCs to lethally irradiated MOP3–/– and control MOP3+/+ recipients. The levels of donor cells in the peripheral blood or bone marrow were always more than 90% in this model (data not shown). Eight weeks after bone marrow transplantation, the levels of B cells in spleens and bone marrow were detected with the gating on recipient major histocompatibility complex (MHC) I– cells by FCM. As is shown in Fig. 9, significantly lower percentages of donor-original IgD+ IgM+, B220+ IgM+, CD23+ B220+, CD23+ IgM+ or B220+ I-Ad+ cells in splenocytes of MOP3–/– recipients was observed than in MOP3+/+ recipients (P < 0·05, Fig. 9a). Consistently, decreased percentages of B220high, B220+I-Ad+, or B220high IgMhigh cells as well as enhanced percentages of B220+ I-Ad– cells in the bone marrow of MOP3–/– recipients was detected than those in MOP3+/+ recipients (P < 0·05, Fig. 9b). In addition, no significantly changed levels of T cells and NK cells as well as the total cell numbers of splenocytes and BMC were observed in these MOP3–/– recipients (data not shown). These data indicate that the bone marrow microenvironment may be altered in MOP3–/– mice so that B-cell development is affected.
Figure 9.
Decreased B-cell differentiation of allogeneic BMCs in MOP3–/– recipients. Eight weeks after transplantation of T-cell depleted allogeneic BALB/c MOP3+/+ BMC to lethally irradiated MOP3–/– BMC, the levels of donor T and B cells in spleens and bone marrow were determined by three-colour FCM. (a) The levels of B-cell subsets in spleens of either MOP3+/+ or MOP3–/– recipients received BALB/c BMC. (b) The percentages of B cell subpopulations in the bone marrow of MOP3+/+ or MOP3–/– recipients received BALB/c BMC. Data were presented as mean ± SD. *P < 0·05 compared between the indicated groups. Six mice were used in each group.
Discussion
One of the earliest differentiated precursors is the multipotential progenitor (MPP), which can differentiate into the common myeloid progenitors or into the recently identified early lymphoid progenitors (ELP).25 ELP can further differentiate into thymic precursors of the T-cell lineage or into bone-marrow common lymphoid progenitors (CLP), which are lymphoid restricted and can generate B cells, T cells, dendritic cells and NK cells. Expression of the B-cell marker B220 by a subset of CLP coincides with their entry into the B-cell-differentiation pathway.24 MOP3-deficient mice showed the altered B-cell development alone, but not T cells, NK cells and monocytes, suggesting that MOP3 might not regulate the process of early haematopoietic stem cells, but possibly influence the early B-cell precursors. The present studies also suggest that B-cell commitment might be more sensitive to MOP3 than the T-cell lineage commitment.
Using the Hardy classification26 pro-B cells (also known as fraction B/C) are defined as B220+ CD43+, and pre-B cells (also known as fraction C′/D) are defined as B220+ CD43– surface IgM–. The unchanged B220+ CD43+ fraction mainly representing pro-B cells in MOP3–/– mice indicate that the earlier stem cell development is unaffected by the MOP3 gene. MOP3 seems to mainly regulate the development of B cells after or in the late period of the pre-B-cell stage, as the major decreased subpopulations in BMC of MOP3-deficient mice were B220high and B220+I-A+ cells.
Differentiation and proliferation of haematopoietic progenitor cells occurs in intimate contact with the bone marrow microenvironment, which is composed of stromal cells and extracellular matrix proteins. The stromal cells in the bone marrow, including vascular endothelial cells, adipocytes, and bone-lining cells, modulate haematopoietic development through complex mechanisms involving growth factor production as well as through cell–cell interactions mediated by cell surface molecules. Disruption of haematopoiesis may be caused by abnormalities in either stem cells or stromal cells or both. Although MOP3 mRNA expressed in both haematopoietic stem cells and bone marrow stromal cells as determined by real-time PCR.27 Our adoptive transfer experiments suggest that MOP3 expressed in stromal cells, but not in stem cells, play a role in B-cell development. The chemokine stromal cell-derived factor-1 is an essential factor for pro-B-cell development, while interleukin-7 is particularly important at the transition from pro-B to pre-B cells. Whether MOP3 deficiency caused those factors needs to be addressed.
Lymphocyte differentiation or activation is a series of finely regulated processes whereby the co-ordinate regulation of cell proliferation, differentiation, and cell death directs the development of functional cells.24,28 Cell–cell contact and soluble growth factors play an important role in the regulation of developmental processes or activation procedures.29 Self-reactive B cells specific for autoantigens are eliminated by two mechanisms of tolerance: receptor editing and clonal deletion.30,31 Our data showed that mature B cells in MOP3–/– mice responded to lipopolysaccharide in a normal way (data not shown). Although slightly decreased anti-donor IgG1 antibody production was observed in MOP3–/– mice after immunization with xenoantigens, normal levels of anti-donor IgG2a, IgG2b, IgG3 and IgM antibodies in the sera of MOP3–/– mice after immunization with xenogeneic antigens indicated that B cells in MOP3–/– mice are functional. Thus, MOP3 gene may not be crucially involved in mature B-cell activation as well as B-cell selection and tolerance in mice, although it regulates B-cell development in bone marrow. The reasons for the decreased IgG1 products in MOP3–/– mice are not clear.
Altogether, the results presented with MOP3-deficient mice reveal the involvement of MOP3 in the development of B cells, but not T cells, NK cells, macrophages and RBC in mice. The effect of MOP3 on the differentiation of pre-B cells to mature B cells is mediated by the bone marrow microenvironment. This study also showed the interaction between a component of the molecular clock with B-cell development in a mouse model.
Acknowledgments
We thank Dr Guangwei Liu for his critical review of the manuscript. This work was supported by grants from the Knowledge Innovation Program of Chinese Academy of Sciences (KSCX2-SW-333), 100 Quality Vocational Colleagues of Chinese Academy of Sciences (2003), National Science Fund for Distinguished Young Scholar, National Natural Science Foundation of China (C03020504), the National Basic Research Program (973 Program, 2003CB515501), the Scientific Research Foundation for the Returned Overseas Chinese Scholars of State Education Ministry (2005-546, Y.Z.), and Nebraska Department of Health and Human Services.
Abbreviations
- ARNT
aryl hydrocarbon receptor nuclear translocator
- bHLH
basic-helix-loop-helix domain
- BMAL1
brain and muscle Arnt-like protein-1
- BMC
bone marrow cells
- CLOCK
product of the clock locus in mice
- FITC
fluorescein isothiocyanate
- HIF
hypoxia-inducible factor
- PAS
PER-ARNT-SIM homology domain
- PE
phycoerythrin
- PER
product of the Drosophila period gene
- VEGF
Vascular endothelial growth factor
References
- 1.Hankinson O, Brooks BA, Weir-Brown KI, Hoffman EC, Johnson BS, Nanthur J, Reyes H, Watson AJ. Genetic and molecular analysis of the Ah receptor and of Cyp1a1 gene expression. Biochimie. 1991;73:61–6. doi: 10.1016/0300-9084(91)90075-c. [DOI] [PubMed] [Google Scholar]
- 2.Burbach KM, Poland A, Bradfield CA. Cloning of the Ah-receptor cDNA reveals a distinctive ligand-activated transcription factor. Proc Natl Acad Sci USA. 1992;89:8185–9. doi: 10.1073/pnas.89.17.8185. [DOI] [PMC free article] [PubMed] [Google Scholar]
- 3.King DP, Zhao Y, Sangoram AM, et al. Positional cloning of the mouse circadian clock gene. Cell. 1997;89:641–53. doi: 10.1016/s0092-8674(00)80245-7. [DOI] [PMC free article] [PubMed] [Google Scholar]
- 4.Bunger MK, Wilsbacher LD, Moran SM, et al. Mop3 is an essential component of the master circadian pacemaker in mammals. Cell. 2000;103:1009–17. doi: 10.1016/s0092-8674(00)00205-1. [DOI] [PMC free article] [PubMed] [Google Scholar]
- 5.Hogenesch JB, Gu YZ, Jain S, Bradfield CA. The basic-helix-loop-helix-PAS orphan MOP3 forms transcriptionally active complexes with circadian and hypoxia factors. Proc Natl Acad Sci USA. 1998;95:5474–9. doi: 10.1073/pnas.95.10.5474. [DOI] [PMC free article] [PubMed] [Google Scholar]
- 6.Matsuo T, Yamaguchi S, Mitsui S, Emi A, Shimoda F, Okamura H. Control mechanism of the circadian clock for timing of cell division in vivo. Science. 2003;302:255–9. doi: 10.1126/science.1086271. [DOI] [PubMed] [Google Scholar]
- 7.Oishi K, Sakamoto K, Okada T, Nagase T, Ishida N. Antiphase circadian expression between BMAL1 and period homologue mRNA in the suprachiasmatic nucleus and peripheral tissues of rats. Biochem Biophys Res Commun. 1998;253:199–203. doi: 10.1006/bbrc.1998.9779. [DOI] [PubMed] [Google Scholar]
- 8.Shimba S, Ishii N, Ohta Y, et al. Brain and muscle Arnt-like protein-1 (BMAL1), a component of the molecular clock, regulates adipogenesis. Proc Natl Acad Sci USA. 2005;102:12071–6. doi: 10.1073/pnas.0502383102. [DOI] [PMC free article] [PubMed] [Google Scholar]
- 9.Rudic RD, McNamara P, Curtis AM, Boston RC, Panda S, Hogenesch JB, Fitzgerald GA. BMAL1 and CLOCK, two essential components of the circadian clock, are involved in glucose homeostasis. PLoS Biol. 2004;2:e377. doi: 10.1371/journal.pbio.0020377. [DOI] [PMC free article] [PubMed] [Google Scholar]
- 10.Turek FW, Joshu C, Kohsaka A, et al. Obesity and metabolic syndrome in circadian Clock mutant mice. Science. 2005;308:1043–5. doi: 10.1126/science.1108750. [DOI] [PMC free article] [PubMed] [Google Scholar]
- 11.Pennathur-Das R, Levitt L. Augmentation of in vitro human marrow erythropoiesis under physiological oxygen tensions is mediated by monocytes and T lymphocytes. Blood. 1987;69:899–907. [PubMed] [Google Scholar]
- 12.Hattori K, Dias S, Heissig B, et al. Vascular endothelial growth factor and angiopoietin-1 stimulate postnatal hematopoiesis by recruitment of vasculogenic and hematopoietic stem cells. J Exp Med. 2001;193:1005–14. doi: 10.1084/jem.193.9.1005. [DOI] [PMC free article] [PubMed] [Google Scholar]
- 13.Born J, Lange T, Hansen K, Molle M, Fehm HL. Effects of sleep and circadian rhythm on human circulating immune cells. J Immunol. 1997;158:4454–64. [PubMed] [Google Scholar]
- 14.Zelazowska EB, Singh A, Raybourne RB, Sternberg EM, Gold PW, Deuster PA. Lymphocyte subpopulation expression in women: effect of exercise and circadian rhythm. Med Sci Sports Exerc. 1997;29:467–73. doi: 10.1097/00005768-199704000-00007. [DOI] [PubMed] [Google Scholar]
- 15.Zhao Y, Fishman JA, Sergio JJ, et al. Immune restoration by fetal pig thymus grafts in T cell-depleted, thymectomized mice. J Immunol. 1997;158:1641–9. [PubMed] [Google Scholar]
- 16.Sun Y, Langnas AN, Zhao Y. The interaction defect of accessory molecules is responsible for the poor ex vivo response to human antigens of mouse T helper cells. Scand J Immunol. 2003;58(1):59–66. doi: 10.1046/j.1365-3083.2003.01281.x. [DOI] [PubMed] [Google Scholar]
- 17.Yang TY, Sun Y, Langnas AN, Zhao Y. Prolongation of allogeneic skin graft survival by injection of anti-Ly49A monoclonal antibody YE1/48. Clin Immunol. 2003;106:148–54. doi: 10.1016/s1521-6616(02)00041-4. [DOI] [PubMed] [Google Scholar]
- 18.Sun Y, Li H, Langnas AN, Zhao Y. Altered allogeneic immune responses in middle-aged mice. Cell Mol Immunol. 2004;1:440–6. [PubMed] [Google Scholar]
- 19.Sun Y, Ge BS, Kasai M, et al. Induction of regulatory T cells from mature T cells by allogeneic thymic epithelial cells in vitro. Transpl Int. 2006;19:404–14. doi: 10.1111/j.1432-2277.2006.00300.x. [DOI] [PubMed] [Google Scholar]
- 20.Zhao Y, Ohdan H, Manilay JO, Sykes M. NK cell tolerance in mixed allogeneic chimeras. J Immunol. 2003;170:5398–405. doi: 10.4049/jimmunol.170.11.5398. [DOI] [PubMed] [Google Scholar]
- 21.Goidin D, Mamessier A, Staquet MJ, Schmitt D, Berthier-Vergnes O. Ribosomal 18S RNA prevails over glyceraldehyde-3-phosphate dehydrogenase and beta-actin genes as internal standard for quantitative comparison of mRNA levels in invasive and noninvasive human melanoma cell subpopulations. Anal Biochem. 2001;295:17–21. doi: 10.1006/abio.2001.5171. [DOI] [PubMed] [Google Scholar]
- 22.von Boehmer H. Selection of the T-cell repertoire: receptor-controlled checkpoints in T-cell development. Adv Immunol. 2004;84:201–38. doi: 10.1016/S0065-2776(04)84006-9. [DOI] [PubMed] [Google Scholar]
- 23.Zuniga-Pflucker JC. T-cell development made simple. Nat Rev Immunol. 2004;4:67–72. doi: 10.1038/nri1257. [DOI] [PubMed] [Google Scholar]
- 24.Matthias P, Rolink AG. Transcriptional networks in developing and mature B cells. Nat Rev Immunol. 2005;5:497–508. doi: 10.1038/nri1633. [DOI] [PubMed] [Google Scholar]
- 25.Medina KL, Garrett KP, Thompson LF, Rossi MI, Payne KJ, Kincade PW. Identification of very early lymphoid precursors in bone marrow and their regulation by estrogen. Nat Immunol. 2001;2:718–24. doi: 10.1038/90659. [DOI] [PubMed] [Google Scholar]
- 26.Hardy RR, Hayakawa K. B cell development pathways. Annu Rev Immunol. 2001;19:595–621. doi: 10.1146/annurev.immunol.19.1.595. [DOI] [PubMed] [Google Scholar]
- 27.Tsinkalovsky O, Rosenlund B, Laerum OD, Eiken HG. Clock gene expression in purified mouse hematopoietic stem cells. Exp Hematol. 2005;33:100–7. doi: 10.1016/j.exphem.2004.09.007. [DOI] [PubMed] [Google Scholar]
- 28.McHeyzer-Williams LJ, McHeyzer-Williams MG. Antigenspecific memory B cell development. Annu Rev Immunol. 2005;23:487–513. doi: 10.1146/annurev.immunol.23.021704.115732. [DOI] [PubMed] [Google Scholar]
- 29.Busslinger M. Transcriptional control of early B cell development. Annu Rev Immunol. 2004;22:55–79. doi: 10.1146/annurev.immunol.22.012703.104807. [DOI] [PubMed] [Google Scholar]
- 30.Halverson R, Torres RM, Pelanda R. Receptor editing is the main mechanism of B cell tolerance toward membrane antigens. Nat Immunol. 2004;5:645–50. doi: 10.1038/ni1076. [DOI] [PubMed] [Google Scholar]
- 31.Martin F, Chan AC. Pathogenic roles of B cells in human autoimmunity; insights from the clinic. Immunity. 2004;20:517–27. doi: 10.1016/s1074-7613(04)00112-8. [DOI] [PubMed] [Google Scholar]


